Optimize AI costs
The Cost section in AI Center pairs two complementary views. The monitoring widgets — KPIs, model breakdown, token distribution, and top spenders — give you the overall picture: what you're spending, how it's trending, and which apps, models, and users drive the cost. Optimization insights works the other side: it scans live span data for costly patterns — truncated responses, runaway tool loops, untapped caching — and surfaces ranked, span-linked suggestions for reducing spend.
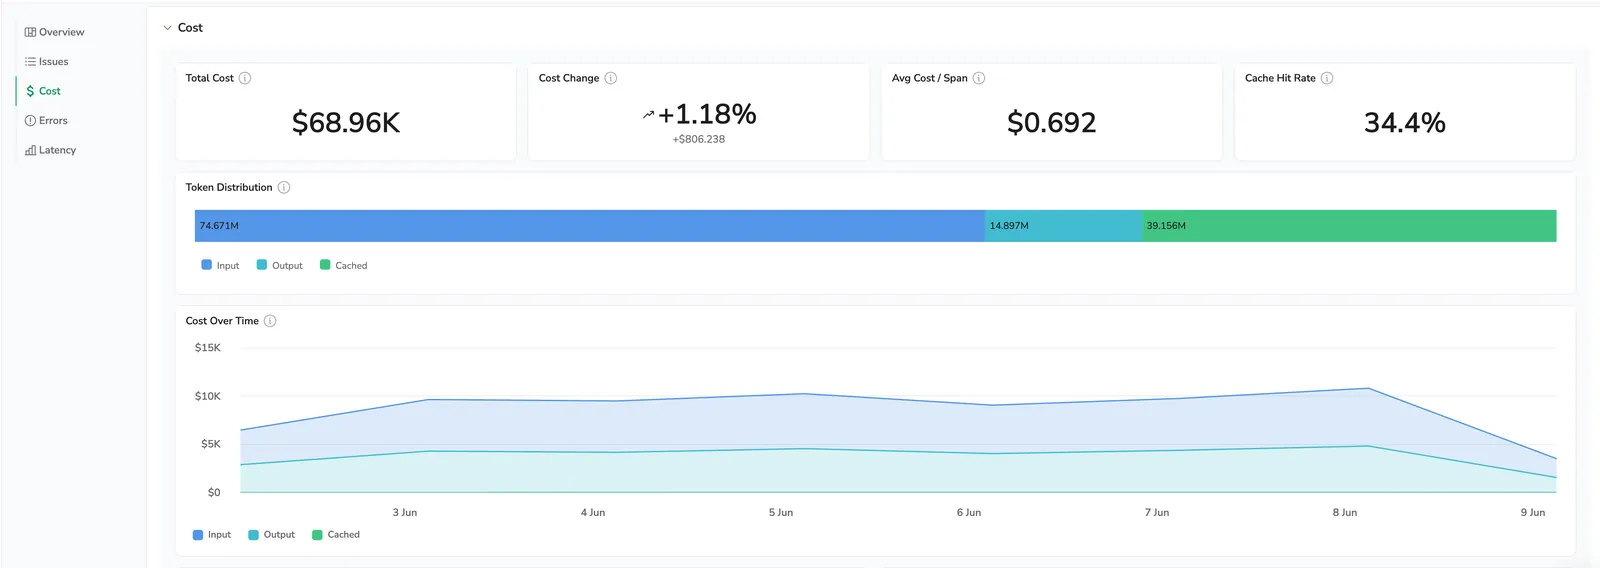
Surfaces overall AI spend with the four headline KPIs, a Token distribution bar, and a Cost over time area chart so you can see direction at a glance.
What you need
Every AI span must carry the standard OpenTelemetry GenAI usage attributes — token counts, the model, the provider, and the cache-read and cache-write variants for the cache metrics. See the Span attribute inventory for the full list and per-attribute notes.
If your spans don't yet emit cache attributes, jump to Send cache and cost data to Coralogix.
Where cost lives
Cost is available in two scopes, with the same widget set:
| View | Scope | Extra widget |
|---|---|---|
| AI Center Overview | All applications in your organization | Most expensive applications |
| Application Drilldown | A single application | High-spending users |
Both views respect the time range picker.
To open Cost:
- In the Coralogix UI, select AI Center, then Overview.
- To see organization-wide cost, select Cost in the sidebar.
- To see cost for one application, open Application Catalog, select an application, then select Cost in the drilldown sidebar.
Optimization insights
Optimization insights runs six deterministic rules against your live span data. The rules that fire on your data show up as cards, ranked by estimated savings.
Take Responses are getting cut off as an example. The card fires when at least 5% of your responses stop at the model's token limit instead of finishing naturally. That means you're paying for calls that didn't deliver an answer, users are seeing truncated responses, and the spend on those calls is wasted. The card tells you the exact share, links to a representative span in AI Explorer so you can see the cut-off in context, and points at the fix: raise the max-token limit or shorten prompts so calls finish, and stop paying for output you can't use.
The six rules:
| # | Insight | Fires when | Default threshold |
|---|---|---|---|
| 1 | Responses are getting cut off | At least 5% of responses stop with finish_reason="length" (truncated) | 5% truncated share |
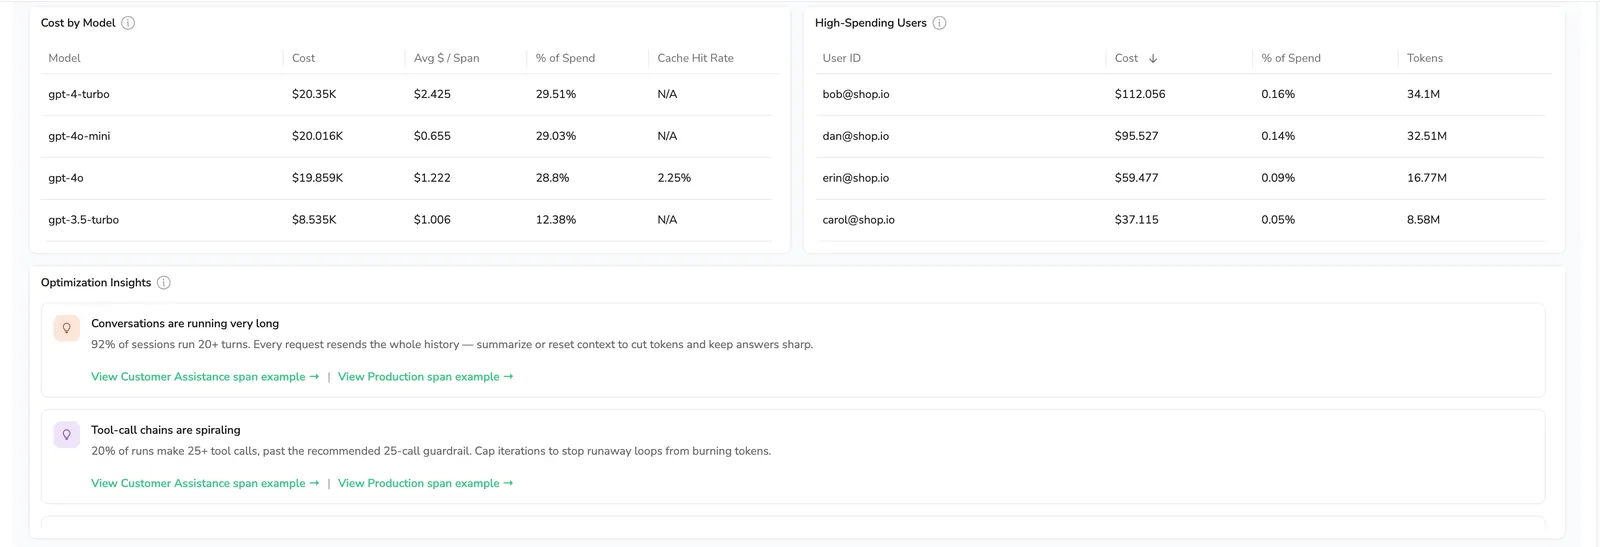
| 2 | Conversations are running very long | p95 conversation length is at least 20 turns | 20 turns, minimum 20 distinct conversations |
| 3 | Tool-call chains are spiraling | p95 tool calls per trace exceeds 25 (the agent guardrail) | 25 calls, minimum 20 traces |
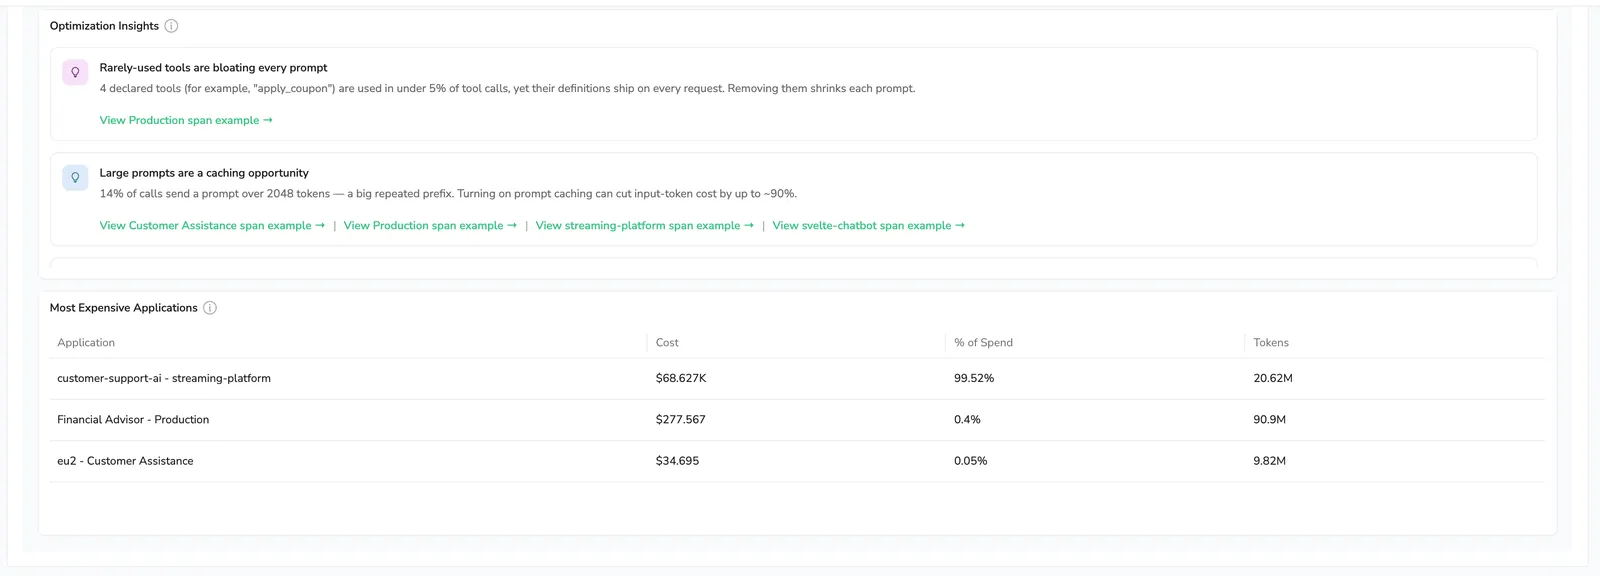
| 4 | Rarely-used tools are bloating every prompt | A declared tool appears in fewer than 5% of calls but ships on every request | 5% usage share, minimum 100 tool calls |
| 5 | Large prompts are a caching opportunity | At least 5% of calls send a prompt larger than 2048 tokens (big repeated prefix → turn on caching) | 2048 tokens, 5% share, minimum 100 spans |
| 6 | Prompt caching is barely hitting | A cache-capable model has a cache hit rate under 10% | 10% hit rate, minimum 100 spans with cache data |
Every card exposes the same See a span example → action so you can confirm the pattern before changing anything. Cards are qualitative — they tell you what looks wrong and where to investigate, not what to change automatically. Rules with minimum-sample gates (long-conversation, tool-chain, unused-tool, large-prompt, low-cache-hit-rate) wait for enough traffic to be reliable, so low-traffic applications may show no insights at all.
Monitoring widgets
KPI strip
Four headline metrics tell you at a glance whether AI spend is on track and where to dig if it isn't.
- Total cost — Your AI bill for the selected range. Scoped to one application on the Application Drilldown or the whole organization on the AI Center Overview.
- Cost change — Absolute and percentage change in total cost between the selected time range and the equivalent preceding period. Looking at the last 7 days compares against the 7 days before it, so you can tell at a glance whether spend is trending up or down.
- Avg cost / span — Total cost divided by AI span count. Catches the expensive-per-call pattern when totals look flat.
- Cache hit rate — Percentage of input tokens served from cache. Tells you whether caching is paying off; a low rate on a cache-capable model is money on the table (and Insight #6 flags this automatically).
Token distribution
A stacked bar splitting tokens in the selected range into Input, Output, and Cached, so you can see where token volume concentrates.
Cost over time
A stacked area chart of cost across the selected window, split by input, output, and cached tokens — shows when a spike started and which token type drove it.
Cost by model
A table ranking every model in use by total cost, with Avg $ / span, % of spend, and Cache hit rate alongside (Cache hit rate reads N/A when a model's spans carry no cache attributes).
High-spending users
Ranks users by total cost in the selected range; visible on the Application Drilldown.
Most expensive applications
Ranks applications by total cost in the selected range; visible on the AI Center Overview.
Configure model pricing
Cost metrics are only as accurate as the per-token rates behind them. By default, Coralogix prices every model at its provider's public list rate — but most organizations negotiate enterprise rates, and self-hosted or fine-tuned models have their own cost structures, so public pricing rarely matches what you actually pay. Model Pricing lets you set the rates you pay per model; those rates override the default pricing, so every cost metric reflects your real spend.
Select Model Pricing in the Cost section header to open the pricing dialog box. You set pricing once at the organization level: the same dialog box and the same rates apply on both the AI Center Overview and the Application Drilldown, with no per-application overrides. A rate you change applies across every application.
The dialog box lists every model Coralogix has detected in your AI spans, each pre-filled with default public pricing that you can override.
Set four per-token rates for each model, all priced per 1M tokens:
| Field | Applies to |
|---|---|
| Input | Prompt tokens sent to the model |
| Output | Tokens the model generates |
| Cache read | Input tokens served from cache |
| Cache write | Input tokens written to cache |
How Coralogix derives cost and cache metrics
- Total cost sums the per-span price tags
gen_ai.prompt_price,gen_ai.response_price,gen_ai.read_cache_price, andgen_ai.write_cache_priceacross the selected range and scope. - Cache hit rate is cache-read tokens divided by input tokens. Cached reads count as a subset of input tokens.
- Cost change compares total cost for the selected range against total cost for the equivalent preceding period (the last 7 days versus the 7 days before), reported as both an absolute difference and a percentage.
Send cache and cost data to Coralogix
Cache hit rate and accurate cost on cache-writing providers rely on two span attributes, both defined by the OpenTelemetry GenAI semantic conventions:
| Attribute | Meaning | Used for |
|---|---|---|
gen_ai.usage.cache_read.input_tokens | Input tokens served from cache | Cache hit rate |
gen_ai.usage.cache_creation.input_tokens | Input tokens written to cache (Anthropic and Bedrock only) | Total cost (cache-write billing) |
Always also send gen_ai.provider.name so Coralogix applies the correct hit-rate formula per provider. Send the raw value exactly as the provider returns it — do not pre-normalize it.
Providers that return cache usage
Confirm your provider returns cache data before relying on Cache hit rate.
| Provider | Returns cache | Reads | Writes |
|---|---|---|---|
| OpenAI / Azure OpenAI | Yes | Yes | No (automatic) |
| Anthropic | Yes | Yes | Yes |
| AWS Bedrock | Yes (model-dependent) | Yes | Yes |
| Google Gemini | Yes (cachedContentTokenCount) | Yes | Implicit or explicit |
| DeepSeek | Yes | Yes | No (automatic) |
| Self-hosted (vLLM, Ollama, …) | No | — | — |
Emit the cache tags
Use an open-source GenAI instrumentation library — for example, OpenLLMetry or the Pydantic-AI auto-instrumentor — which sets these attributes on the span for you. See Send GenAI data to Coralogix for the full setup.
If your instrumentation does not set the cache attributes yet, add a response hook. Most libraries expose a callback that runs while the provider response is still in scope — read the cache fields off it and write the canonical attributes on the span before export.
Hook names vary by library: response_hook, responseHook, on_response. The principle is the same — the hook fires while the response is in scope, so you can copy the cache fields onto the span. AWS Bedrock Converse names the write field cacheWriteInputTokens. For whichever shape your SDK returns, set the canonical attribute name on the span.
Register this response_hook with your instrumentation library to copy each provider's cache fields onto the canonical gen_ai.usage.cache_read.input_tokens and gen_ai.usage.cache_creation.input_tokens attributes. The branches cover OpenAI, Azure, DeepSeek, Anthropic, AWS Bedrock, and Google Gemini in one function.
def response_hook(span, request, response):
    def read(obj, key):
        if obj is None:
            return None
        return obj.get(key) if isinstance(obj, dict) else getattr(obj, key, None)

    def emit(attr, value):
        if value is not None:  # 0 is a valid count, so guard on None
            span.set_attribute(attr, value)

    READ = "gen_ai.usage.cache_read.input_tokens"
    WRITE = "gen_ai.usage.cache_creation.input_tokens"

    usage = read(response, "usage")  # object (OpenAI/Anthropic) or dict (Bedrock)
    if usage is None:
        # Gemini reports cache under usage_metadata, not usage
        emit(READ, read(read(response, "usage_metadata"), "cached_content_token_count"))
        return

    # OpenAI / Azure / DeepSeek (via OpenAI-compatible wrappers)
    emit(READ, read(read(usage, "prompt_tokens_details"), "cached_tokens"))

    # Anthropic (snake_case) — reads and writes
    emit(READ, read(usage, "cache_read_input_tokens"))
    emit(WRITE, read(usage, "cache_creation_input_tokens"))

    # AWS Bedrock Converse (camelCase) — reads and writes
    emit(READ, read(usage, "cacheReadInputTokens"))
    emit(WRITE, read(usage, "cacheWriteInputTokens"))


# Register per your instrumentation API, for example:
OpenAIInstrumentor().instrument(response_hook=response_hook)
Same logic in TypeScript: pass this responseHook to OpenLLMetry's instrumentation (or any library exposing an equivalent callback) and it maps each provider's cache fields onto the canonical attributes. Handles the same OpenAI-compatible, Anthropic, AWS Bedrock, and Gemini response shapes as the Python version.
import { OpenAIInstrumentation } from '@traceloop/instrumentation-openai';
import type { Span } from '@opentelemetry/api';

const responseHook = (span: Span, response: unknown): void => {
  const obj = (v: unknown): Record<string, unknown> =>
    (typeof v === 'object' && v !== null ? v : {}) as Record<string, unknown>;
  const set = (attr: string, value: unknown): void => {
    if (typeof value === 'number') span.setAttribute(attr, value); // 0 is valid
  };

  const r = obj(response);
  const usage = r['usage']; // object (OpenAI/Anthropic) or dict (Bedrock)
  if (usage === undefined || usage === null) {
    // Gemini reports cache under usageMetadata, not usage
    set(
      'gen_ai.usage.cache_read.input_tokens',
      obj(r['usageMetadata'])['cachedContentTokenCount'],
    );
    return;
  }
  const u = obj(usage);

  // OpenAI / Azure / DeepSeek (via OpenAI-compatible wrappers)
  set(
    'gen_ai.usage.cache_read.input_tokens',
    obj(u['prompt_tokens_details'])['cached_tokens'],
  );

  // Anthropic (snake_case) — reads and writes
  set('gen_ai.usage.cache_read.input_tokens', u['cache_read_input_tokens']);
  set(
    'gen_ai.usage.cache_creation.input_tokens',
    u['cache_creation_input_tokens'],
  );

  // AWS Bedrock Converse (camelCase) — reads and writes
  set('gen_ai.usage.cache_read.input_tokens', u['cacheReadInputTokens']);
  set(
    'gen_ai.usage.cache_creation.input_tokens',
    u['cacheWriteInputTokens'],
  );
};

new OpenAIInstrumentation({ responseHook });
Next steps
Drill into the specific span behind any cost insight with AI Explorer.