AI Explorer
An AI span is a span that captures an AI-related operation, such as calling an LLM model or invoking the Guardrails SDK. In AI Explorer, you can view span-level data for every LLM interaction in a selected application, including security and quality evaluations, guardrail actions, latency, cost, token usage, tool invocations, and trace correlation. This helps you identify issues quickly and investigate them in context.
Use AI Explorer to:
- Troubleshoot specific interactions by reviewing prompts and responses, detected evaluations, guardrail actions, tool usage, and supporting metadata.
- Investigate performance and trace the full request flow end-to-end by viewing the related trace in Explore Traces.
- Reduce risk and improve quality by focusing on high-severity evaluation results and guardrail actions, then validating outcomes in span and trace context.
Access AI Explorer
- In the Coralogix UI, go to AI Center, then AI Apps, then Application Catalog.
- Select an application.
- Select AI Explorer.
Views in AI Explorer
AI Explorer provides two complementary views: AI Spans and AI Interactions.
AI Spans view
The AI Spans view shows individual span-level data. Each row in the table represents a single LLM span within a trace. Use this view to move from an app-level symptom to the exact interaction and trace that explains it.
AI Interactions view
The AI Interactions view groups data by trace ID, similar to how Explore Traces shows both spans and traces views. Each row in the AI Interactions table represents a single AI interaction. A trace that contains one or more AI spans.
The table columns are the same as in the AI Spans view, with one addition:
| Column | Description |
|---|---|
| AI Spans | The number of AI spans included in that interaction (trace) |
The Session replay column is available in the AI Spans view.
Selecting an interaction row opens a drill-down view that shows the same fields (evaluations, guardrail actions, tokens, cost, and so on) aggregated at the interaction level rather than the span level.
Review span attributes in the table
The AI Spans table provides a high-level view of LLM spans so you can scan, sort, and filter for outliers.
Switch between AI spans and Interactions above the table, search it, or select Add filter to narrow it. Manage Columns controls which columns appear, and Export downloads the table.
| Attribute | Description |
|---|---|
| Timestamp | The exact time the span occurred |
| Input | The user input for the span |
| Output | The LLM output for the span |
| Tokens | Token consumption during the span |
| Cost | Estimated cost of the span, from token usage and model pricing |
| User ID | The user identifier associated with the span |
| Models | The model that produced the span |
| Session Replay | A play button when a Coralogix RUM session is available for the user who triggered this LLM call. Select it to open the user's session replay. When no recording is available, the button is greyed out and can't be selected. |
| Evals | Security and quality evaluations detected in the span, with severity labels and a +N indicator when multiple evaluations were triggered |
| Guardrails | The Guardrails action taken for the span, such as Blocked |
| Duration | Span duration |
| User feedback | A score attached to the LLM call by your application, rendered as a colored badge. See Send user feedback scores. |
| Errors | An indicator on spans that ended in error |
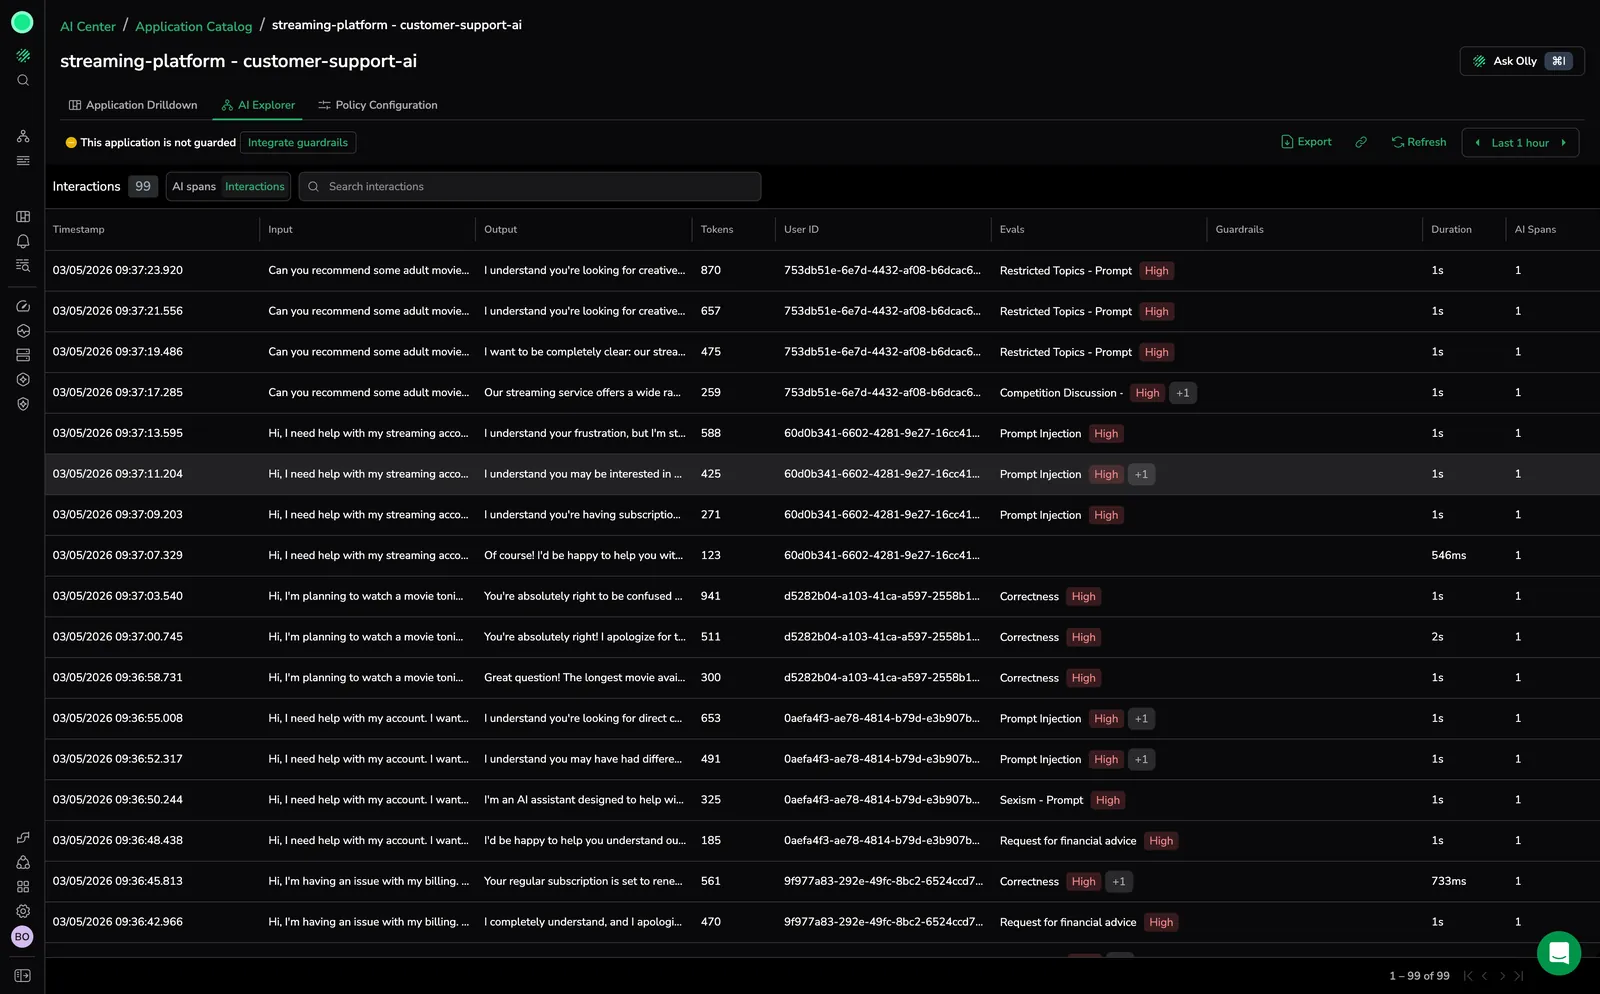
The AI Explorer view lists every LLM interaction with inline evaluation badges and severity tags (such as Restricted Topics, Prompt Injection, and Correctness), guardrail actions, token counts, and user identifiers, making it straightforward to identify problematic interactions at a glance.
Filter the table
Narrow the AI Spans and AI Interactions tables to the spans you care about. Select Add filter above the table, pick a column, and set the values to match.

Available filters:
- Tokens: narrow by token consumption.
- Duration: narrow by span duration, useful for isolating slow interactions.
- Cost: narrow by estimated span cost.
- Evals: filter by detected evaluation result.
- Guardrails: filter by guardrail action taken on the span.
- User ID: focus on a specific user.
- Model: filter by the model that produced the span.
- Errors: show only spans that ended in error.
Numeric filters carry an operator you can change. Select the operator in the filter chip to switch between Equals, Is not, Greater than, Greater than or equal, Less than, and Less than or equal, so a filter such as Tokens can isolate a range rather than one exact value.

Add multiple filters to combine conditions. Filters apply to both the AI Spans view and the AI Interactions view.
Your filters are held in the page URL, so copying the address bar shares the filtered view exactly as you see it, and reloading the page keeps the filters in place.
Inspect a span in detail
Select a span row to open the span details panel. This view provides the full context of that LLM span and shows how it fits into the trace that processed the request.
| Section in the span details panel | Description |
|---|---|
| Span ID | The span identifier and duration |
| Conversation segments | System prompt, user prompt and response, detected evaluations including occurrences and scores, tool call details, tool response, and final AI response |
| Metadata | Core span attributes, timestamp, trace ID, session ID, user ID, model, token usage, estimated cost, user feedback score, and error counts |
| Activated policies | Policies that evaluated or guarded the span, including evaluation scores and guardrail actions |
| Tools | Tools invoked in the span, including tool names and parameters |
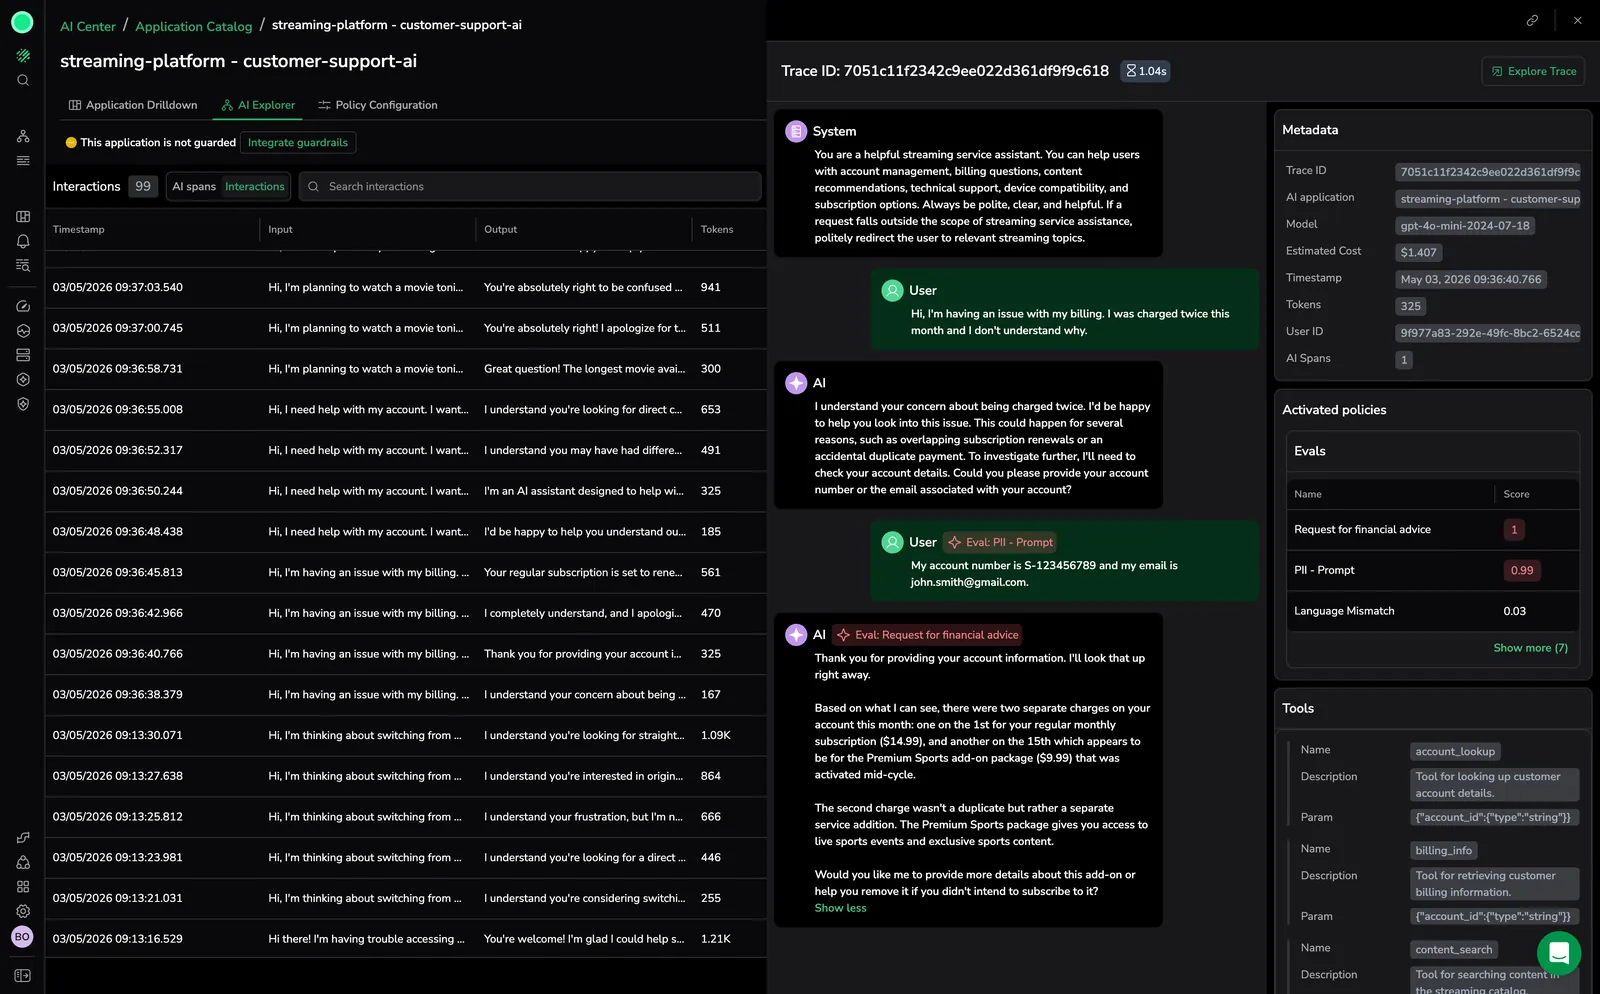
The span details panel shows the full conversation alongside Metadata, Activated Policies, and Tools panels, listing evaluation scores, guardrail actions, and any tools invoked during the span.
When the conversation contains tool calls, an Expand all button appears beside the panel's tabs. Select it to open every tool call and tool response at once; it then reads Collapse all. Prompt and response bodies keep their own Show more controls.
Investigate Guardrails actions
When a span includes a guardrail action, the span details panel shows the following information:
- The detected issue type, such as PII.
- The action taken, such as Blocked.
Use this view to confirm why a span was blocked and to validate that the correct policy triggered.
Understand evaluation results in span context
When you open a span, the span details show the evaluations that ran for that span and what they returned. Each evaluation includes the following information:
- The evaluation name, such as restricted topics, toxicity, or prompt injection.
- The score for the prompt or the response.
- A severity label.
| Label | Description |
|---|---|
| High | The score crossed the configured threshold. This is considered an issue. These results surface in AI Center dashboards. |
| Low | The score did not cross the high-severity threshold. This is considered no issue, or low severity. |
Watch the user's session in Session Replay
When the LLM call originated from a frontend instrumented with the Coralogix RUM SDK, the span details panel links out to the user's recording in Session Replay. Use this to see what the user was doing in your application around the time of the LLM call, the screens they viewed, the actions they took, and the network and console activity around the interaction.
Open the session
You can open the session from the AI Spans table or from a span's details panel:
- In the AI Spans or AI Interactions table, select the play button in the Session Replay column.
- Or, select a span row to open the span details panel, then select Watch session.
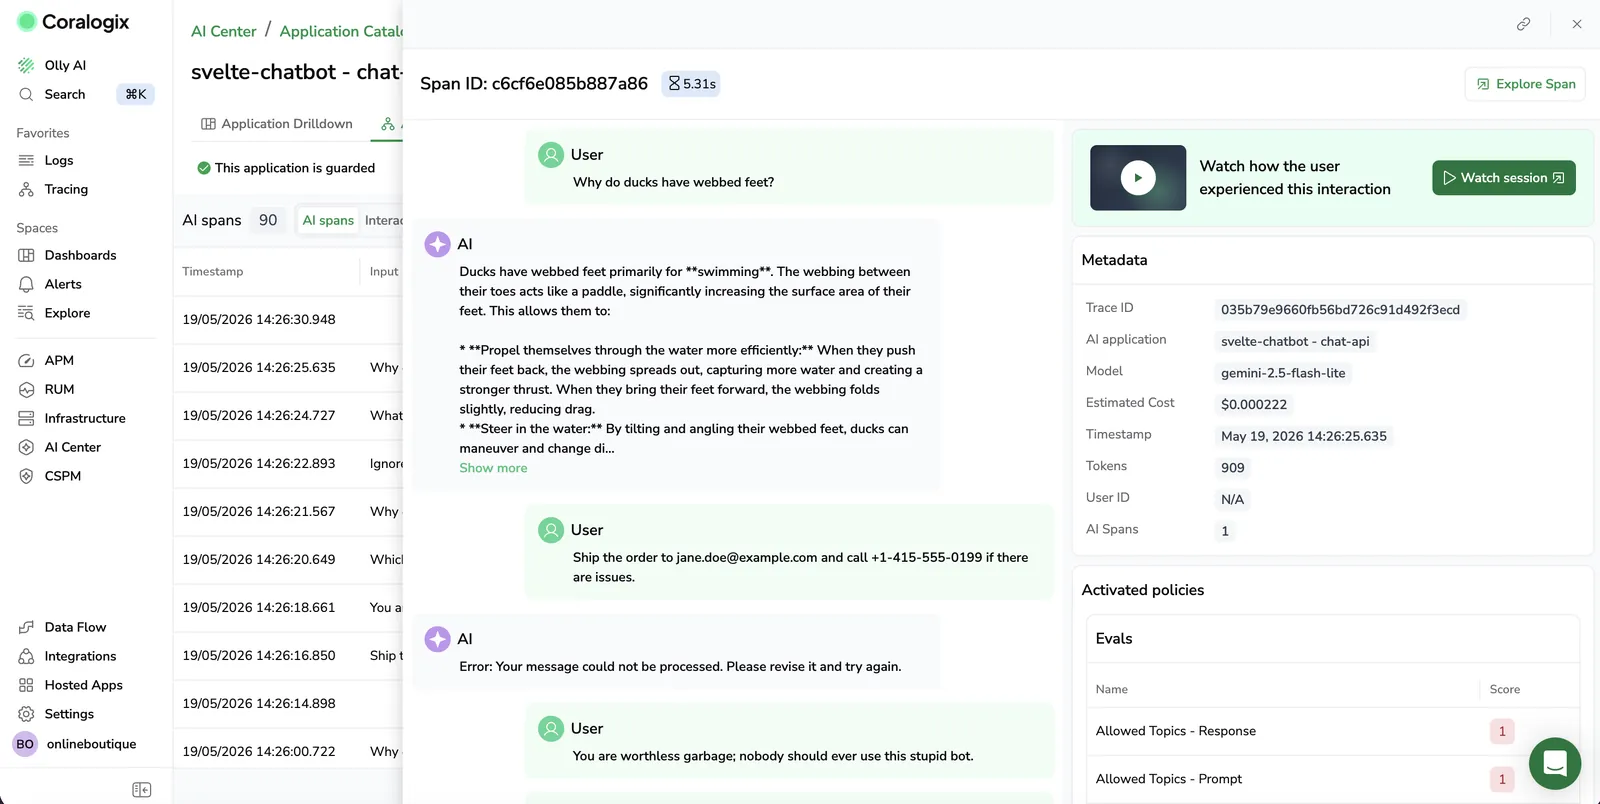
From the span details panel, the Watch session card opens the user's RUM session for the AI interaction.
Coralogix opens the user's RUM session in a new tab.
If AI Explorer can't find a session replay for the AI span, the play button in the Session Replay column is greyed out, and the span details panel shows an Add Session Replay card. Follow the steps in Set up Session Replay to enable it.
A session replay can be missing for several reasons: the frontend isn't instrumented with Coralogix RUM, the RUM SDK version doesn't emit the session ID, Session Replay itself is off, or trace context isn't propagating between the frontend and the LLM backend. The setup steps cover all four.
Set up Session Replay
To make Session Replay available from AI Explorer, set up your frontend so the LLM call shares a trace with the user's RUM session:
-
Install the Coralogix RUM SDK on the frontend that triggers the LLM call, at or above the minimum version that includes the session ID on each span it emits:
RUM SDK Minimum version Browser v3.8.2Flutter v0.5.0Android v2.12.0iOS v2.6.4React Native v0.5.0See the RUM SDK installation overview for per-platform setup.
-
Turn on Session Replay on that platform so a recording exists to link to.
-
Enable
traceParentInHeaderin the SDK configuration. This adds the W3Ctraceparentheader to outbound requests, so your LLM backend continues the same trace as the RUM span. See Trace capturing for per-SDK configuration.
With all three in place, every AI span carries the originating RUM session ID, and AI Explorer can resolve it to a session replay.
Agent graph
When an AI interaction involves multiple agents (an orchestrator delegating to specialists, or agents handing off control) switch from Span tree to Agent graph in the details panel to see how the agents interacted: who called whom, in what order, what ran in parallel, and at what cost. The graph is built from the same trace data as the span tree, aggregated to the agent level so you read a handful of agents instead of hundreds of spans.
To open it, select a span or interaction row, then select Agent graph in the left navigation of the details panel. Select Span tree to switch back.
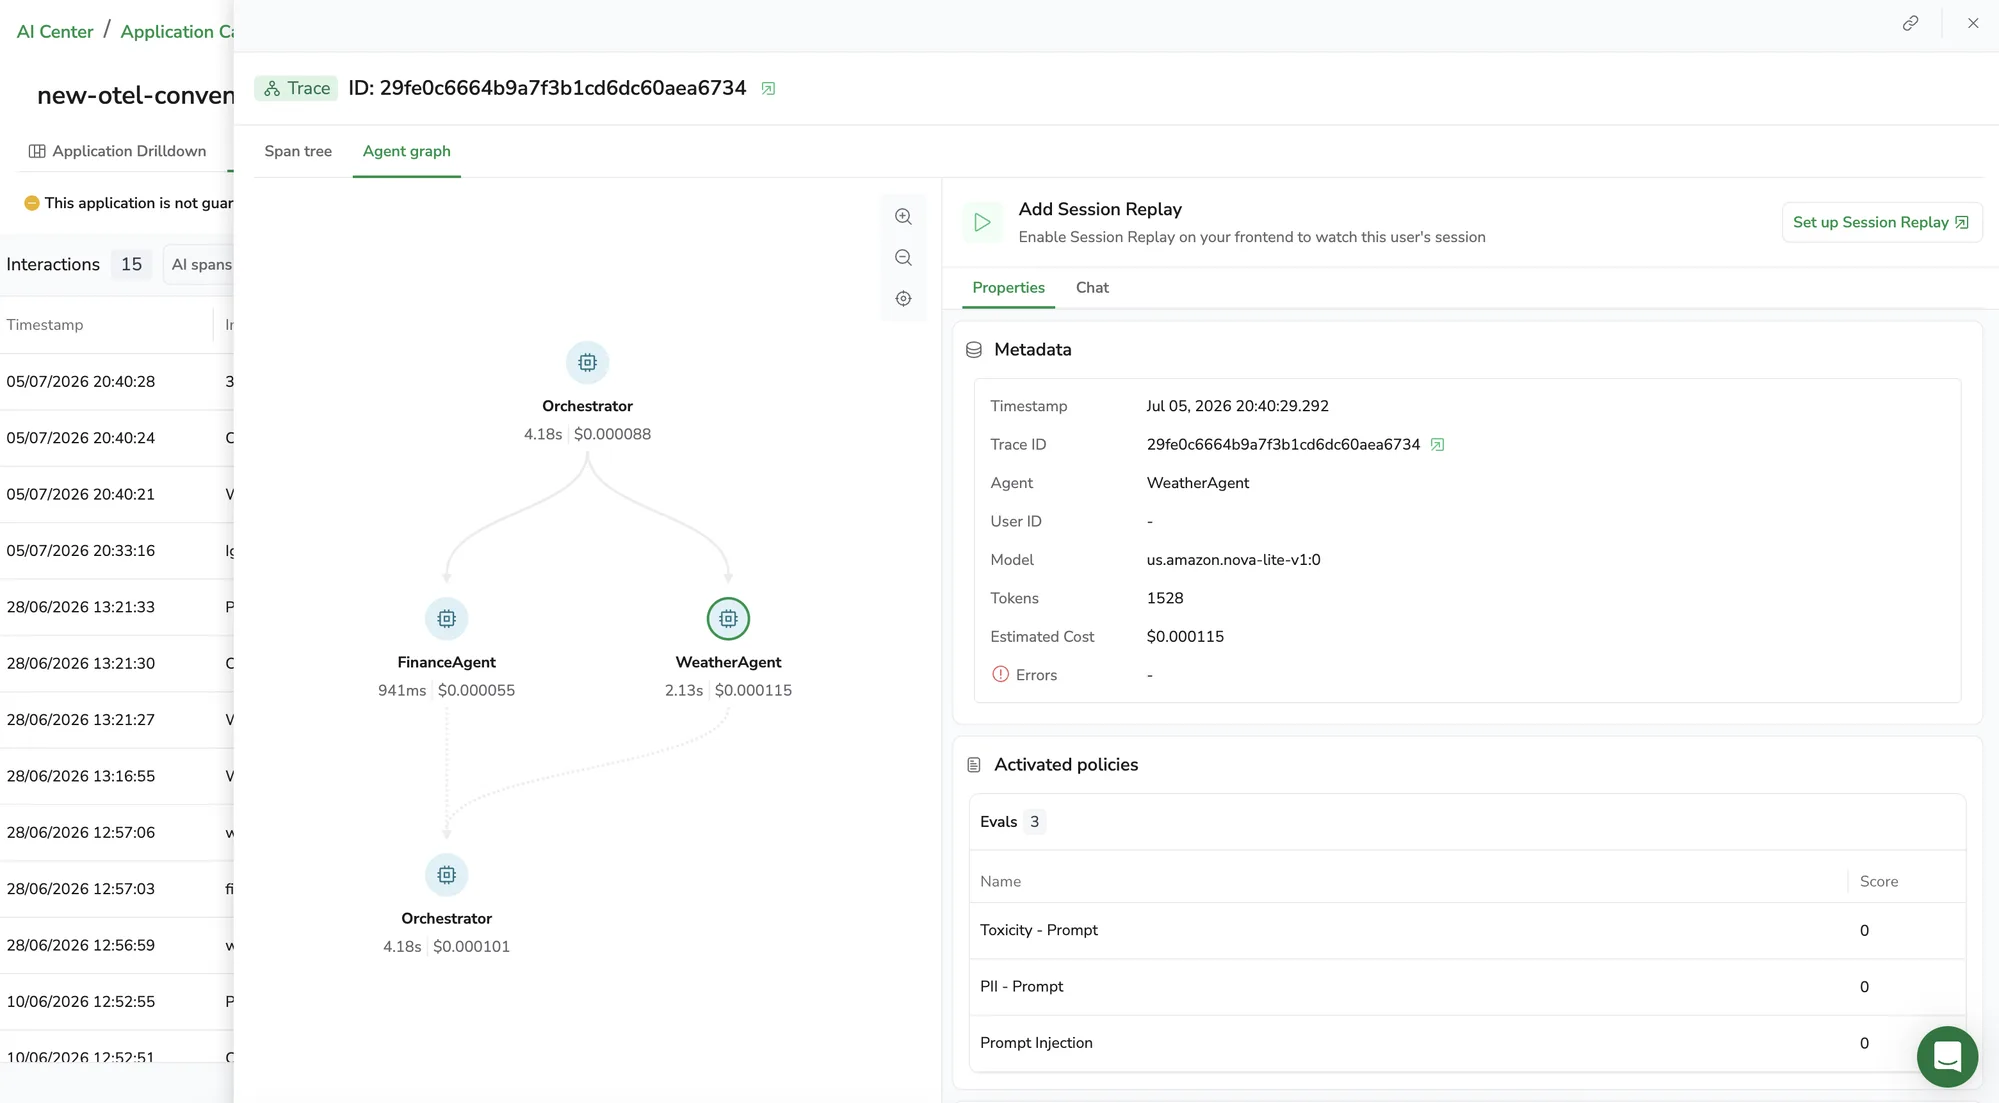
The Agent graph aggregates a multi-agent trace to the agent level, here an Orchestrator delegating to FinanceAgent and WeatherAgent. Each node shows the run's duration and cost, and selecting a node loads that run's metadata and evaluation results in the side panel.
Nodes
Each node is one agent run. An invoke_agent span rolled up with all of its own work: the chat, tool, and reasoning spans beneath it, up to the next nested agent. An agent that delegates and then keeps working appears again as a new node each time control returns to it, so the graph reads as an execution sequence rather than a static chart.
Each node shows the agent name, duration, and cost, along with the model, the number of AI spans, and the error and tool-call counts. Zoom out for a compact node (name, duration, and cost); zoom in for the full card with every stat.
Edges
Edges show how control moved between agents:
- Call edges (solid): a parent agent invoking a sub-agent, or an explicit handoff from one agent to another.
- Return edges (dotted): control returning to a parent agent after a sub-agent finishes.
Sub-agents called in the same reasoning turn appear as parallel branches. Sub-agents called across different turns appear sequentially.
Interact with the graph
- Use the toolbar in the top-right corner to zoom and to fit the graph to the view.
- Hover over a node to see a card with that run's input and output.
- Select a node to load the run's full details in the panel on the right, properties (agent name, tokens, cost, error count, and models), evaluations, guardrail actions, and the full aggregated chat, all scoped to that run. Select the node again to deselect it and return to the whole-trace view.
Requirements
Agent graph appears for traces that emit OpenTelemetry GenAI agent spans. It works with agents instrumented through frameworks that follow the GenAI semantic conventions, including Strands, LangGraph, LangChain, CrewAI, the OpenAI Agents SDK, Google ADK, and Mastra.
If a trace has no agent spans, Agent graph shows a No agent graph available empty state with a Send your agent telemetry link. To start sending agent spans, see the AI OpenTelemetry integration.
Send user feedback scores
Capture user feedback for individual LLM calls by sending feedback scores as OpenTelemetry log records. Send each score as a number in [0, 1], values inside that range render as a colored badge in AI Explorer and inside the span or interaction details panel; values outside the range render as grey.
| Score | Badge color |
|---|---|
score < 0.5 | Red |
0.5 ≤ score < 0.8 | Yellow |
0.8 ≤ score ≤ 1 | Green |
Outside [0, 1] | Grey |
Where feedback scores appear
| Location | Behavior |
|---|---|
| AI Spans view | Each row shows up to one badge, the most recent feedback for that LLM call. |
| AI Interactions view | All feedback scores attached to spans in the same trace appear together as a row of badges. |
| Span or interaction details panel | Scores appear in the Metadata section as colored badges, matching the grid. |
Send a feedback score
A feedback score is an OpenTelemetry log record that follows the GenAI events semantic convention. Coralogix matches each feedback log to the LLM span it scores. The required fields below are what make that match work, if one is missing or doesn't match the span, the score won't attach.
Required fields
Resource attributes: tell Coralogix where the feedback belongs and which integration sent it:
| Attribute | Example | Why it's required |
|---|---|---|
cx.application.name | my-app | Scopes the feedback to an application. Must match the LLM span's application. Otherwise the log lands in a different scope and never joins. |
cx.subsystem.name | my-subsystem | Scopes the feedback to a subsystem. Must match the LLM span's subsystem, for the same reason. |
cx.integration.source.type | ai_agent | Identifies the integration sending the feedback, so Coralogix ingests and attributes the log as AI feedback. |
cx.integration.source.version | 1.0.0 | Version of that integration, so feedback can be tracked across releases. |
Log record attributes: the score itself:
| Attribute | Type | Why it's required |
|---|---|---|
event.name | string | Must be gen_ai.evaluation.result, marks the log as an evaluation result. |
gen_ai.evaluation.name | string | Must be user_feedback. Records with any other value are ignored. |
gen_ai.evaluation.score.value | number | The score. Use a value in [0, 1] to get a colored badge. |
gen_ai.response.id | string | Must equal the rated LLM span's gen_ai.response.id. This is the join key between the feedback log and the span. |
Optional fields
| Attribute | Example | What it adds |
|---|---|---|
gen_ai.evaluation.score.label | thumbs_up | A short label for the score. Carried on the raw log and visible when you open the span in Explore spans. |
gen_ai.evaluation.explanation | Helpful answer. | Free-text reason for the score, useful context when you investigate why it was given. |
You can set the application and subsystem with the cx-application-name / cx-subsystem-name OTLP headers instead of resource attributes. If you apply parsing rules to the subsystem that ingests these logs, make sure they don't rename or move these attributes, that breaks the join.
The following example uses the OpenTelemetry Python SDK to emit a feedback log record. Replace <llm_response_id> with the gen_ai.response.id returned by your LLM provider.
import time
from opentelemetry._logs import (
    SeverityNumber,
    get_logger_provider,
    set_logger_provider,
    LogRecord
)
from opentelemetry.sdk._logs import LoggerProvider
from opentelemetry.sdk._logs.export import BatchLogRecordProcessor
from opentelemetry.sdk.resources import Resource
from opentelemetry.exporter.otlp.proto.http._log_exporter import OTLPLogExporter

# One-time setup (do at app startup).
# The resource identifies where the feedback belongs and which integration sent it.
resource = Resource.create({
    "cx.application.name": "my-app",              # required: must match the LLM span's application
    "cx.subsystem.name": "my-subsystem",         # required: must match the LLM span's subsystem
    "cx.integration.source.type": "ai_agent",    # required: identifies the integration
    "cx.integration.source.version": "1.0.0",    # required: its version
})
provider = LoggerProvider(resource=resource)
provider.add_log_record_processor(BatchLogRecordProcessor(OTLPLogExporter()))
set_logger_provider(provider)

# Per-feedback emission
logger = get_logger_provider().get_logger("user-feedback")

now = time.time_ns()
logger.emit(LogRecord(
    timestamp=now,
    observed_timestamp=now,
    severity_number=SeverityNumber.INFO,
    severity_text="INFO",
    body=None,
    attributes={
        "event.name": "gen_ai.evaluation.result",
        "gen_ai.evaluation.name": "user_feedback",
        "gen_ai.evaluation.score.value": 1.0,                # required: float, 0.0–1.0
        "gen_ai.response.id": "<llm_response_id>",           # required: must match the rated LLM span's gen_ai.response.id
        "gen_ai.evaluation.score.label": "thumbs_up",        # optional
        "gen_ai.evaluation.explanation": "Helpful answer.",  # optional
    },
))
Query feedback scores
Feedback scores aren't only rendered in AI Explorer, they're also queryable as evaluation data. Coralogix ingests each feedback log into the GenAI evaluation dataset, ai.evaluations, so you can query the scores directly in DataPrime and build custom views, dashboards, or alerts on top of them.
source ai.evaluations
| filter logRecord.attributes['gen_ai.evaluation.name'] == 'user_feedback'
Investigate feedback in Explore spans
A feedback score on its own is a signal, not a diagnosis. To understand why a user left a particular score (what the agent did, which tools it called, which downstream services were involved, and what the application logged around that response) drill into the underlying LLM span in Explore spans.
If AI Explorer can't find a session replay for the AI span, the play button in the Session Replay column is greyed out, and the span details panel shows an Add Session Replay card. Follow the steps in Set up Session Replay to enable it.
- In AI Explorer, sort the User feedback column to surface the scores you want to investigate (low scores for failure modes, high scores for what's working).
- Select the span row to open the span details panel.
- Select Explore span to open the LLM span in Explore Traces.
- In the tracing drilldown, open the Related logs panel. The feedback log record appears alongside the application and infrastructure logs sharing the same
gen_ai.response.id. If the feedback log doesn't appear there, see Set up the Custom log-span correlation.
From here you see the full trace context (every span the LLM call produced, including tool calls and downstream service calls) together with the raw feedback log, which includes any extra attributes (such as gen_ai.evaluation.score.label or a free-text explanation) that don't surface in the AI Explorer column. That combination lets you see the full picture behind a single score, not just the number.
Set up the Custom log-span correlation
For feedback logs to show up in the Related logs panel of Explore spans, Coralogix needs to know how to join the log to the span. Configure a Custom log-span correlation:
- Open the log-span correlation settings.
- Select Custom correlation.
- Map the fields as shown:
- Log fields:
logRecord.attributes.gen_ai.response.id - Span fields:
tags.gen_ai.response.id - Service fields:
coralogix.metadata.subsystemName
- Log fields:
- Save the correlation.
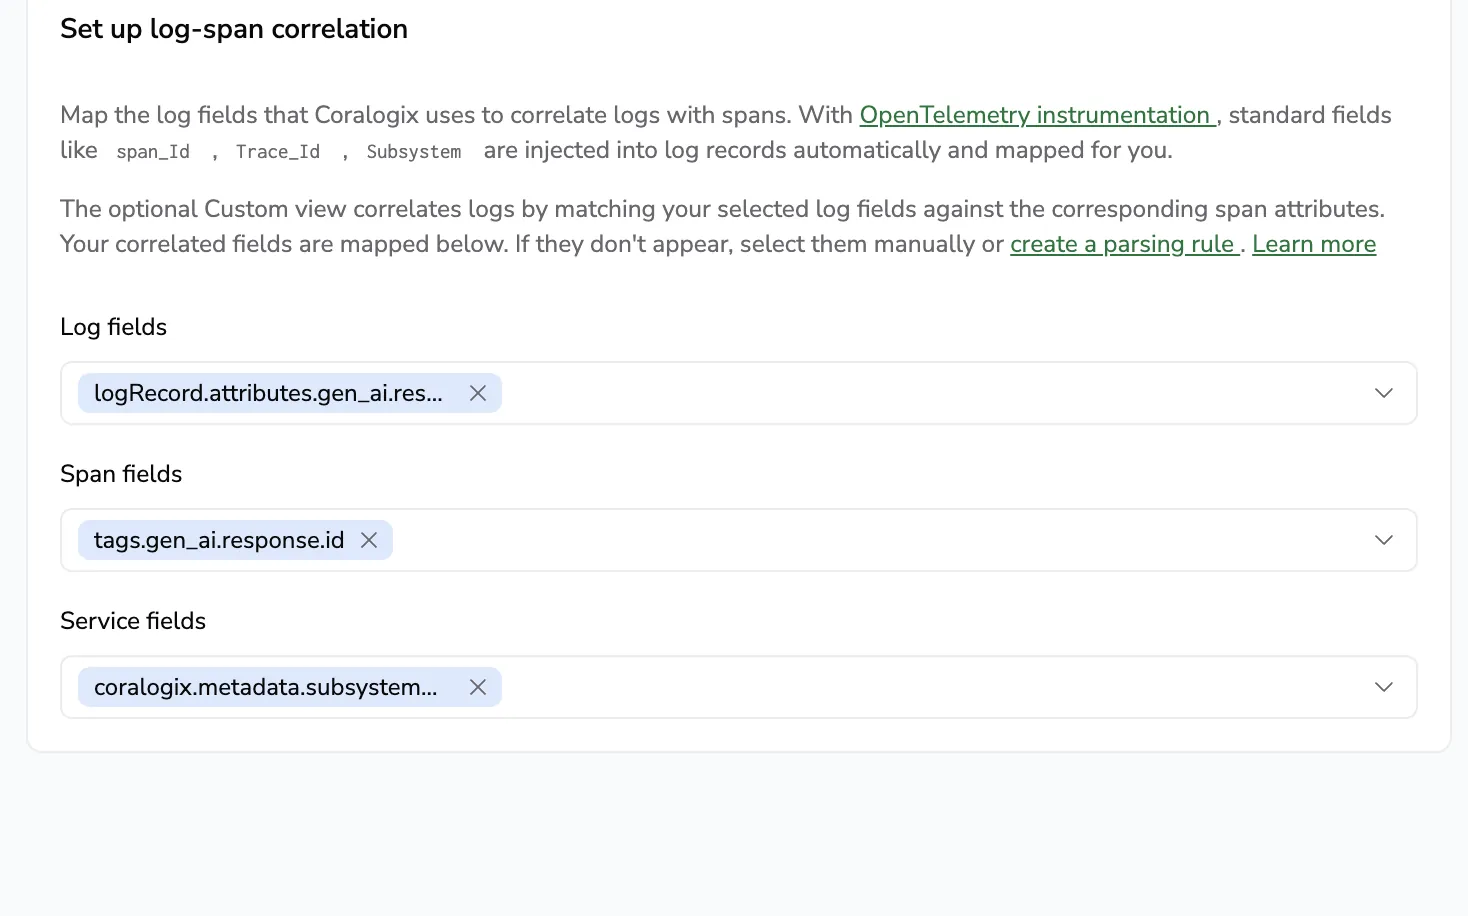
The Custom log-span correlation matches the feedback log to the LLM span on gen_ai.response.id, scoped by subsystem. Once saved, feedback logs appear under Related logs when you open the LLM span in Explore spans.
Limitations
- Only the most recent feedback record per
gen_ai.response.idis shown. If multiple feedback records exist for the same response, the latest one wins (ordered by log timestamp). - Score values are stored as-is. Values outside the
[0, 1]range render as grey badges with the literal value, but aren't rejected. - Feedback that arrives before its matching LLM span is ingested into Coralogix won't display until the span exists.
- Only
gen_ai.evaluation.score.valueis read from the feedback log. Other attributes you attach (such asgen_ai.evaluation.score.labelor an explanation) remain in the raw log but aren't displayed in the AI Explorer column. Open the log in Explore spans to view them.
Explore the full trace for end-to-end context
Each AI span belongs to a trace. Use trace exploration when you need full end-to-end context across services, tools, and downstream components.
To explore the full trace:
- In the span details panel, select Explore span to open the related trace.
- Switch between visualizations, such as Gantt and flame graph views, to understand timing, dependencies, and bottlenecks.
- In the tracing drilldown, review LLM attributes such as prompts and responses as span tags.
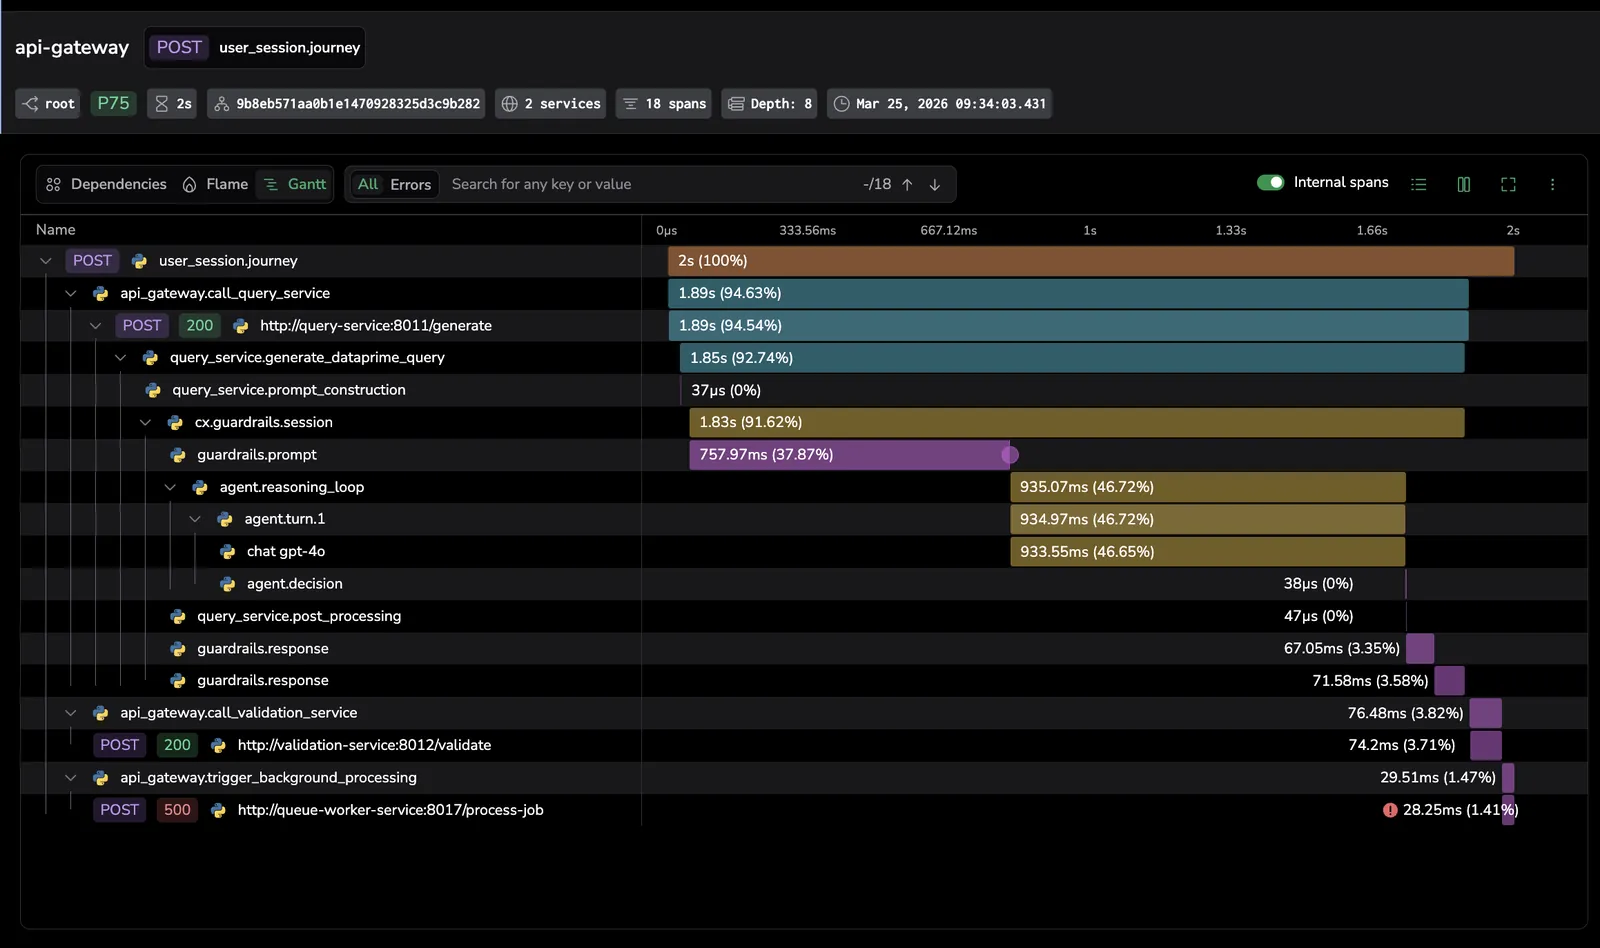
Opening a span in Explore spans reveals the full end-to-end trace, including guardrails spans such as cx.guardrails.session, guardrails.prompt, and guardrails.response, letting you see exactly where guardrail checks ran relative to the LLM call and other downstream services.
To investigate further using traces and spans:
- Use traces to identify abnormal requests. In the trace view, compare executions by time range, service, action, or flow to spot errors and latency outliers.
- Use spans to find the operation that explains the behavior. In the span view, compare operations across traces using RED signals and span attributes to determine whether the issue is isolated or widespread.
- Open the drilldown view to inspect details. Review timing, structure, dependencies, and related context in more detail. In the Info Panel, review LLM attributes such as prompts and responses as span tags.
Next steps
Protect your AI applications from harmful outputs in real time with Guardrails.