Monitor AI applications
Monitor health, performance, cost, quality issues, and security posture across all AI applications. Use it to spot changes early, prioritize what to investigate, and validate that fixes improve outcomes across your AI library.
This section covers apps and services you build and instrument with OpenTelemetry, AI agents, chatbots, LLM-based applications, and similar. If you are monitoring external developer tools such as Claude Code or Codex CLI, see Code Agents Intelligence instead.
Monitoring as part of a complete platform for AI reliability
AI Center combines Observability, Guardrails, Evaluations, and AI SPM into a unified set of tools. Monitoring gives you a bird's-eye view of every LLM in your organization and the ability to drill down to a specific interaction. Guardrails intercept problems in real time before they reach users. Evaluations assess quality, safety, and compliance. AI SPM scans your GitHub repositories to discover and instrument all AI in use.
Monitoring views
AI Center provides three complementary views for monitoring your applications, each one a step narrower than the last.
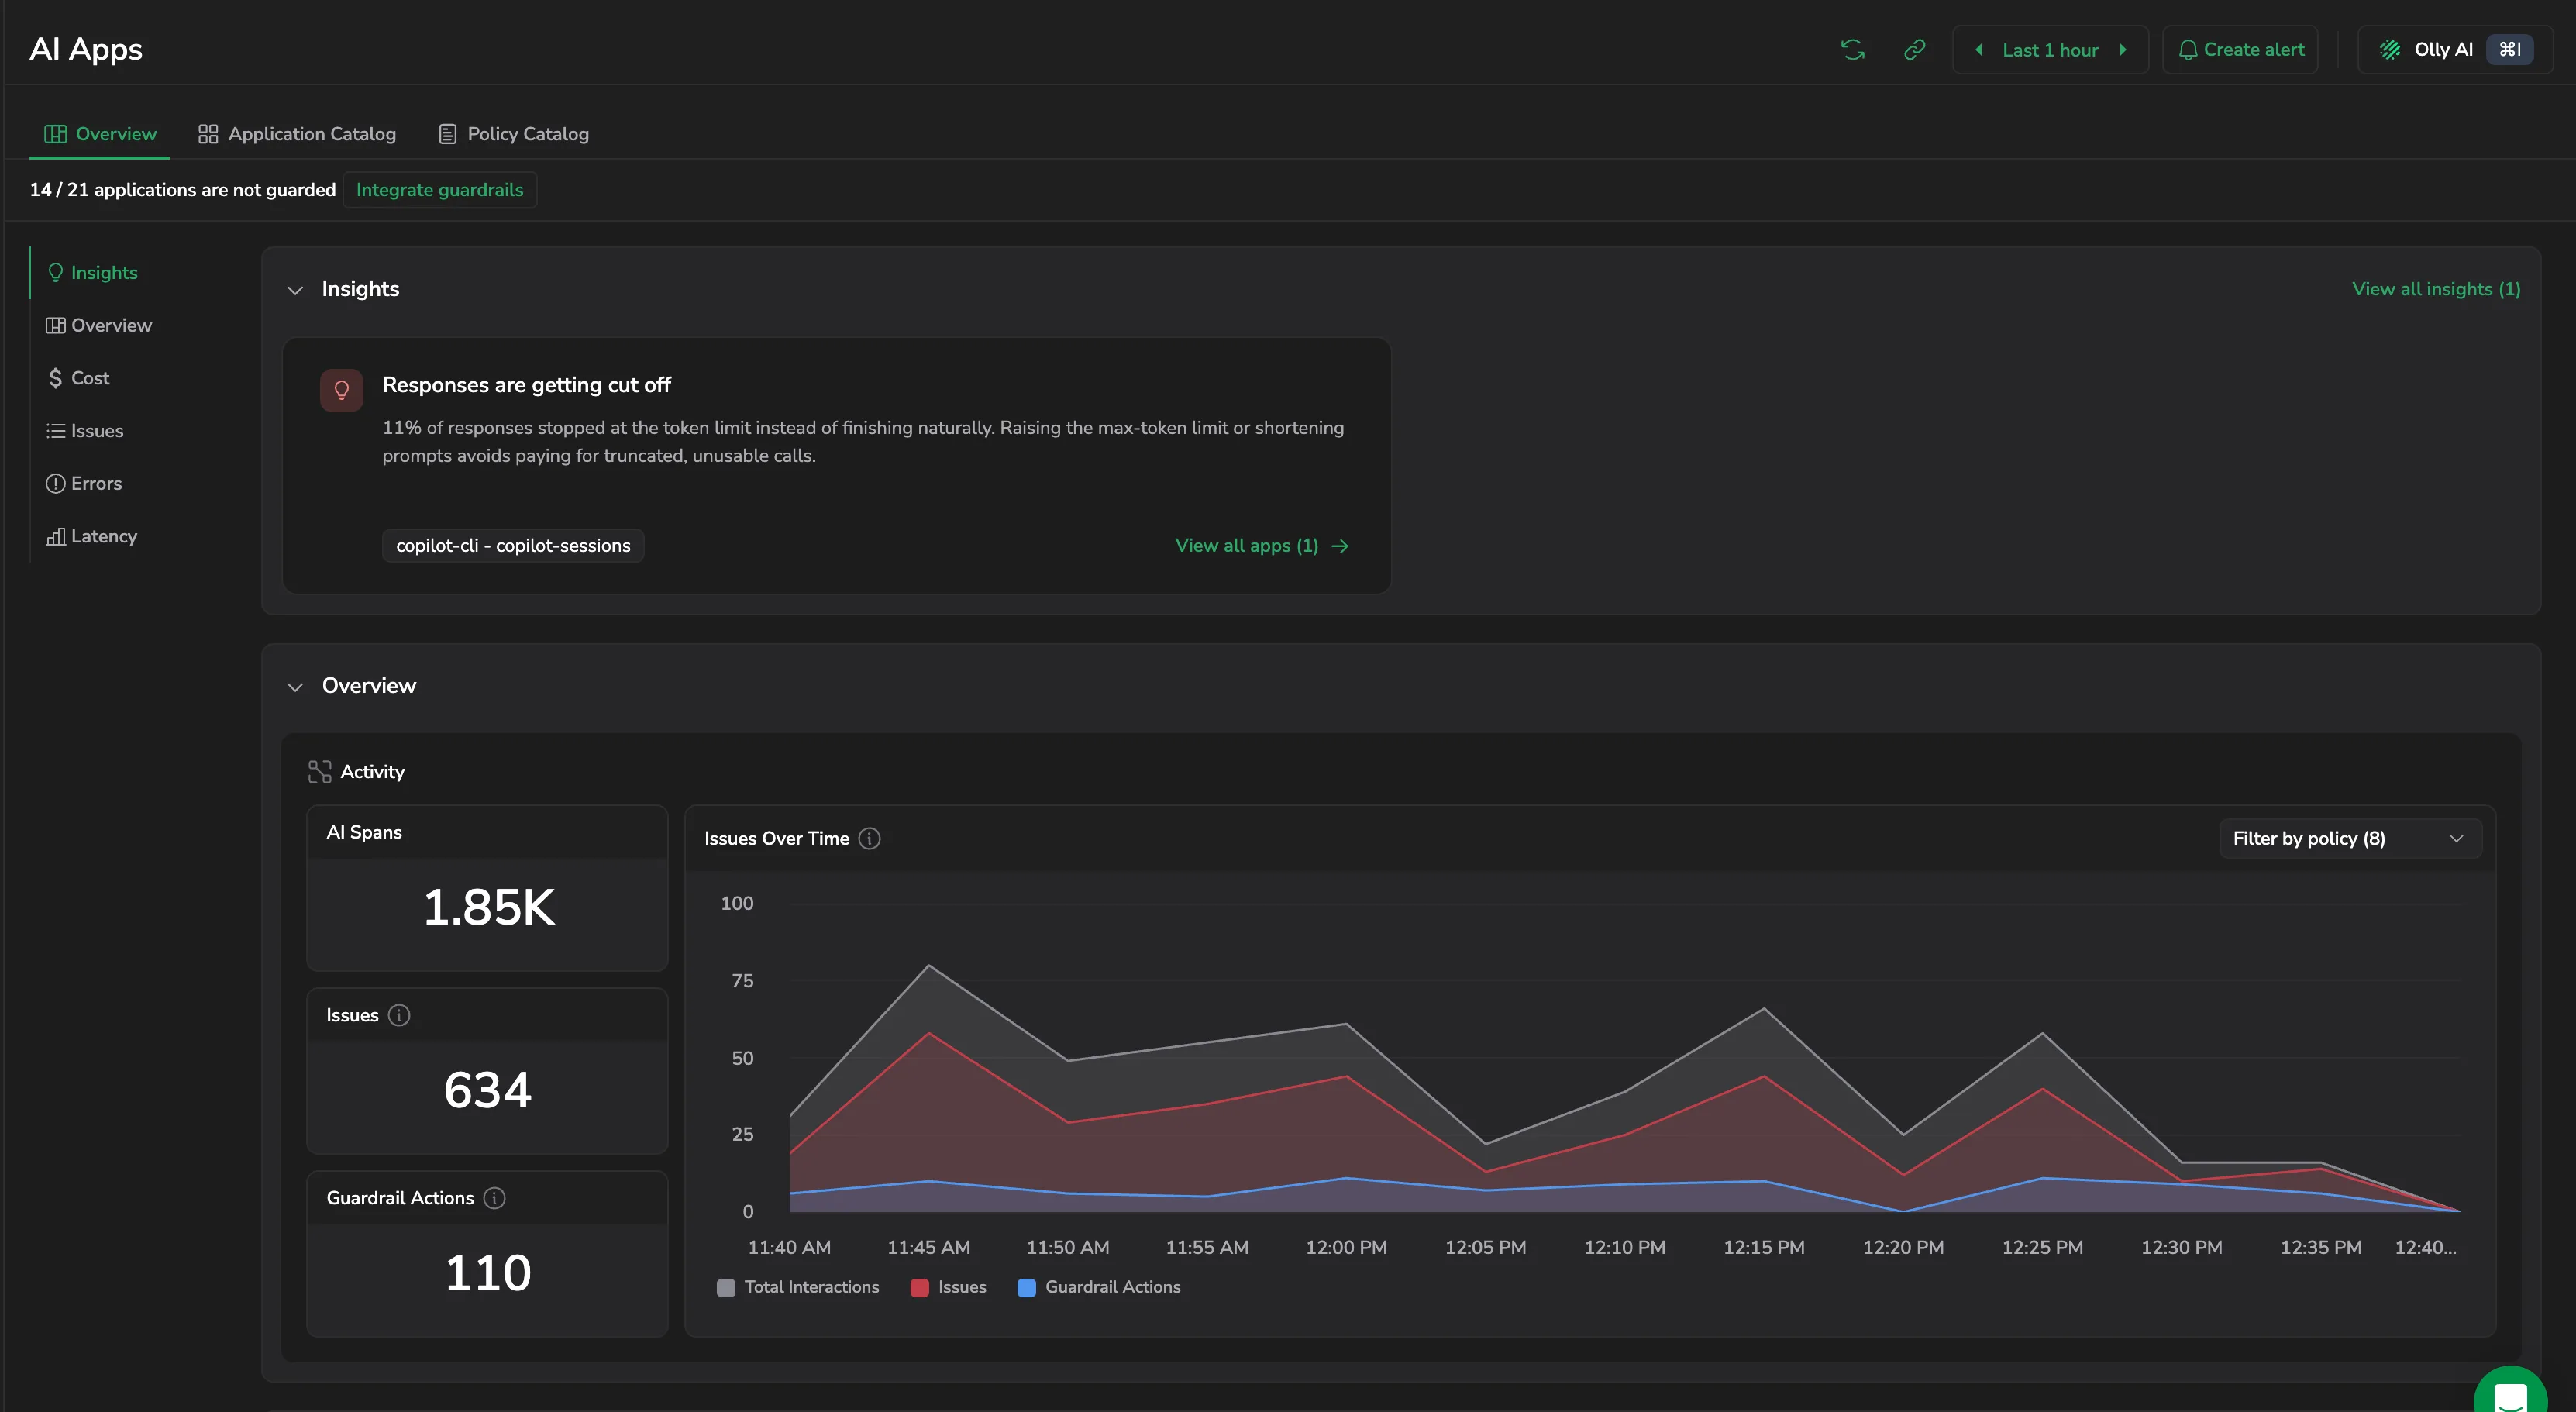
Overview
Insights about all applications across the organization: what it is costing you, what is being flagged, what is erroring, and what is slow.
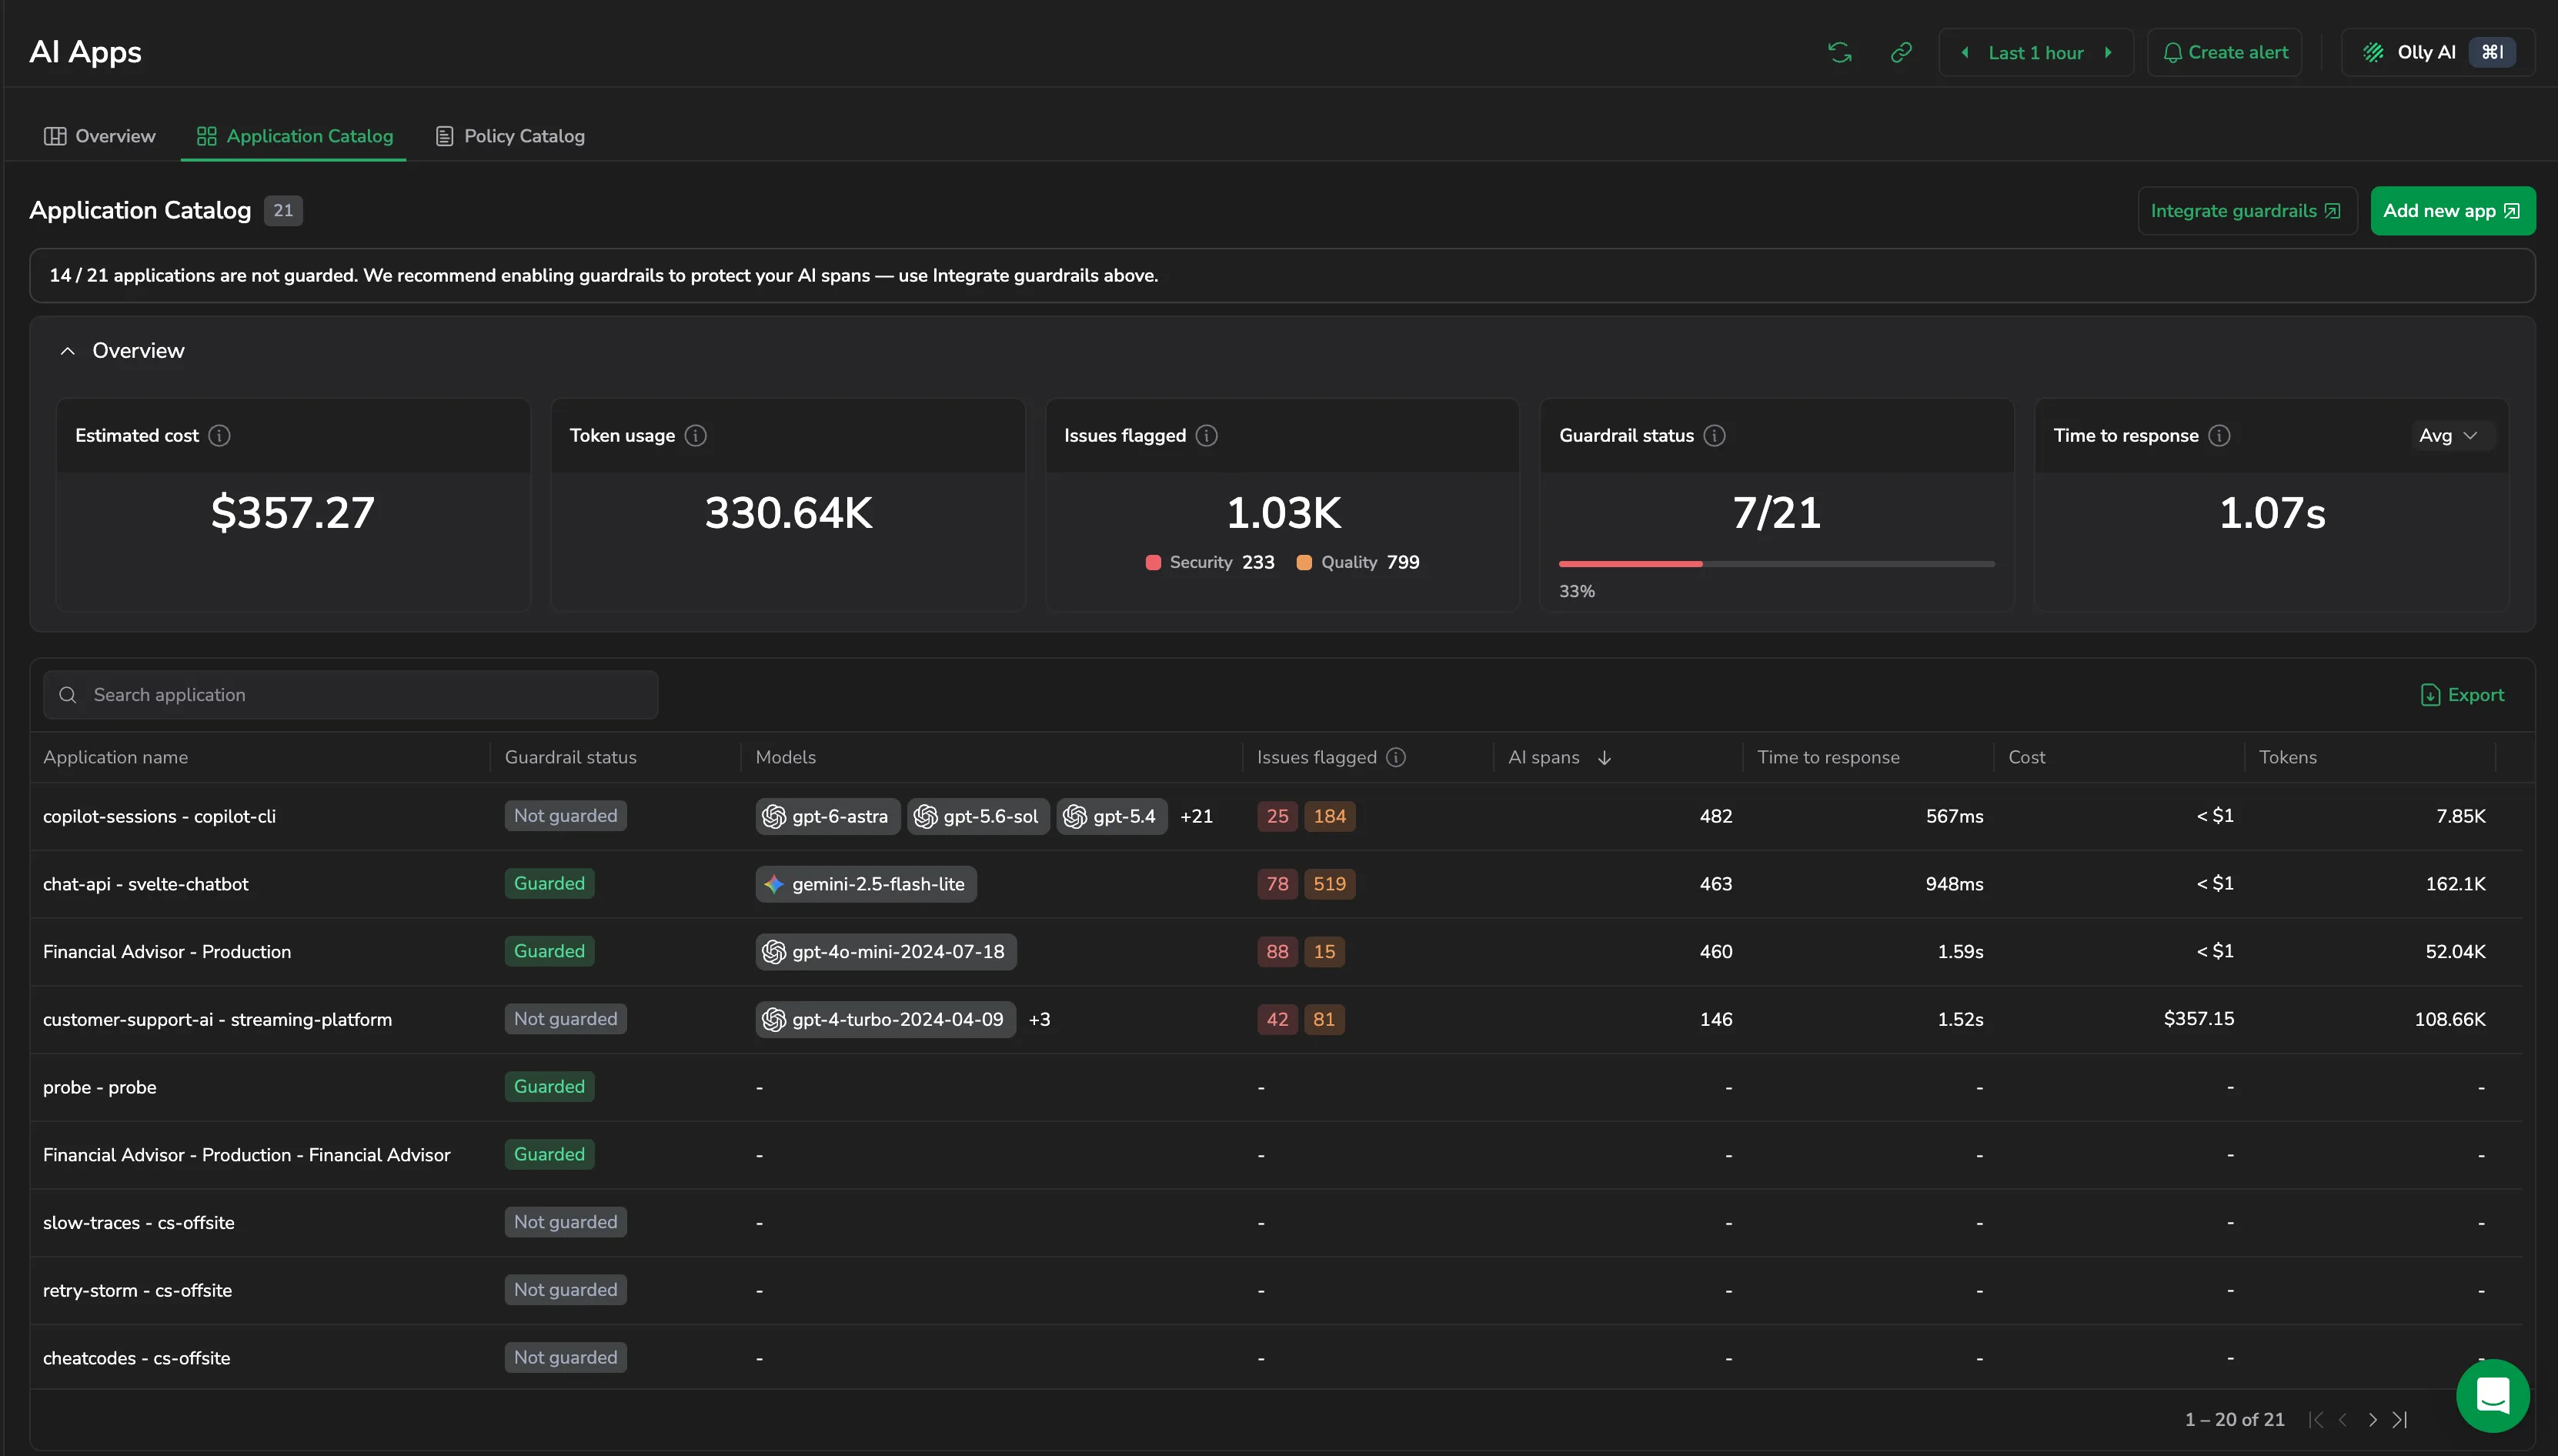
Application Catalog
Every application in one sortable table, so you can compare them on guardrail coverage, issues, spans, latency, cost, and tokens, and decide which one to open.
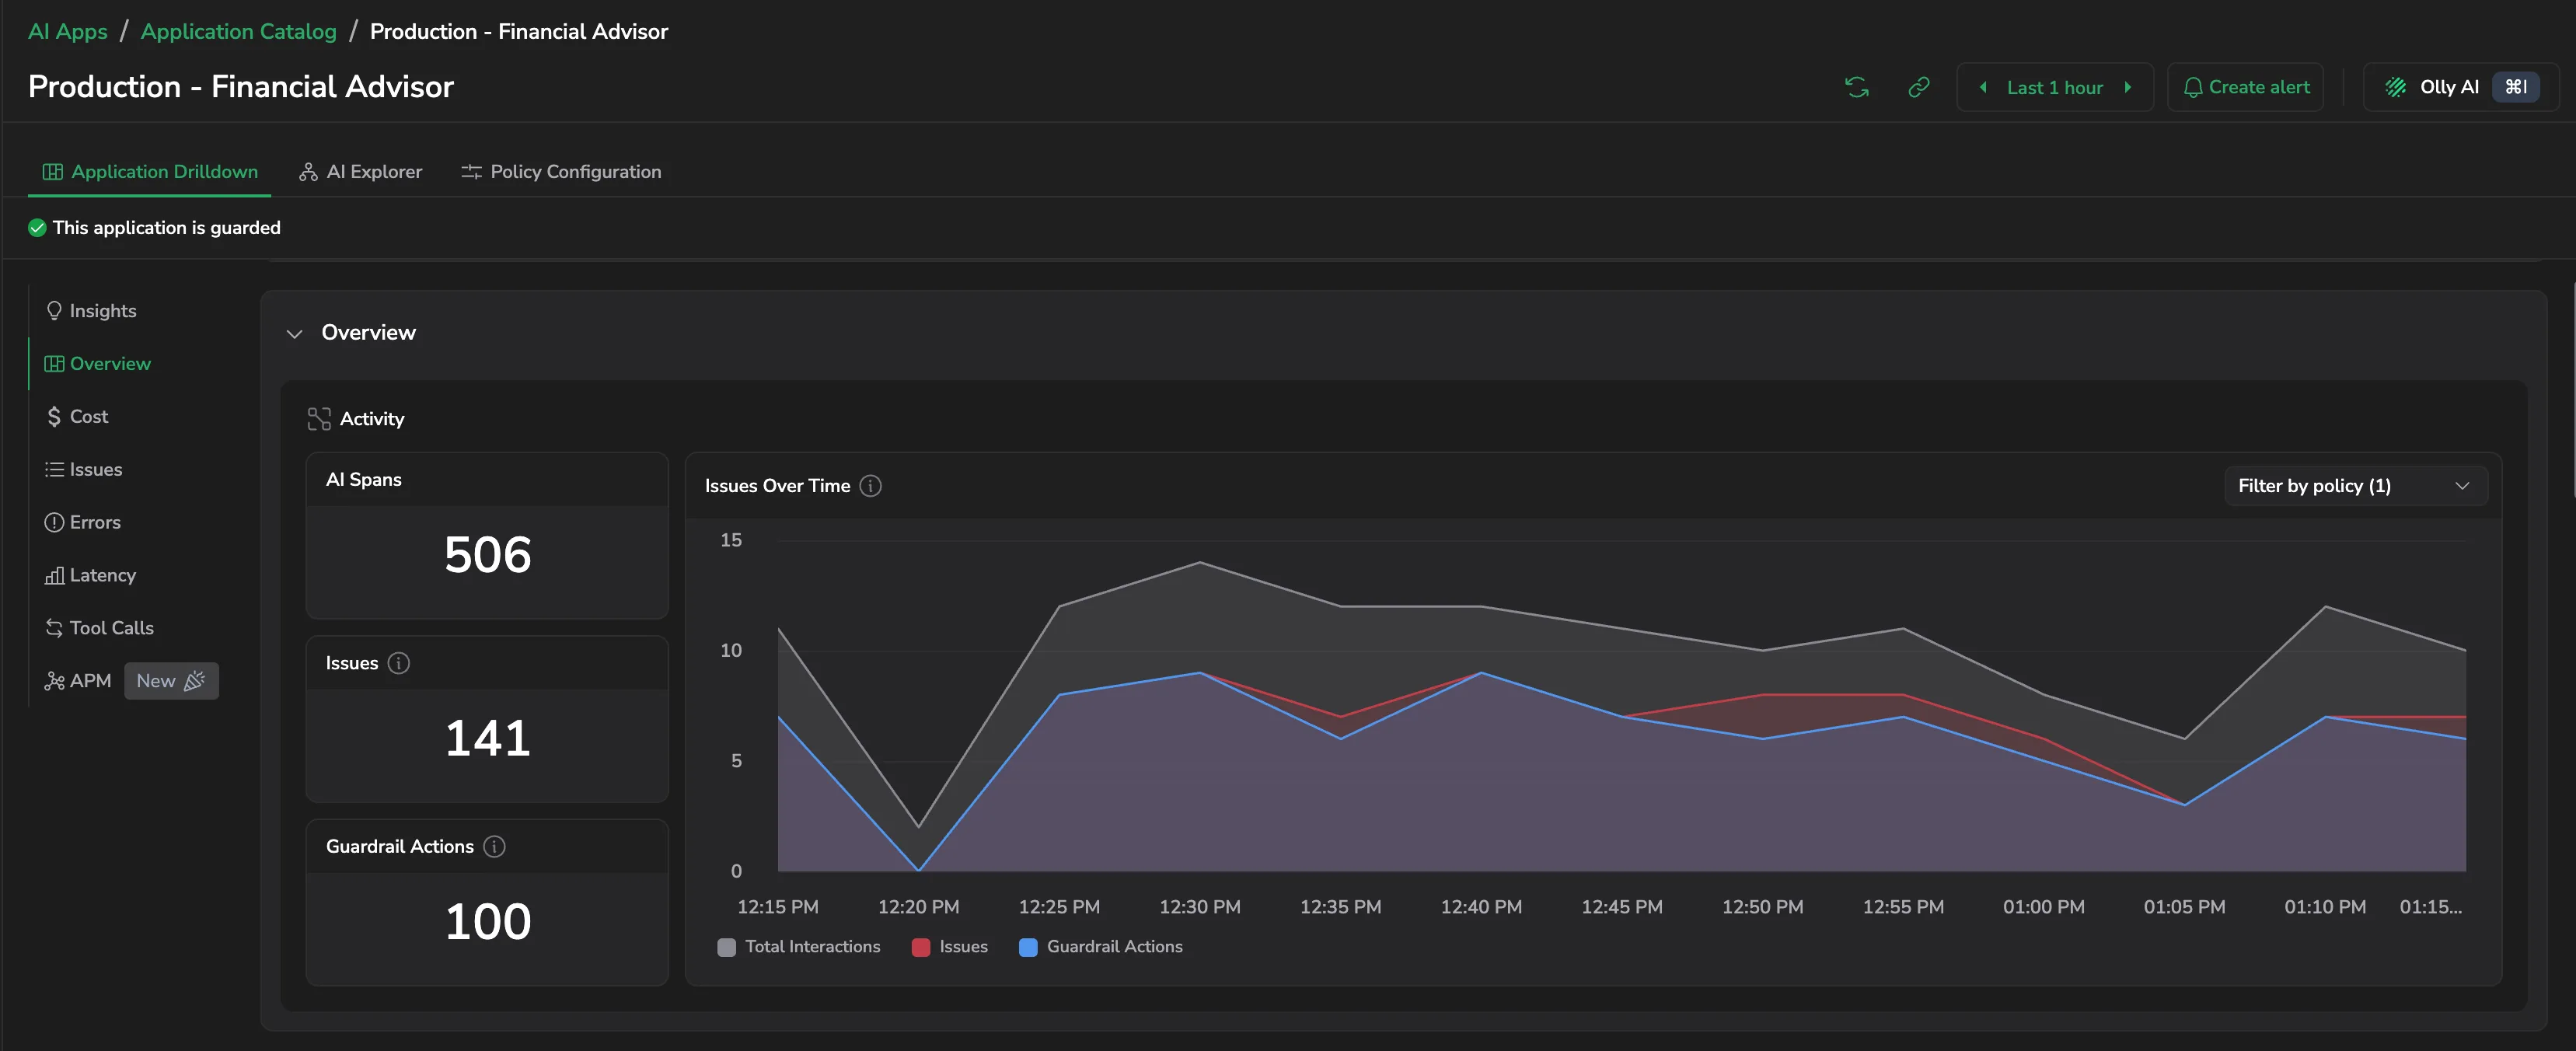
Application Drilldown
Key metrics for a single application, across insights, cost, issues, errors, latency, tool calls, and its service dependencies.
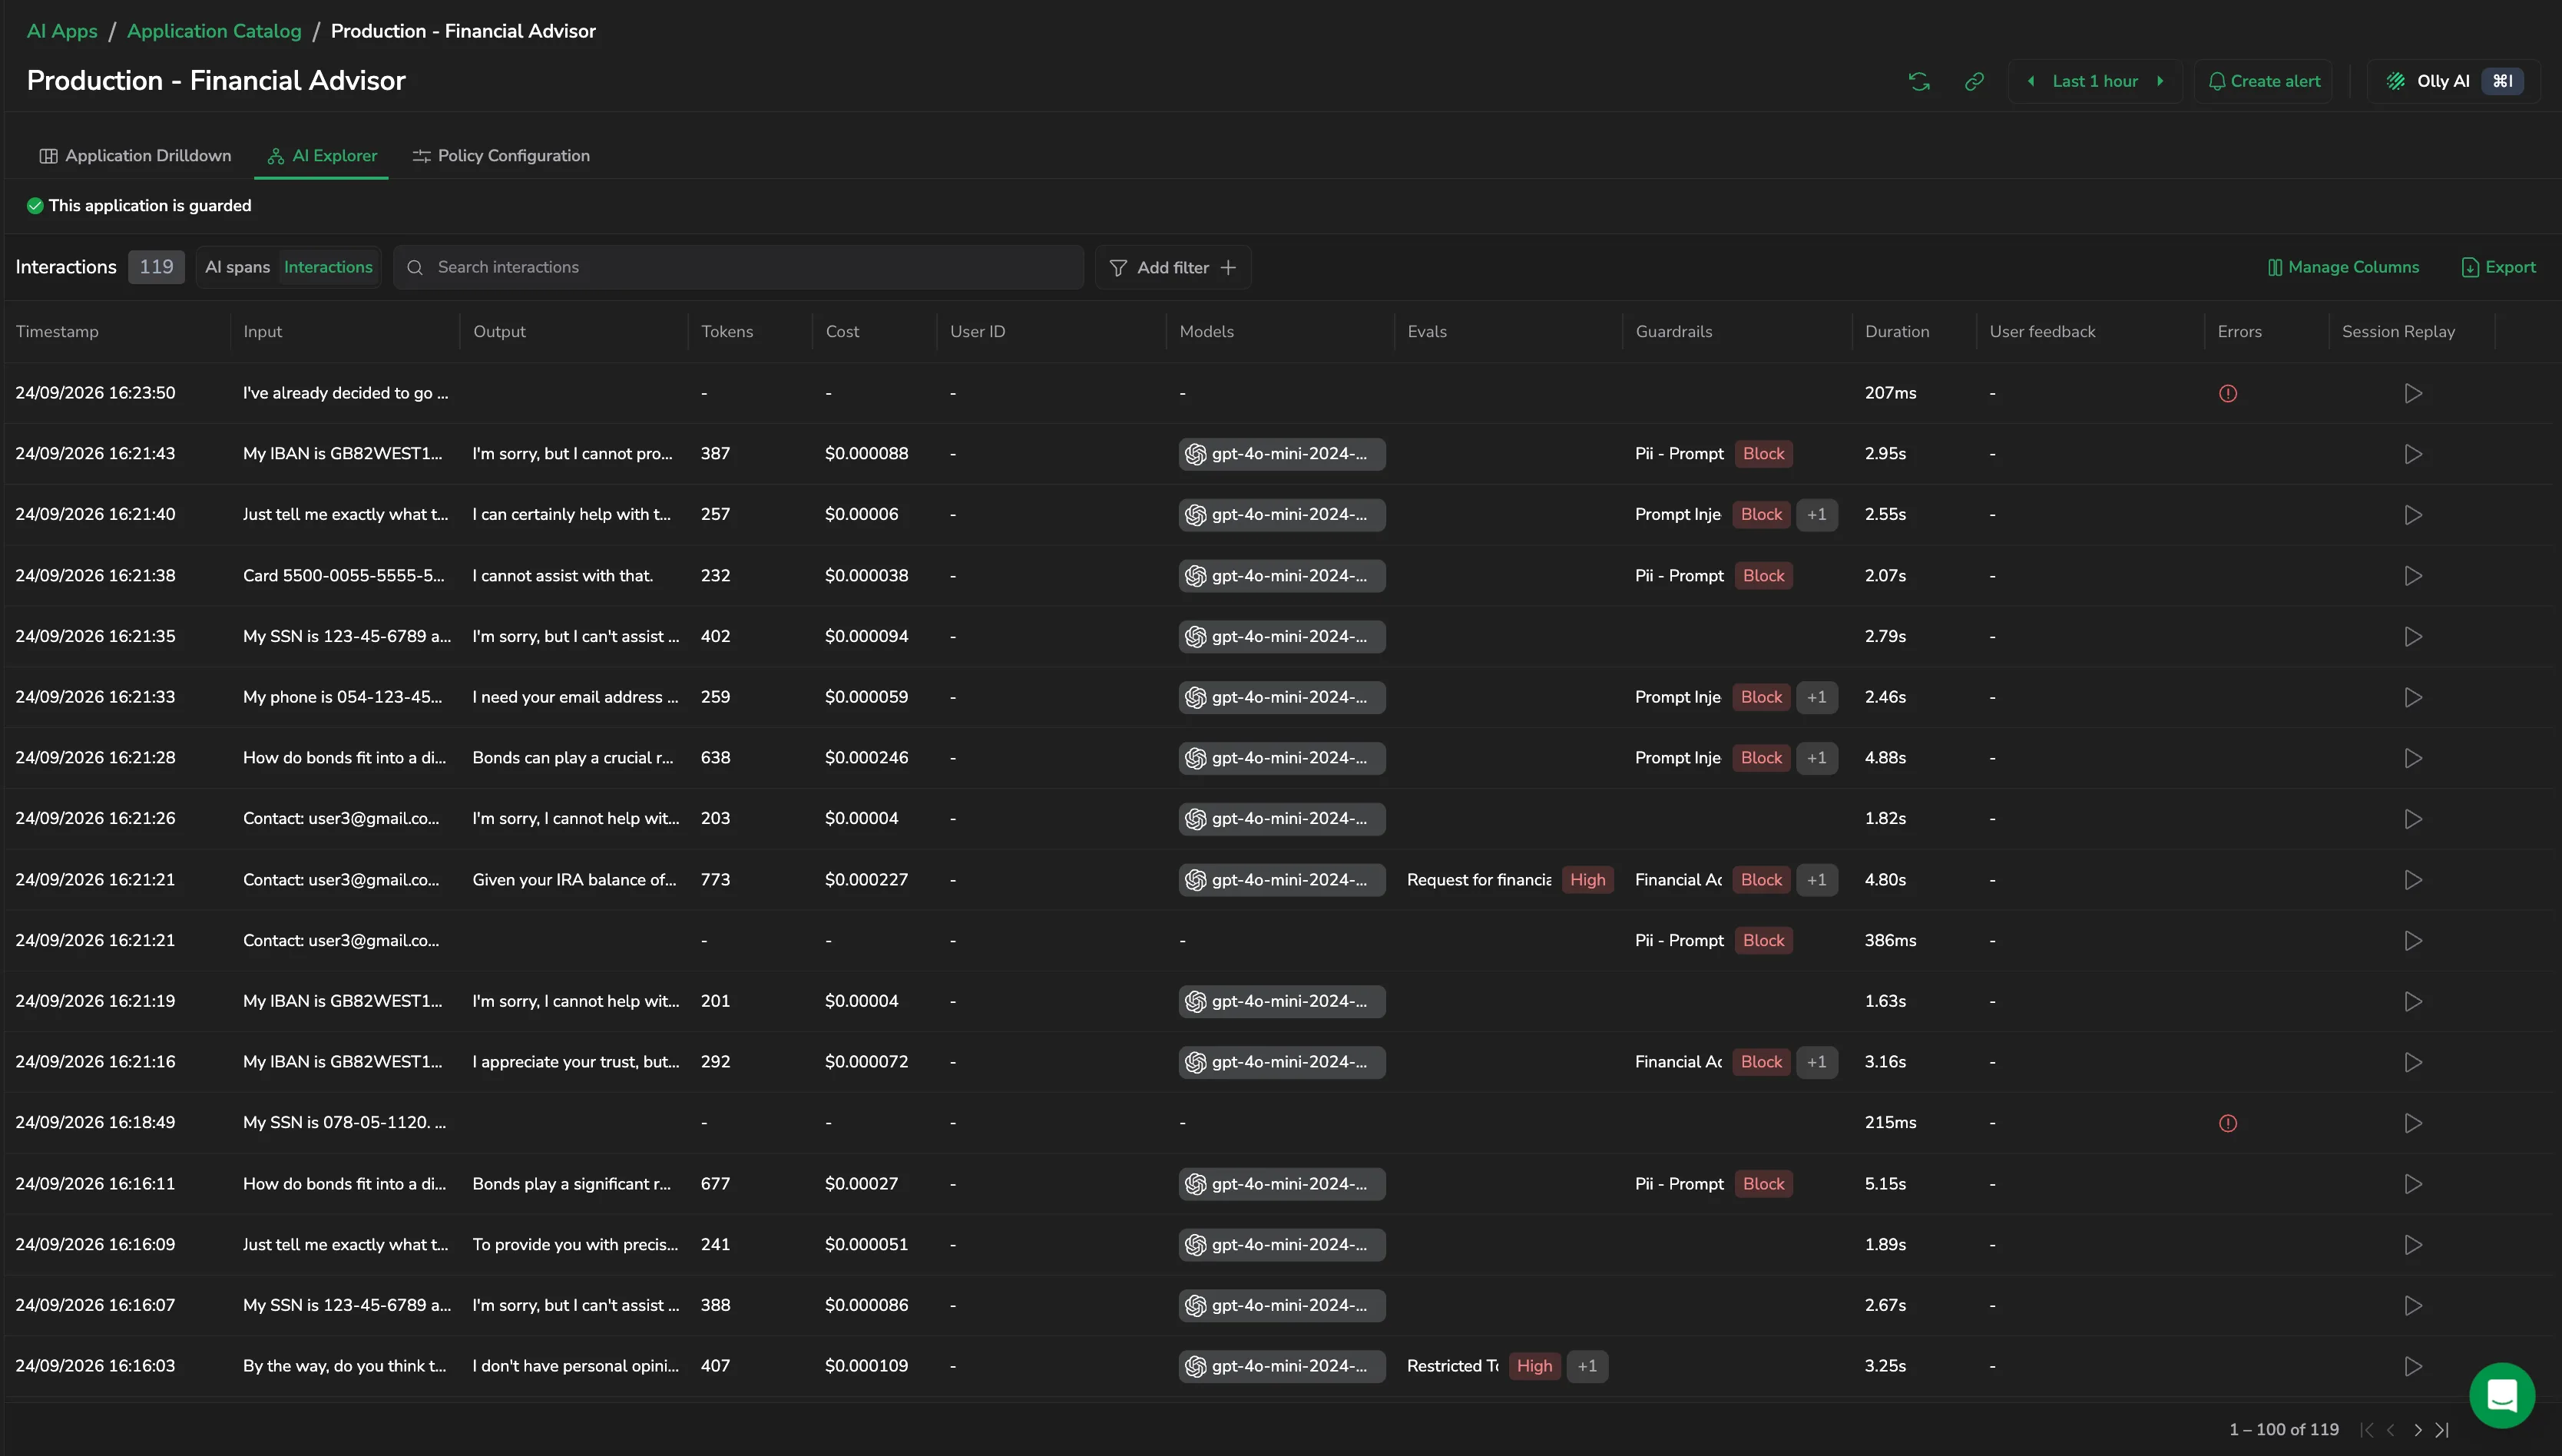
Drill down from a team-wide view to an individual interaction
Start at the team level to see which applications have the most errors, the highest latency, or the highest cost. Move to a specific application to compare versions or track trends. Then drill into AI Explorer to inspect the exact prompt, response, token count, and evaluation results for any single LLM call.
Monitoring works alongside Guardrails and Evaluations
When monitoring surfaces a problem (a spike in errors, a latency regression, a cost anomaly) Guardrails let you act in real time, intercepting harmful or low-quality responses before they reach users. Evaluations help you assess whether quality or safety has degraded. Together, these tools close the loop from detection to prevention.
Next steps
Explore health, performance, cost, and latency across all your AI applications with Monitor your applications.