Alert aggregation
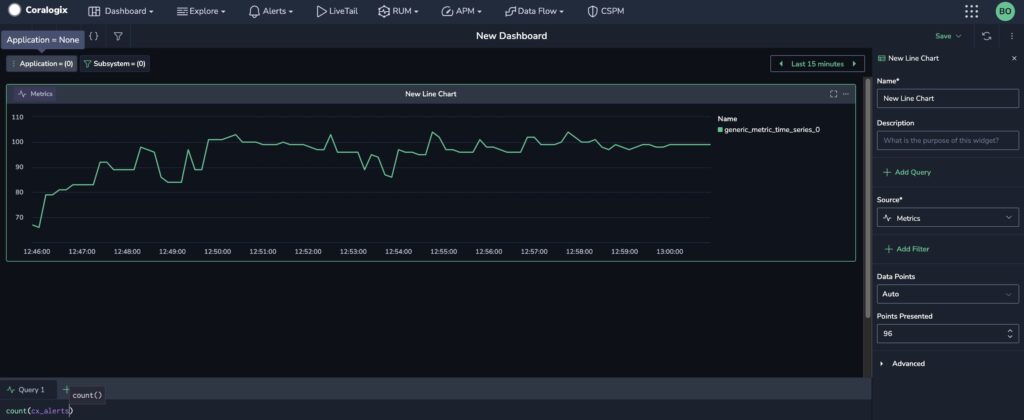
You can aggregate your alerts and then display them as a widget on a custom dashboard using a gauge-type metric (cx_alerts). When alert-to-metric is enabled, all alerts start to be accumulated into bucket. The number of triggered/resolved alerts is calculated per minute, creating a time series per every permutation.
Enable alert aggregation
Alert aggregation is enabled per team. Keep in mind that alert metric is counted against your account's quota.
Go to Settings, then Preferences and scroll down to the Alerts section.
Add a metric widget
Add a widget to your custom dashboard to visualize alert aggregation.
Create a new custom dashboard or open an existing one.
Add a new widget to your dashboard.
On the right-hand sidebar, use the Source drop-down box to select Metrics as your data source.
Specify the cx_alerts metric or desired PromQL in the Query field. Use the following labels in conjunction with the metric:
alert_def_idalert_def_namealert_statuscx_source(always contains thealertsstring as its value)is_phantomalert_def_typealert_priorityalert_def_label_*(key value spread)alert_def_group_by_*(key value spread)
Related resources
Next steps
Reduce false alerts caused by data pipeline delays with Custom evaluation delay.

