Alerts map
Alerts Map presents you with a visual representation of each alert status in real-time. Grouping all of your alerts in a scalable, information-dense manner, this feature ensures optimal system monitoring.
What you need
To view the Alerts Map, you need ALERTS:MAPREAD (included in all standard roles, including Read-Only User).
Use Alerts Map to visualize the following:
-
Standard Alerts (for all alert conditions except
notify immediately)
Access alerts map
To access Alerts Map, navigate to Alerts, then Alerts Map.
Alerts map visualization
View triggered alerts
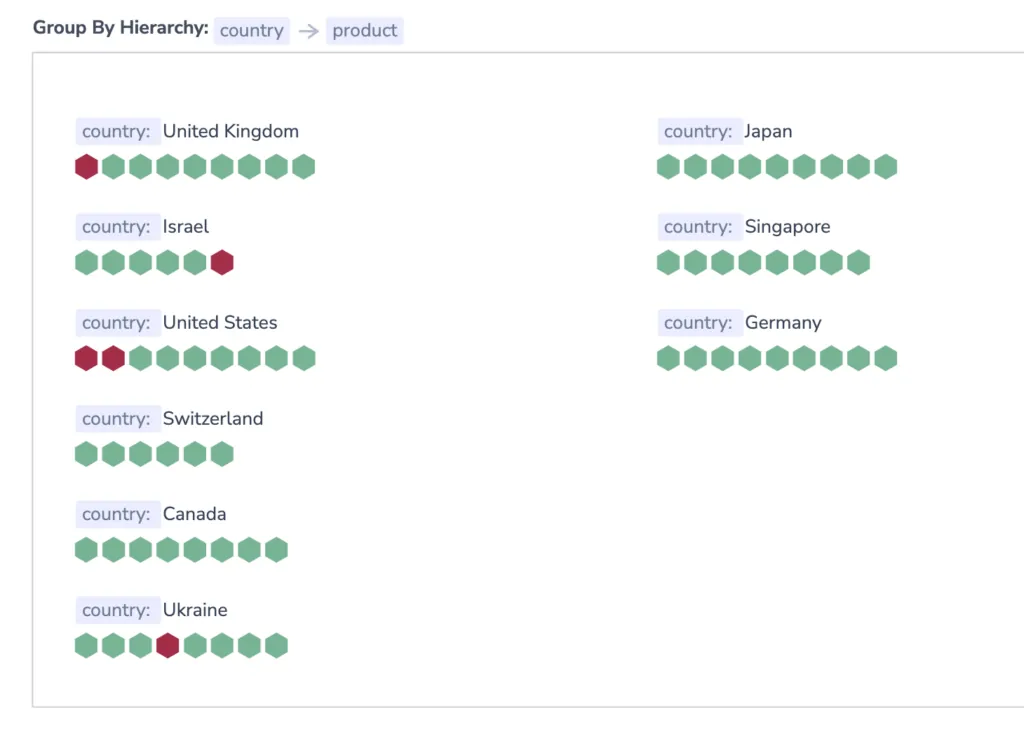
Alerts Map is divided into different visualizations based on the field or fields you have grouped by in your alerts. Red hexagons represent values per key that have resulted in a triggered alert. Green hexagons represent all other conditions.
-
Hexagon color is updated at intervals defined by
value:time-rangein the alert definition itself:-
Every 2 min: When the less than\more than condition is under 30min
-
Every 6 min: When the less than\more than condition is between 30min to 12hrs
-
Every 12 min: When the less than\more than condition is bigger than 12hr
-
-
To view additional information about a triggered alert, hover over a hexagon of interest. You will see a list of all the alerts that were triggered for a specific value and how many of them have been resolved.

Filter
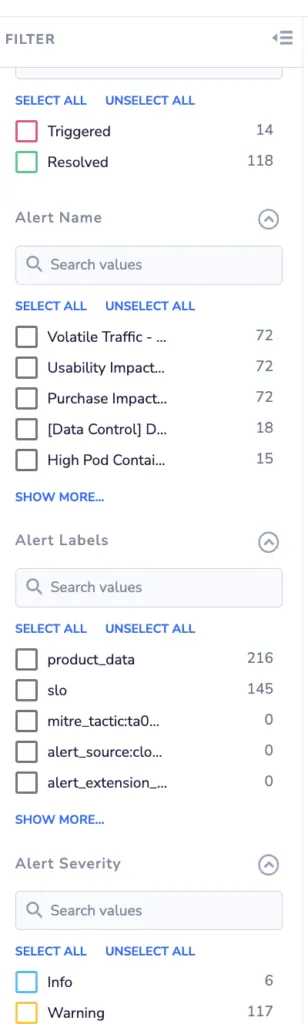
Filter Alerts Map in the left-hand sidebar. Filter by Alert status, Alert name, and Alert severity.
Related resources
Next steps
View and manage all triggered alert events in Incidents.