Ratio alerts
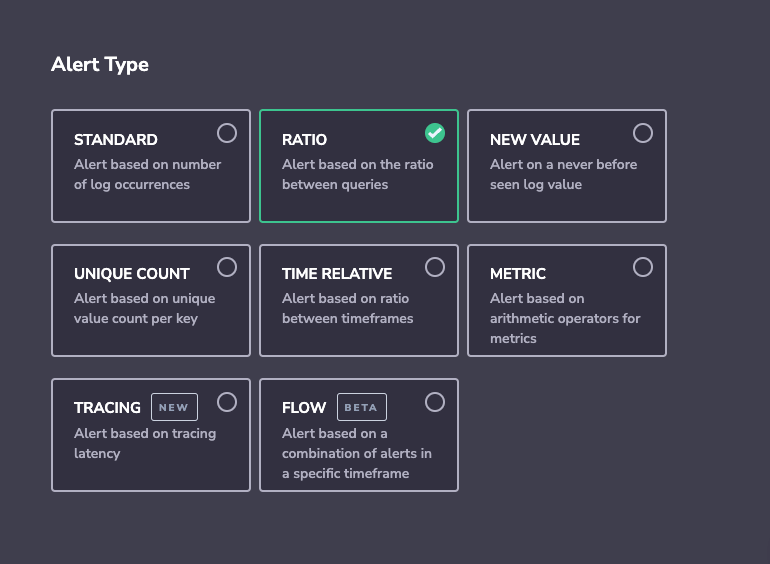
Ratio alerts allow you to easily calculate a ratio between two log queries and trigger an alert when the ratio reaches a set threshold.
Feature
Use this feature to monitor:
Operational Health. Monitor the number of outgoing responses to incoming requests or the ratio of specific error codes to the overall number of errors.
Marketing. Monitor the ratio between traffic from specific regions to overall traffic following regional campaigns.
Security. Monitor the ratio of denied requests, specific admin operations, or requests originating from blocked network domains compared to all requests.
Create a ratio alert
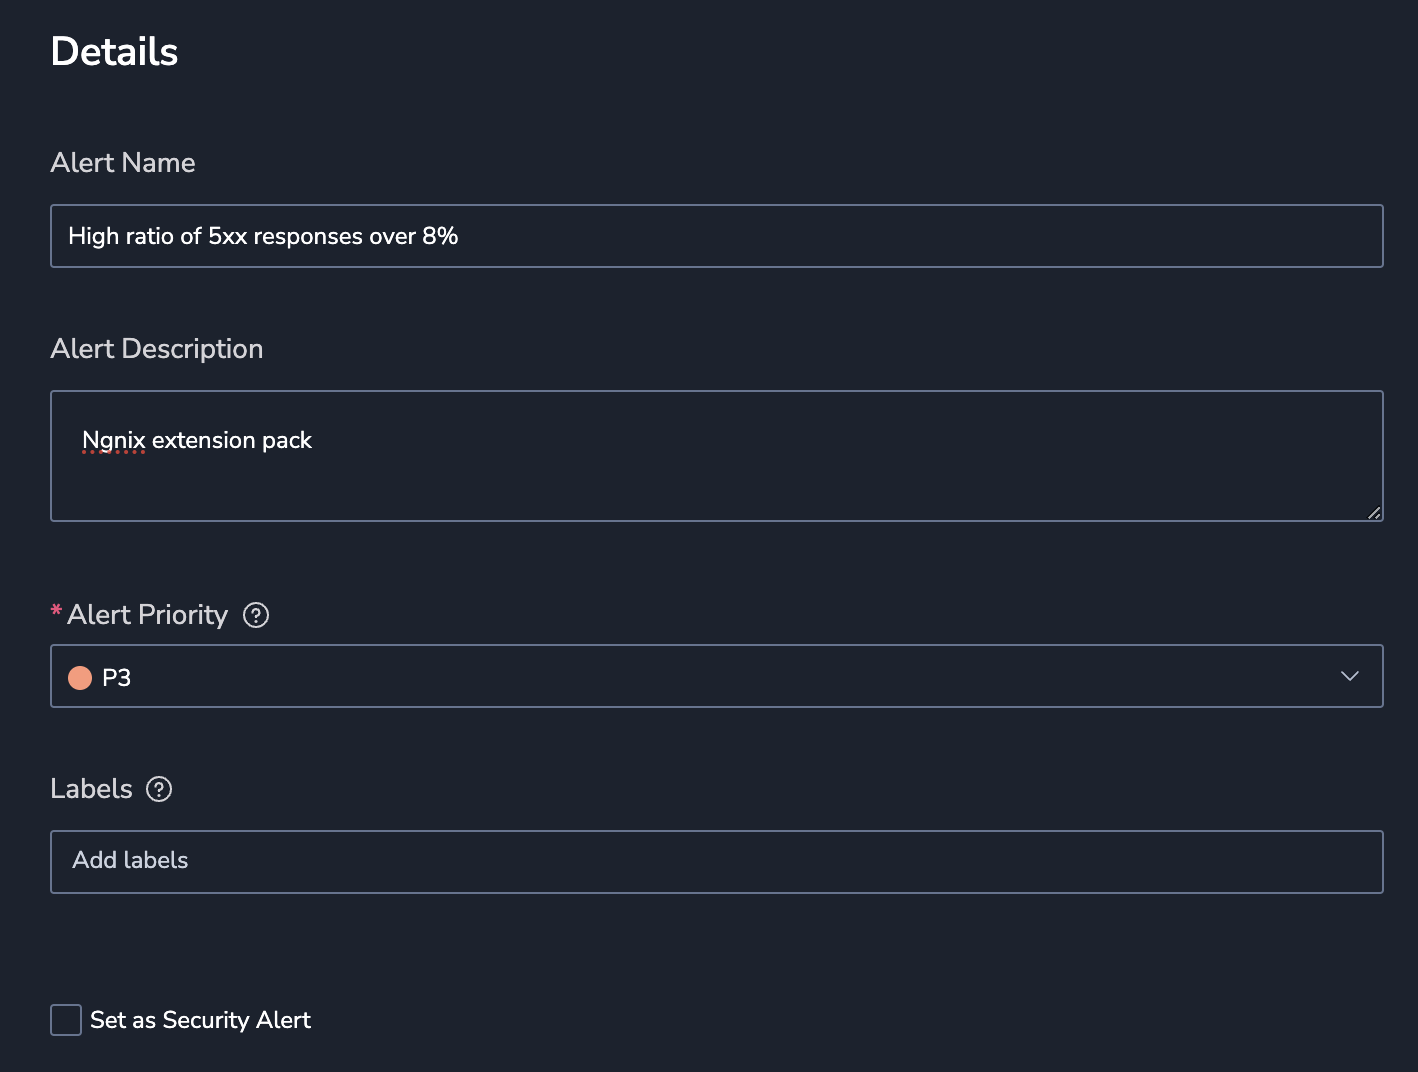
Details
Set alert details: Name, Description, Priority (P1, highest to P5, lowest), Labels (A new label or an existing one. Nest a label using key:value.). You can also select the Set as Security Alert checkbox to add the alert_type:security label. This will help Security customers filter for this alert type in the Incidents screen.
Define queries
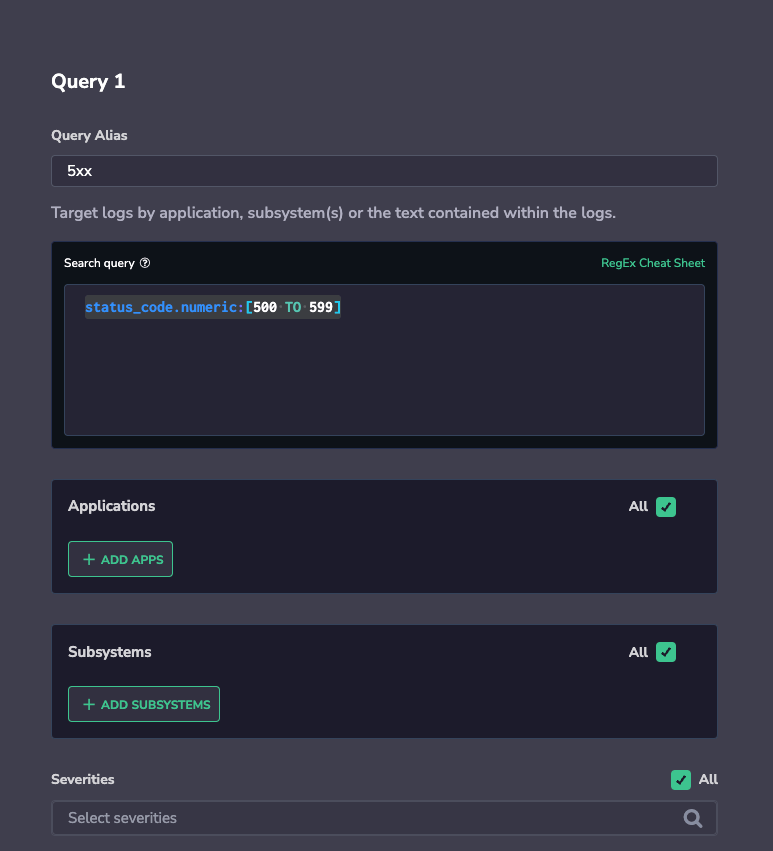
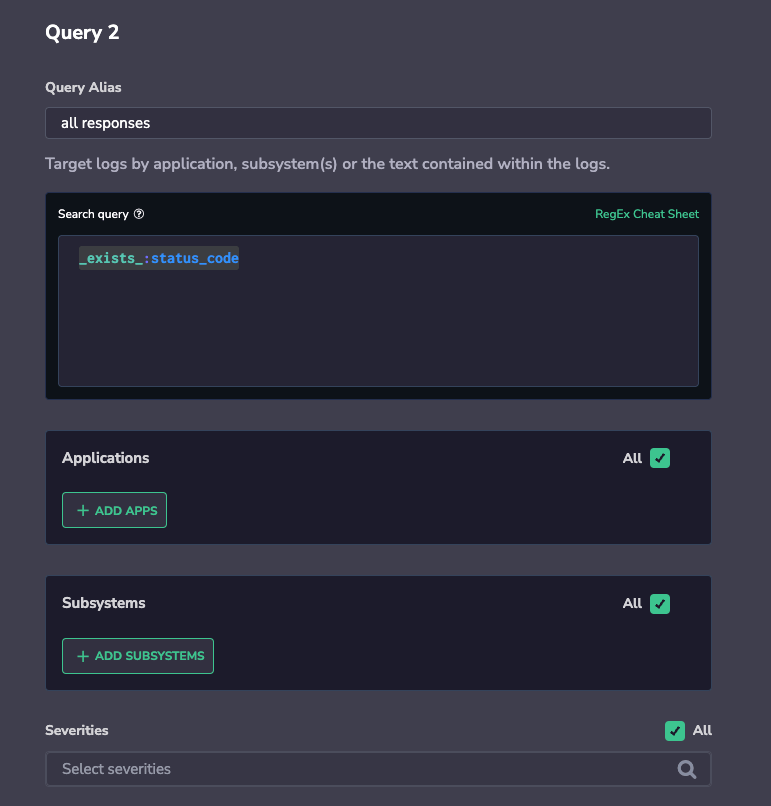
Define Query 1 & Query 2.
- Create a meaningful name (Alias) for your query, as it will appear in your alert notifications
- Input a new query. Using the available RegEx cheat sheet for support.
- Filter by Application, Subsystem and Severity.
Additional query examples
- Example 1
- Query1:
status:504 - Query2:
_exists_:status - Result: Finds the ratio between error code 504 and the overall number of response codes received. Higher-than-usual ratios may indicate operational issues.
- Query1:
- Example 2
- Query1:
NOT client_addr:/172\\.[0-9]{1,3}\\.[0-9]{1,3}\\.[0-9]{1,3}/ - Query2:
_exists_:client_addr - Result: Assume addresses outside 172.xxx.xxx.xxx are restricted. An abnormal ratio of restricted traffic to all traffic may indicate an attack.
- Query1:
- Example 3
- Query1: request_status:success
- Query2: response_status:rejectrequest
- Result: Calculates how many requests were not answered successfully out of all successful requests. A higher-than-usual ratio may indicate operational issues.
Conditions
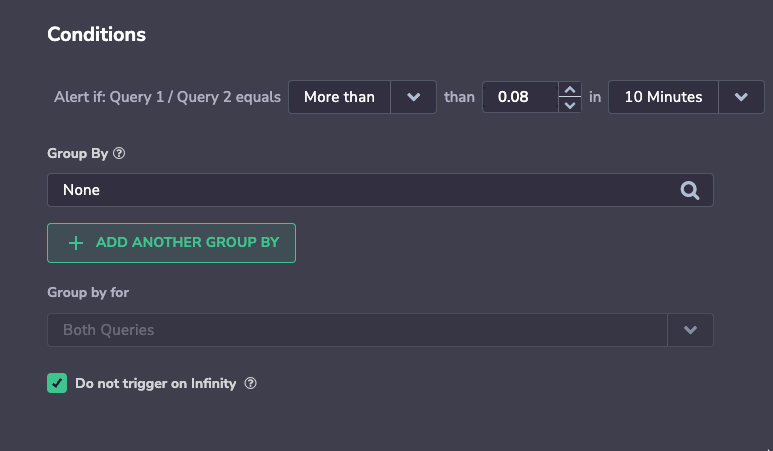
Set the conditions to trigger the alert.
An alert will trigger when the count of the entries matching the alert definition will be more / less than the chosen threshold (the ratio chosen in the Query1/Query2 drop-down list). Hit count will present the actual number of entries that match within the selected time window.
Group by
- Group By alerts by aggregating one or more values into a histogram. An alert is triggered whenever the condition threshold is met for a specific aggregated value within the specified timeframe.
- If using 2 values for Group By, matching logs will first be aggregated by the parent field (for example,
region), then by the child field (for example,pod_name). An alert will fire when the threshold meets the unique combination of both parent and child. Only logs that include the Group By fields will be included in the count.
Trigger on infinity
Choose whether you would like to be alerted on Infinity. The infinity value is met when the value of the second query is 0. In that case, the ratio result will be infinite.
Notifications
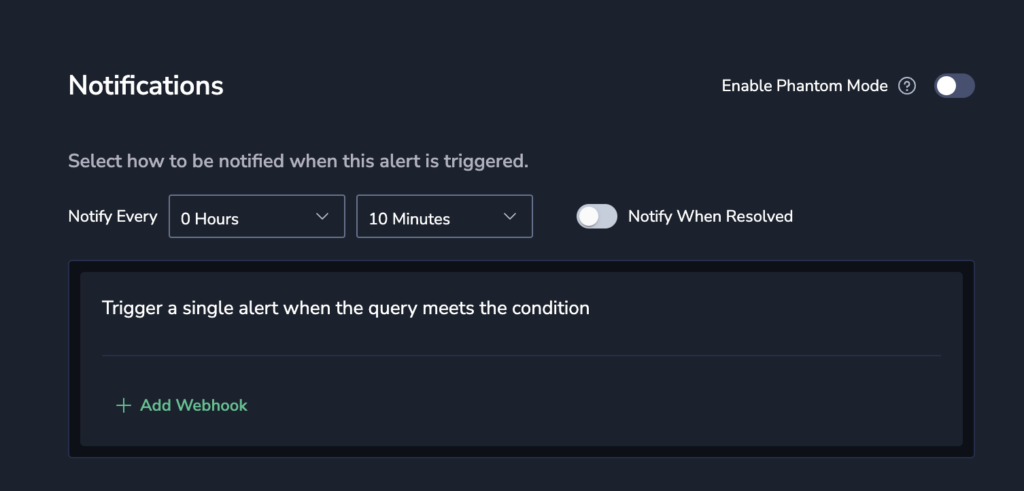
Define notification settings.
In the notification settings, you have different options, depending on whether or not you are using the Group By condition.
Using group by
When using Group By conditions, you will see the following options:
- Trigger a single alert when at least one combination of the group by values meets the condition. A single notification, aggregating all values matching an alert query and conditions, will be sent to your Coralogix Incidents screen.
- Trigger a separate alert for each combination that meets the condition. Multiple individual notifications for each Group By field value may be sent to your Coralogix Incidents screen when query conditions are met. Select one or more Keys – consisting of a subset of the fields selected in the alert conditions – in the drop-down menu. A separate notification will be sent for each Key selected.
- The number of Group By permutations is limited to 1000. If there are more permutations, then only the first 1000 are tracked.
Not using group by
When not using the Group By condition, a single alert will be triggered and sent to your Incidents Screen when the query meets the condition.
You can define additional alert recipient(s) and notification channels in both cases by clicking + ADD WEBHOOK. Once you add a webhook, you can choose the parameters of your notification:
- Notify Every. Sets the alert cadence. After an alert is triggered and a notification is sent, the alert will continue to work, but notifications will be suppressed for the duration of the suppression period.
- Notify When Resolved. Activate to receive an automatic update once an alert has ceased.
Phantom mode
Toggle the Phantom Mode switch to silence the alert. In Phantom mode, alerts can serve as building blocks for flow alerts without triggering independent notifications or creating an incident.
Notification content
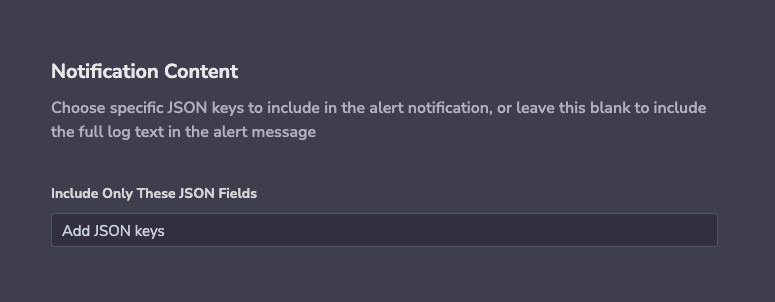
Define notification content.
When a notification is sent, it contains a sample log. It is the newest log that matches the query and alert triggering key:value pair.
Note
- If the alert was set with an evaluation delay, the log's timestamp might be newer, placing it beyond the boundaries of the alert's evaluation timeframe.
- Sample log size is limited to 1.5Kb.
You can control the sample log content by:
- Choosing a specific JSON key(s) to include specific fields into the log sample and removing the rest of the log content.
- Specifying a simple JSONPath as a filter.
- Leaving blank to view the full log text.
Finalize alert
Click CREATE ALERT on the upper-right side of the screen.
After saving your alert, it may take up to 15 minutes for the alert to be active in the cluster.
Related resources
Next steps
Set up volume-based alerting for your logs with Threshold alerts.
Support
Reach our customer success team 24/7 via the in-app chat or by email at [email protected].

