Time Relative Alerts
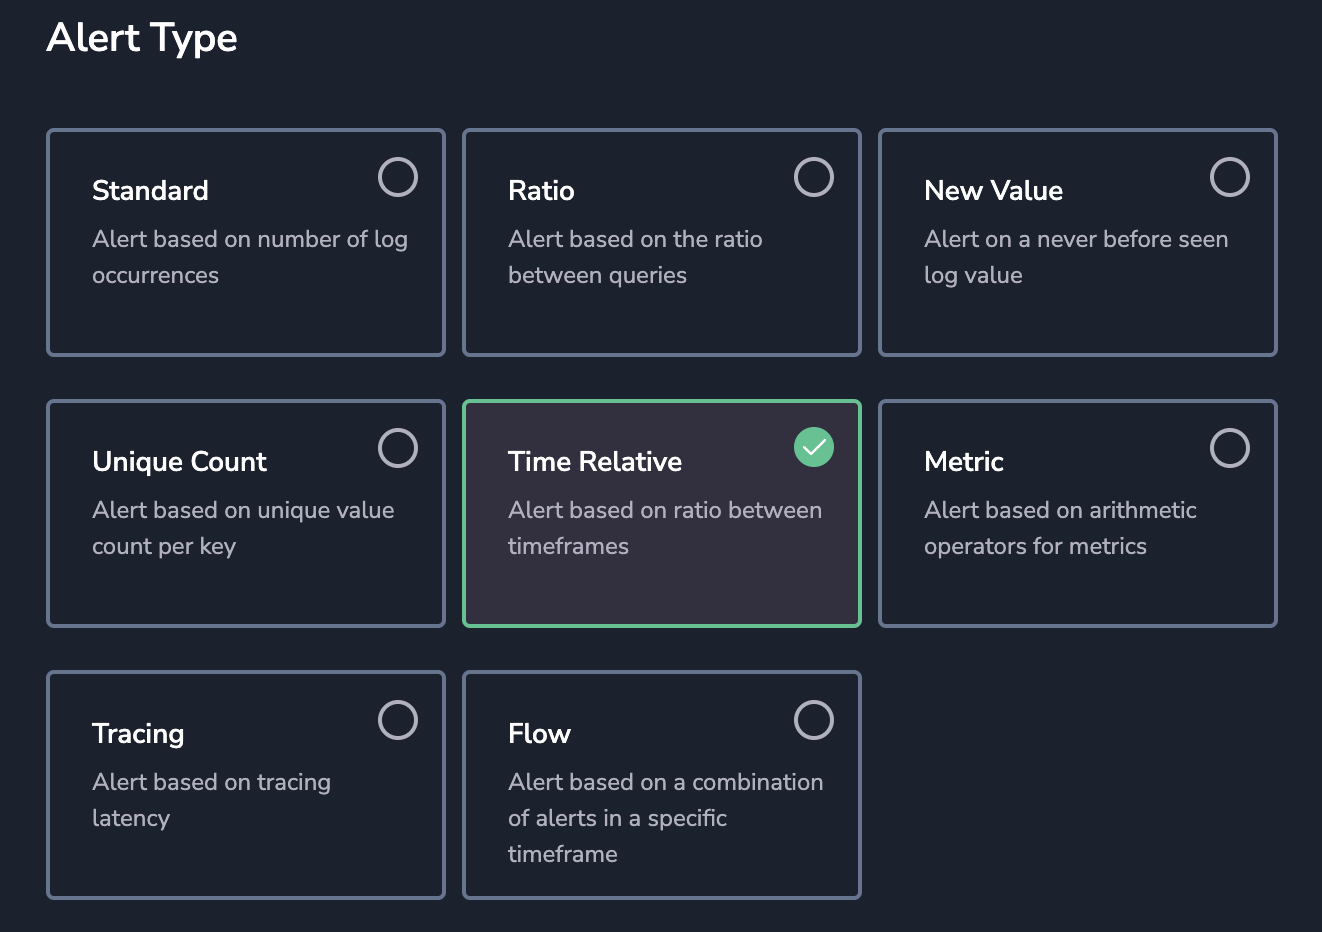
Automatically detect abnormal behavior in your system using the Time Relative Alert. Such alerts are triggered when a fixed ratio reaches a set threshold compared to a past time frame.
Feature
Use this feature to:
Receive automatic alerts regarding changes in your system’s security, operations, and / or business behaviors over time
Compare between each behavior across different time periods
Track and compare your system behavior over time
Security. Receive automatic alerts comparing suspicious behavior. Compare, for instance, the amount of NX domain name responses or admin logins across days or weeks.
Operations. Receive automatic alerts regarding error rates and page loading times in your applications. Compare, for instance, errors rates and page loading times in the past day or hour.
Business. Receive automatic alerts when there is a shift in sales or user signups. Compare, for instance, the amount of purchases on the same day last week or the user signups over the last month.
Create an alert
Create a new alert.
- Click on Alerts > Alert Management in the Coralogix toolbar.
- Click NEW ALERT on the upper right-hand corner of your dashboard.
Alert details
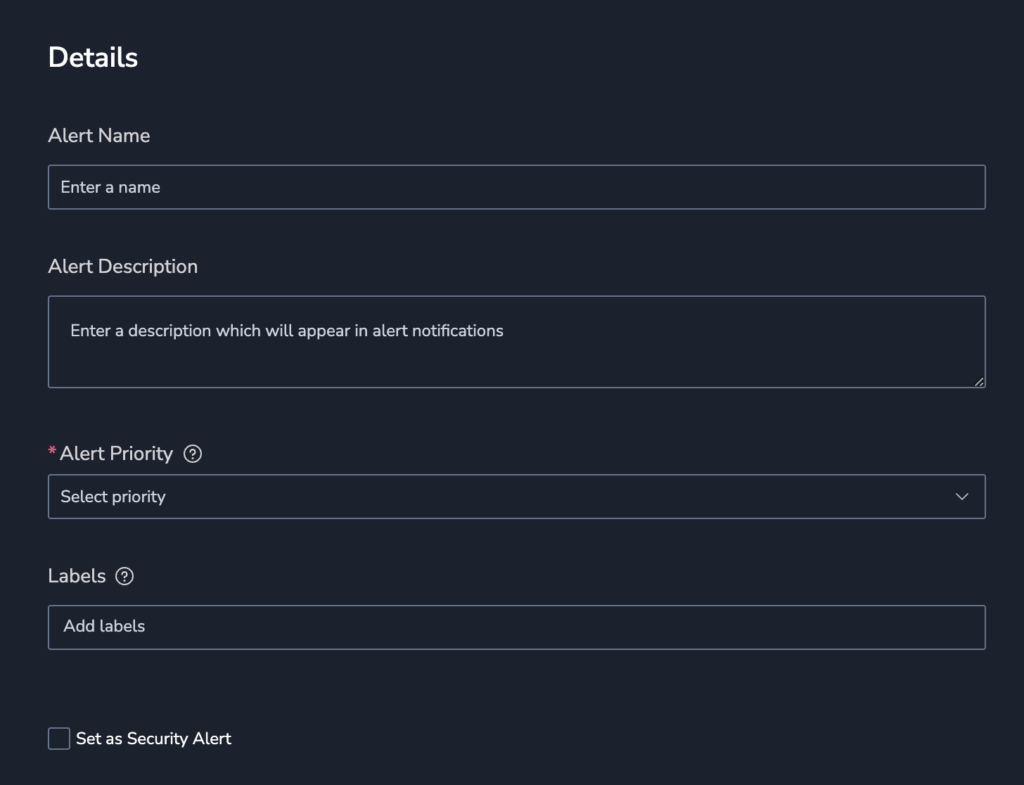
Define alert details: Name, Description, Priority (P1, highest to P5, lowest), Labels (A new label or an existing one. Nest a label using key:value.).
You can also select the Set as Security Alert checkbox to add the alert_type:security label. This will help Security customers filter for this alert type in the Incidents screen.fine.
Query
Define a Query.
- Input a new Query. Using the available RegEx cheat sheet for support.
- Filter by Application, Subsystem and Severities.
Conditions
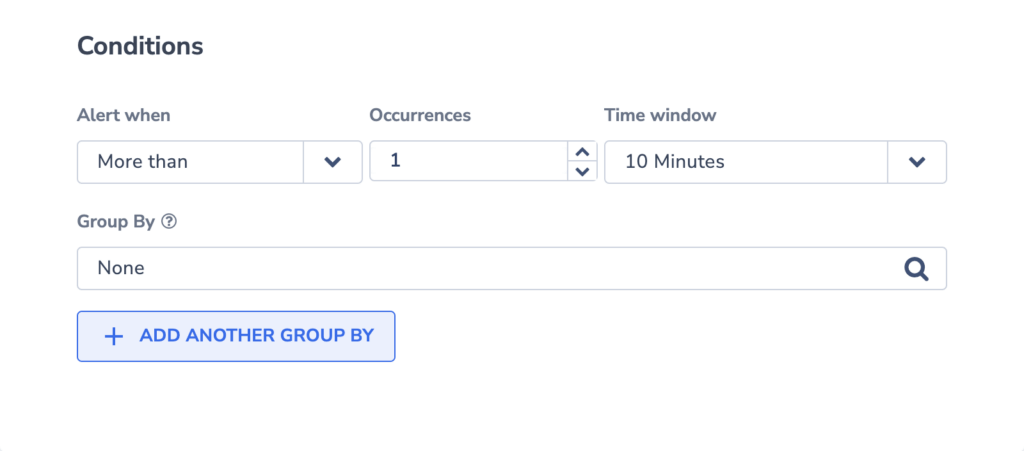
Set the Conditions for triggering an alert.
Alert When
The Alert will trigger when the query matching the alert definition will be more than/less than a number of occurrences when compared to the query results of a particular time window.
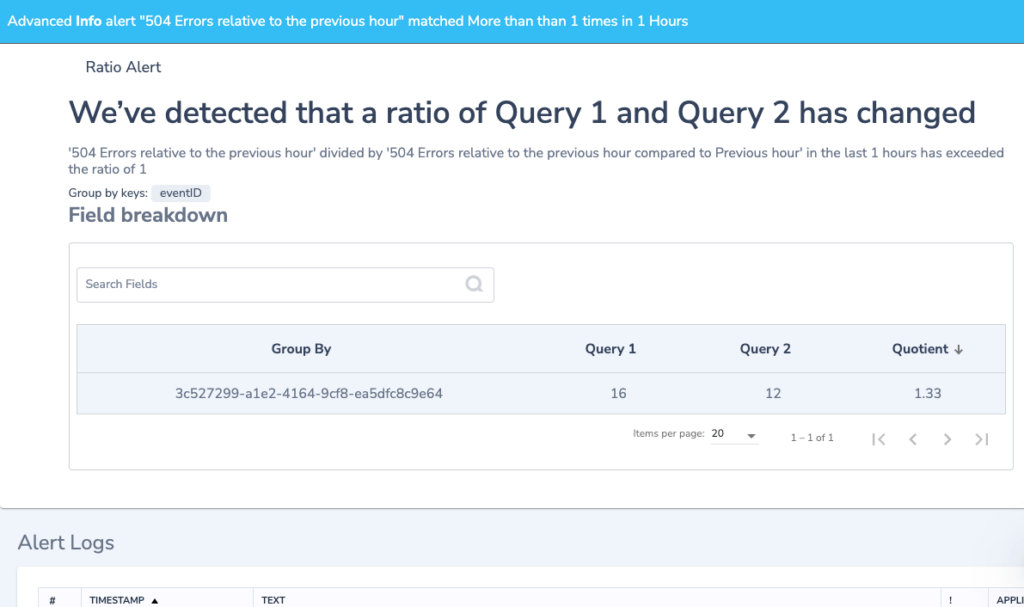
For example, a query returns for the last hour 180 error logs. The same query but in a different timeframe (e.g. previous hour) returns 60 error logs. It means the ratio is 3. If the ratio is more than 1, then the alert will be triggered when the threshold is reached.
Time window
Choose a particular timeframe for comparison.
Options include:
- Previous hour - compare the timeframe "now-1hour TO now" to "now-2hour TO now-1hour" (1 hour)
- Same hour yesterday - compare the timeframe "now-1hour TO now" to "now-25hours TO now-24hours" (1 hour)
- Same hour last week - compare the timeframe "now-1hour TO now" to "now-1week and 1 hour TO now-1week" (1 hour)
- Yesterday - compare the timeframe "now-24hours TO now" to "now-48hours TO now-24 hours" (24 hours)
- Same day last week - compare the timeframe "now-24hours TO now" to "now-8days TO now-7days" (24 hours)
- Same day last month - compare the timeframe "now-24hours TO now" to "now-29days TO now-28days" (24 hours)
- A comparison between timeframes is made either every 5 minutes (for: Previous hour, Same hour yesterday, Same hour last week) or every 10 minutes (for: Yesterday, Same day last week, Same day last month).
Group By
Group your alerts using one or more aggregated values into a histogram.
- An alert is triggered whenever the condition threshold is met for a specific aggregated value within the specified timeframe.
- If using 2 values for Group By, matching logs will first be aggregated by the parent field (ie. region), then by the child field (ie. pod_name). An alert will fire when the threshold meets the unique combination of both parent and child. Only logs that include the Group By fields will be included in the count.
Notifications
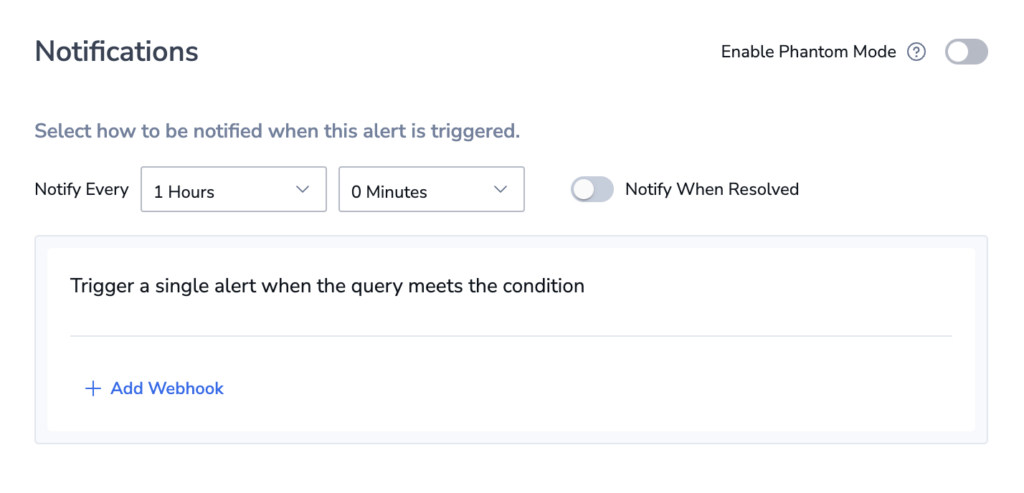
Define Notification settings.
In the notification settings, you have different options, depending on whether or not you are using the Group By condition.
With Group By
When using Group By conditions, you will see the following options:
- Trigger a single alert when at least one combination of the group by values meets the condition. A single notification, aggregating all values matching an alert query and conditions, will be sent to your Coralogix Incidents screen.
- Trigger a separate alert for each combination that meets the condition. Multiple individual notifications for each Group By field value may be sent to your Coralogix Incidents screen when query conditions are met. Select one or more Keys - consisting of a subset of the fields selected in the alert conditions - in the drop-down menu. A separate notification will be sent for each Key selected.
- The number of Group By permutations is limited to 1000. If there are more permutations, then only the first 1000 are tracked.
Without Group By
When not using the Group By condition, a single alert will be triggered and sent to your Incidents Screen when the query meets the condition.
You can define additional alert recipient(s) and notification channels in both cases by clicking + ADD WEBHOOK. Once you add a webhook, you can choose the parameters of your notification:
- Notify Every. Sets the alert cadence. After an alert is triggered and a notification is sent, the alert will continue to work, but notifications will be suppressed for the duration of the suppression period.
- Notify when resolved. Activate to receive an automatic update once an alert has ceased.
Advanced notifications
Once you add a webhook to the notification group, a toggle appears which enables you to move to Advanced Mode. Advanced mode lets you set the notify every & notify when resolved settings for each webhook individually. Note that the toggle affects all notification groups, and when activate the toggle in one notification group, it will be turned on in all notification groups.
Phantom mode
Toggle the Phantom Mode switch to silence the alert. In the Phantom mode, alerts can serve as building blocks for flow alerts without triggering independent notifications or creating an incident.
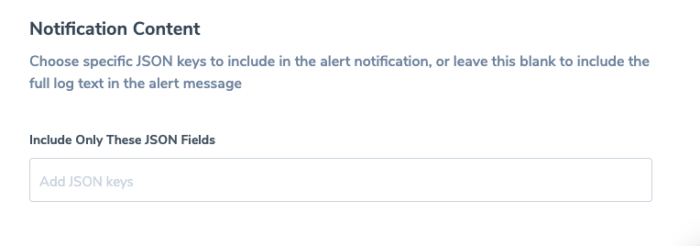
Notification Content
Define Notification Content.
When a notification is sent, it contains a sample log. It is the newest log that matches the query and alert triggering key:value pair.
Note
- If the alert was set with an evaluation delay, the log’s timestamp might be newer, placing it beyond the boundaries of the alert’s evaluation timeframe.
- Sample log size is limited to 1.5Kb.
You can control the sample log content by:
- Choosing a specific JSON key(s) to include specific fields into the log sample and removing the rest of the log content.
- Specifying a simple JSONPath as a filter.
- Leaving blank to view the full log text.
Support
Need help?
Our world-class customer success team is available 24/7 to walk you through your setup and answer any questions that may come up.
Contact us via our in-app chat or by emailing support@coralogix.com.
