Tracing alerts
Tracing is one of the fundamental pillars of observability. It allows you to track interactions between all of your applications and understand where performance bottlenecks or errors are occuring.
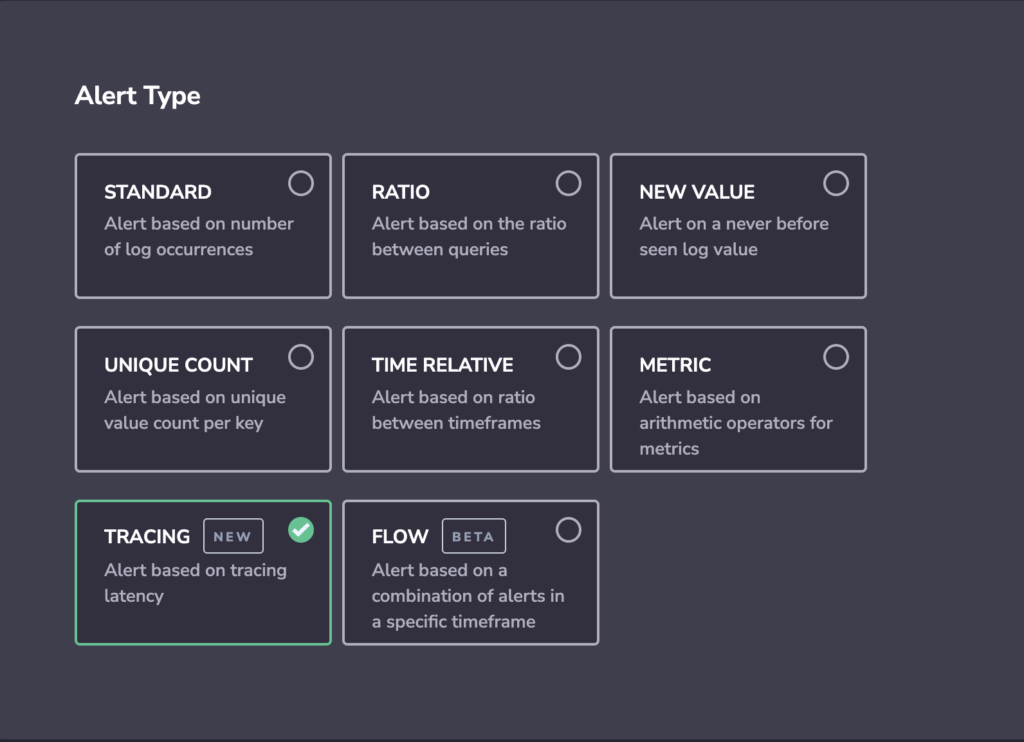
Coralogix allows you not only to visualize your traces, but also set alerts on them. The tracing alert allows you to be alerted automatically of specific tags and services on the basis of a specified latency.
Create a tracing alert
Create a new Alert.
- Access Alerts, then Alert Management.
- Click Create Alert on the upper right-hand corner of your dashboard.
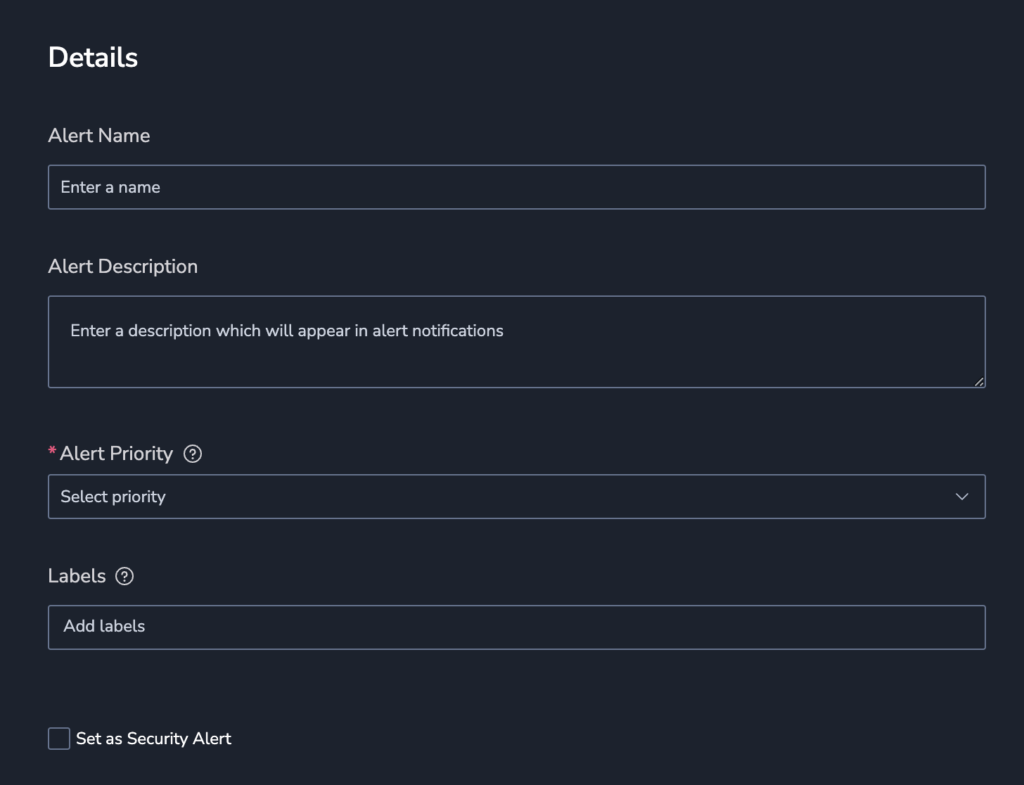
Define alert details:
- Alert Name.
- Alert Description.
- Priority. Set alert priority: P1, highest to P5, lowest.
- Labels. Define a new label or choose from an existing one. Nest a label using
key:value. - Set as Security Alert. Check this option to to add the
alert_type:securitylabel. This will help Security customers filter for this alert type in the Incidents screen.
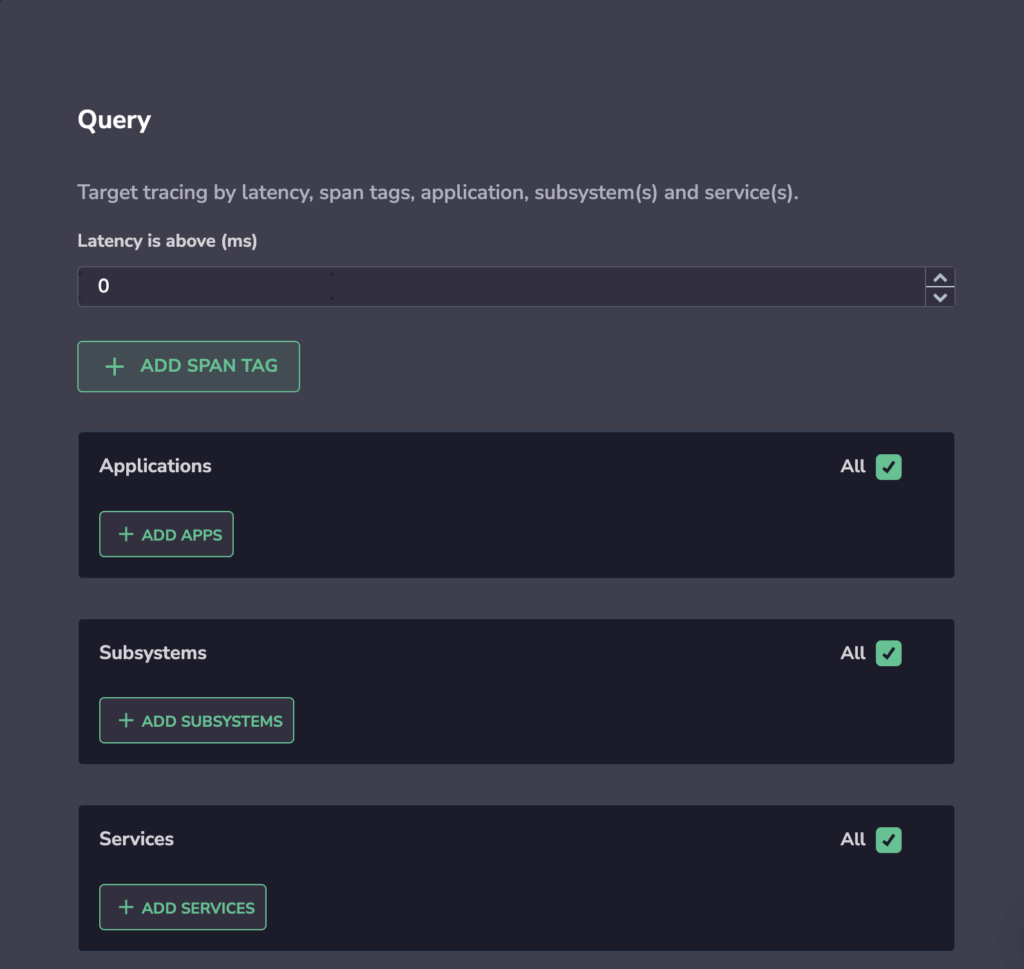
Define Query parameters.
- Latency is above (ms). Set this value to maximum latency - that is, the latency you are prepared to tolerate. Values greater than this will cause your spans to be counted as part of the data that will trigger your alerts.
- + Add Span Tag. You may choose to add span tag to filter your spans. For example, if your span has a label that indicates it is a customer-facing component, you can add this Key - Value pair to ensure the alert does not consider any of those spans. Value may be followed by any of the following: Is, Starts With, Includes, Ends With or Is.
- You may choose to add Application, Subsystem and Services filters. Maintain default options by selecting the All option. Note: Each span may have a different application and / or subsystem.
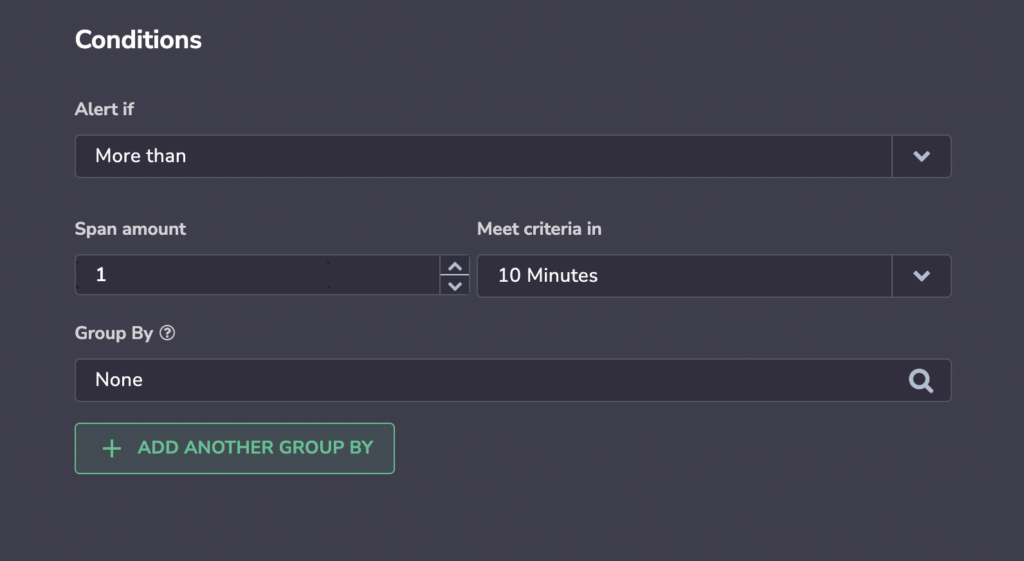
Define Alert Conditions.
- Alert if. Select whether to trigger the alert immediately, or define a rule based on the number of occurrences within a specified time window.
- An alert is triggered whenever the condition threshold is met for a specific aggregated value of the tag selected within the specified timeframe.
- If using 2 labels for Group By, matching metrics will first be aggregated by the parent label (ie. region), then by the child label (ie. pod_name). An alert will fire when the threshold meets the unique combination of both parent and child. Only metrics that include the Group By labels will be included in the count.
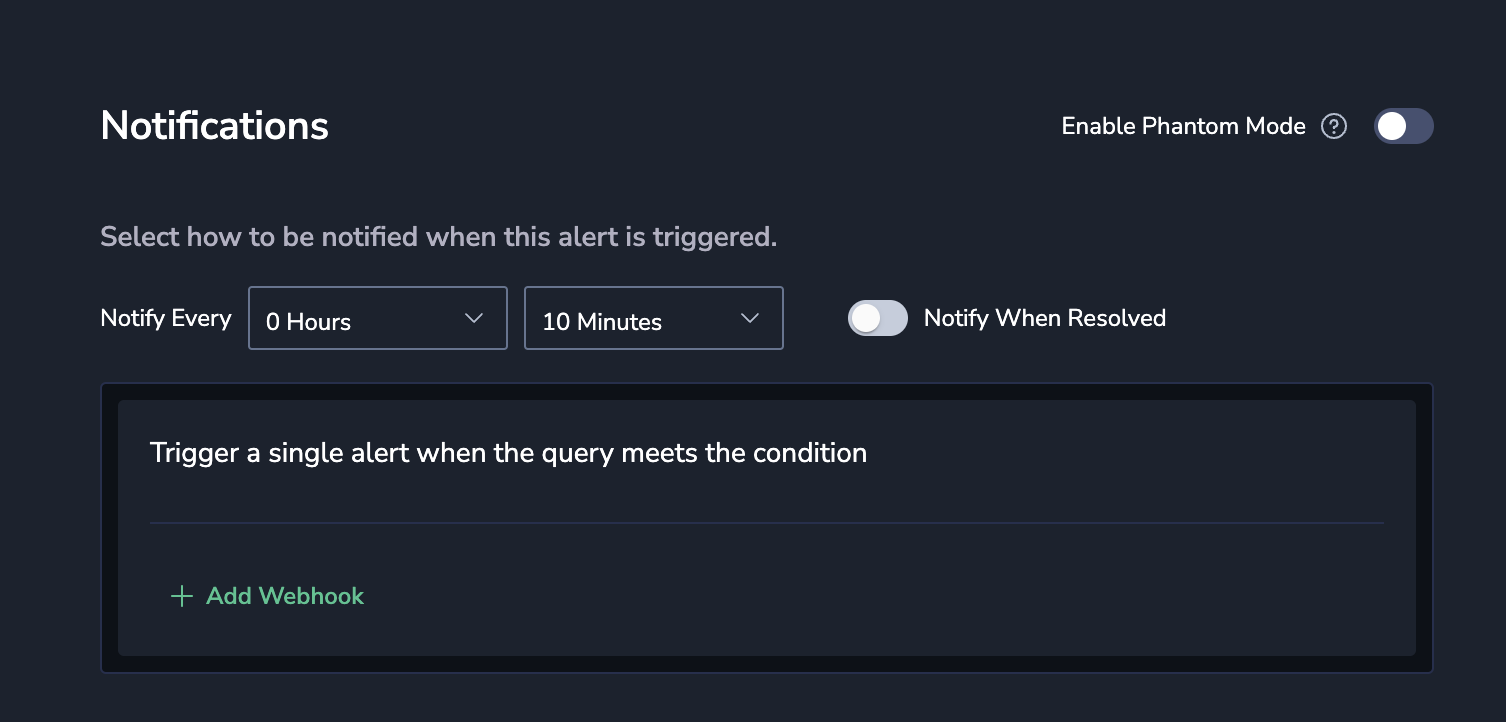
Define Notification settings. Select how to be notified when an alert is triggered. By default, a single notification, aggregating all values matching an alert query and conditions, will be sent to your Coralogix Insights screen.
- + ADD WEBHOOK. Define additional alert recipient(s) and notification channels.
- Notify Every. Sets the alert cadence. After an alert is triggered and a notification is sent, the alert will continue to work, but notifications will be suppressed for the duration of the suppression period.
- An individual notification for each of the values of the Group By fields will be sent when query conditions are met. Choose the recipient of the notification and the notification parameters.
- Phantom Mode. Toggle the Phantom Mode switch to silence the alert. In the Phantom mode, alerts can serve as building blocks for flow alerts without triggering independent notifications or creating an incident.
To finalize your alert, click CREATE ALERT.
Related resources
Next steps
Combine multiple alerts into a sequence-based trigger with Flow alerts.
Support
Reach our customer success team 24/7 via the in-app chat or by email at [email protected].
