Metric based query
Data source
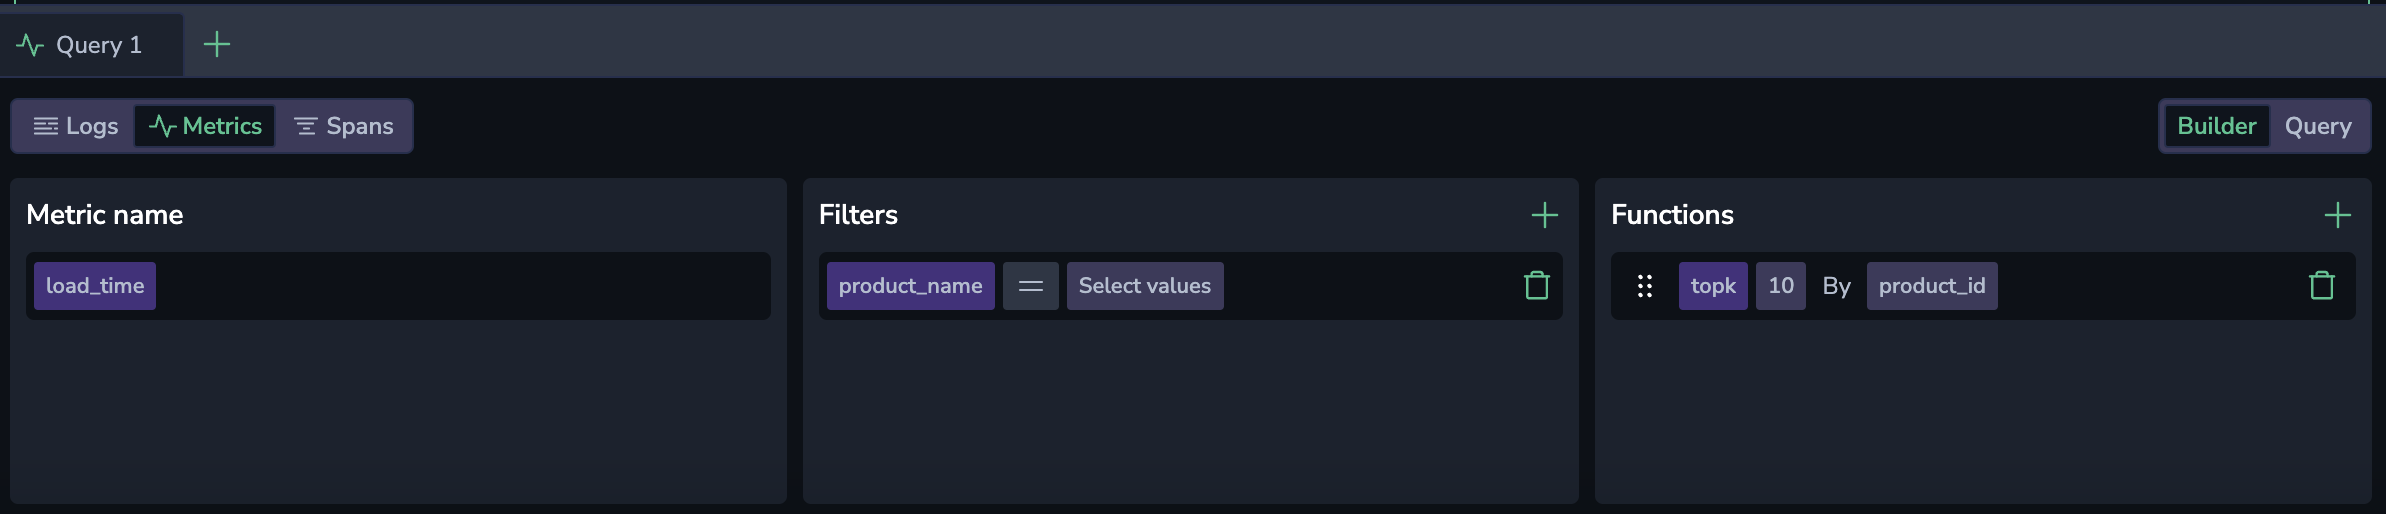
In Builder mode, select metrics as your source.
Query type
Select either an instant or range query. The query is executed over a specific timeframe, defined by the dashboard time picker or the widget timeframe.
Instant query mode displays the metric's value at a single point in time, specifically at the end timestamp of the selected timeframe. This mode is ideal for real-time monitoring, providing a snapshot of data at the moment of visualization. It is also more performant, retrieving only the most recent data point without fetching the entire dataset.
Range query mode retrieves and aggregates metric data over a specified timeframe. It returns all data points between the start and end timestamps that match your query. As the timeframe changes, the system automatically adjusts the interval to optimize the number of data points displayed in the graph. This mode is well-suited for identifying trends or evaluating performance over a defined period.
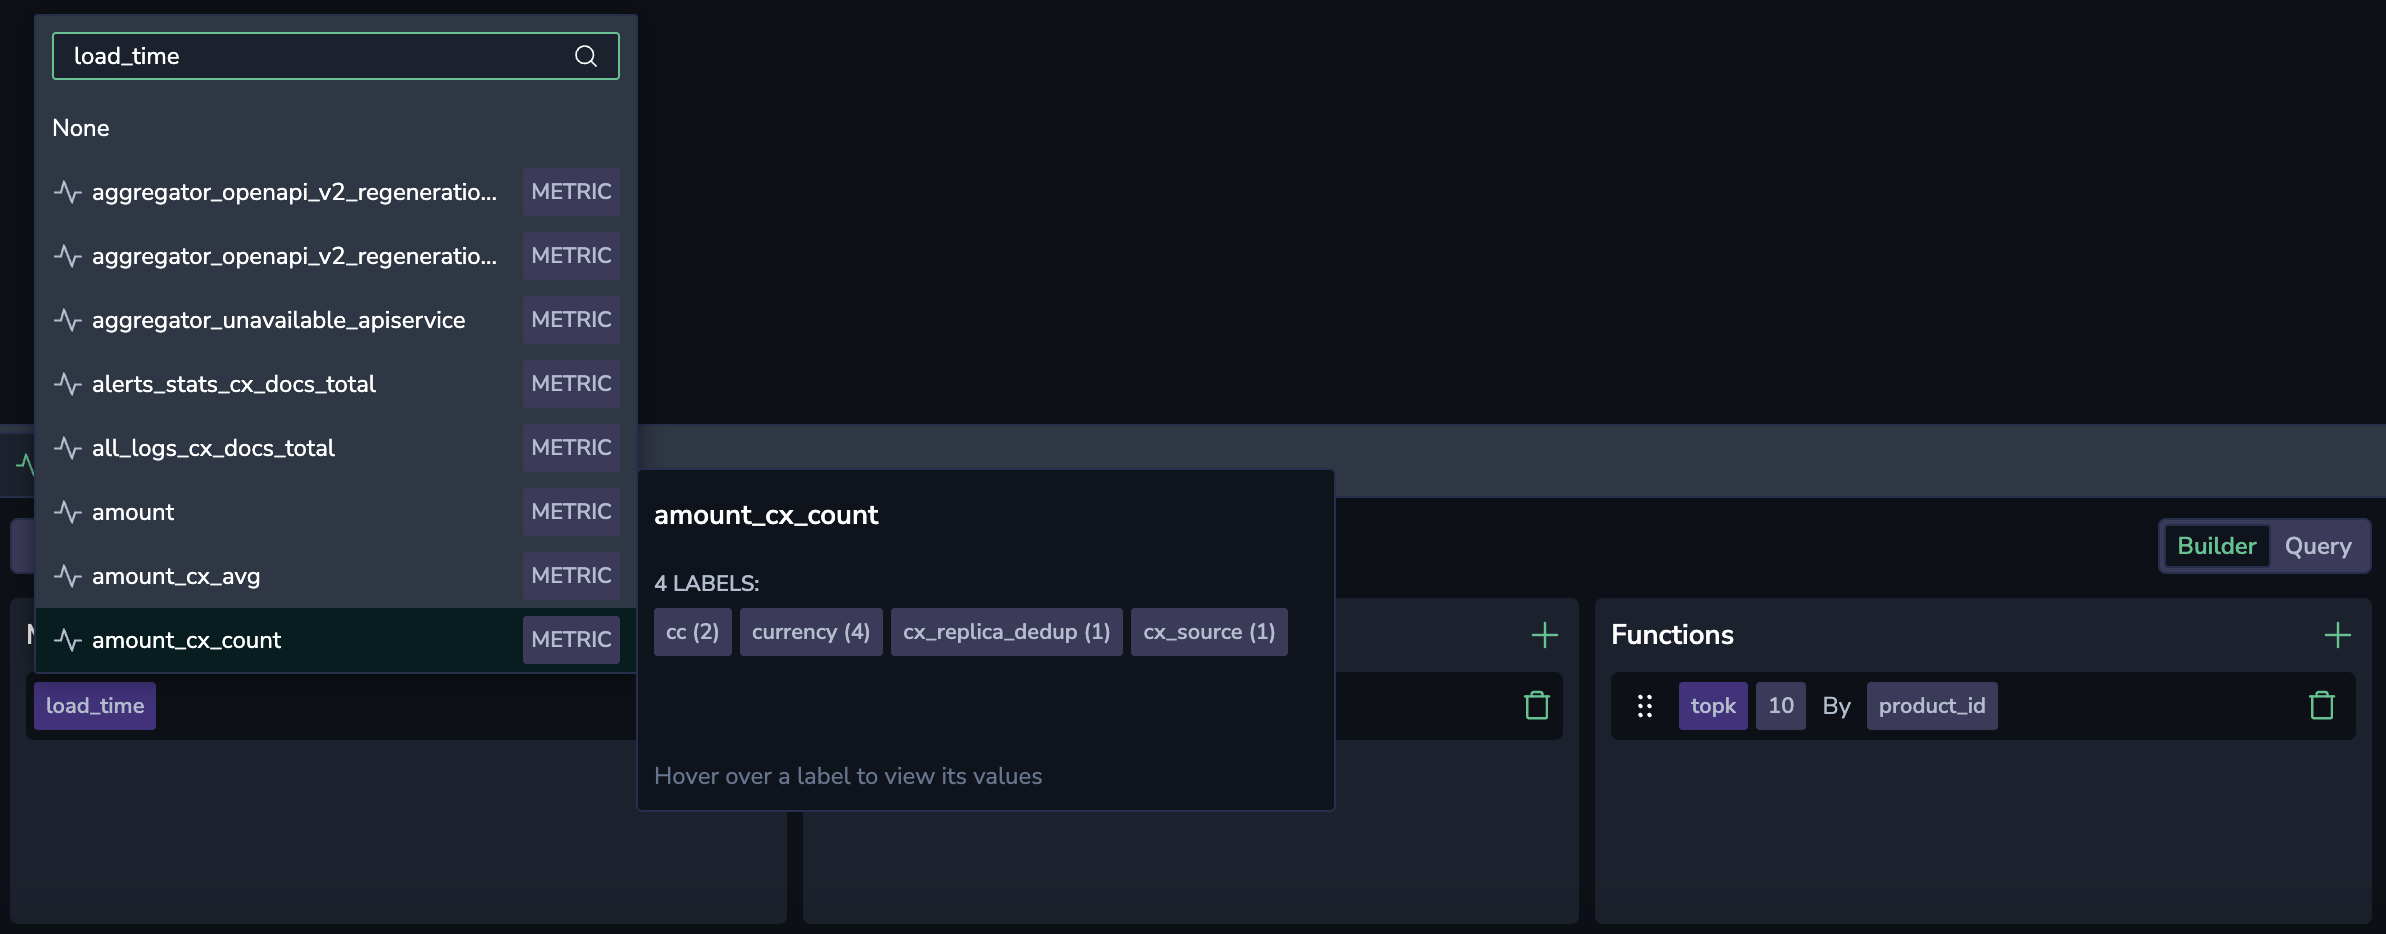
Metric name
Select your preferred metric from a dropdown menu that is dynamically filled with available metrics. Use the autocomplete capability to explore the metric name, labels, and values.
Filters
To add a filter, select +. Select a metric label and an associated value to filter your metric.
Select the = or != operator from the drop-down menu to include or exclude one or more values, respectively. Selecting the =~ or !~ operators will allow you to input a regex expression.
To add additional label-value pairs, select the + button.
Functions
Selecting metrics and labels already builds a valid Prometheus query, but you can create more complex queries using functions.
To add a function, select +. Select between aggregation, count and rollup functions.
Aggregation
Aggregation functions calculate a set of values and return a single value. Once you select the function, select the label to aggregate in the dropdown menu or type it.
| Aggregation | Description |
|---|---|
avg | The average value of all data points within the selected time range. |
count | The total number of data points within the selected time range. |
min | The smallest value among the data points within the selected time range. |
max | The largest value among the data points within the selected time range. |
sum | The sum of all data points within the selected time range. |
quantile | The quantile(phi, q) by (group_labels) function is an aggregate that computes the phi-quantile for each group of labels within the time series returned by q. The value of phi must fall within the range [0...1]. The quantile is calculated separately for each set of points that share the same timestamp. This function is supported by PromQL. |
histogram_quantile | The histogram_quantile function is a transformation function that computes the phi-percentile based on the provided histogram buckets. The value of phi must be between [0...1]. For example, histogram_quantile(0.5, sum(rate(http_request_duration_seconds_bucket[5m])) by (le)) returns the median request duration for all requests in the last 5 minutes. |
Count
Count functions perform calculations on a set of values and return a single value.
| Count | Description |
|---|---|
count | The total number of data points within the selected time range. |
absent | Returns 1 if time series have no points. Otherwise, it returns an empty result. |
absent over time | Returns 1 if the provided time range does not contain raw samples. |
present over time | Returns 1 if there is at least a single raw sample in the provided time range. |
changes | The number of times that the time series value has changed within the provided time range. |
resets | The number of counter resets within the provided time range. |
Rollup
Rollup functions aggregate time series data over a specified time range.
| Rollup | Description |
|---|---|
average over time | Computes the average of time series values over a time range. |
max over time | Finds the maximum value of time series data over a time range. |
min over time | Determines the minimum value of time series data over a time range. |
sum over time | Calculates the sum of time series values over a time range. |
count over time | Counts the number of non-NaN elements in the time series over a time range. |
quantile over time | Computes the specified quantile of time series data over a time range. |
Once you select the function, select the range to be queried as a hard number or ${__range}. This variable represents the duration of the dashboard time range. It is rendered as an interval string supported by PromQL. For example, if one selects a time range from 13.00 to 14.30, the ${__range} variable will be rendered as 90m. For detailed information about pre-defined variables, see this tutorial.
Rank
Rank functions allow you to sort, rank, and filter data within your queries. You can use them to refine your results based on specific metrics and values.
To add a rank function, select + and select from TOPK, SORT, or SORT Descending. Once you select a rank function, configure it by specifying the metric and parameters (e.g., populate the number of K results you would like the query to retrieve for TOPK).
| Rank Function | Description |
|---|---|
TOPK | Retrieves the top K results from a dataset based on a specified metric. Use this to show the highest-ranking data points. |
SORT | Orders data in ascending order based on the selected metric. Use this to organize data from the smallest to the largest value. |
SORT Descending | Orders data in descending order based on the selected metric. Use this to prioritize the largest values at the top of the result set. |