APM v2
APM v2 is the next generation of Coralogix Application Performance Monitoring. It brings your services and databases together as entities under one health model, so you can tell which users are impacted, why, and what to do - across every service you run.
It traces requests across your services and databases, surfaces RED metrics (Rate, Errors, Duration), and correlates traces with logs, profiles, and infrastructure so you can detect and resolve issues faster.
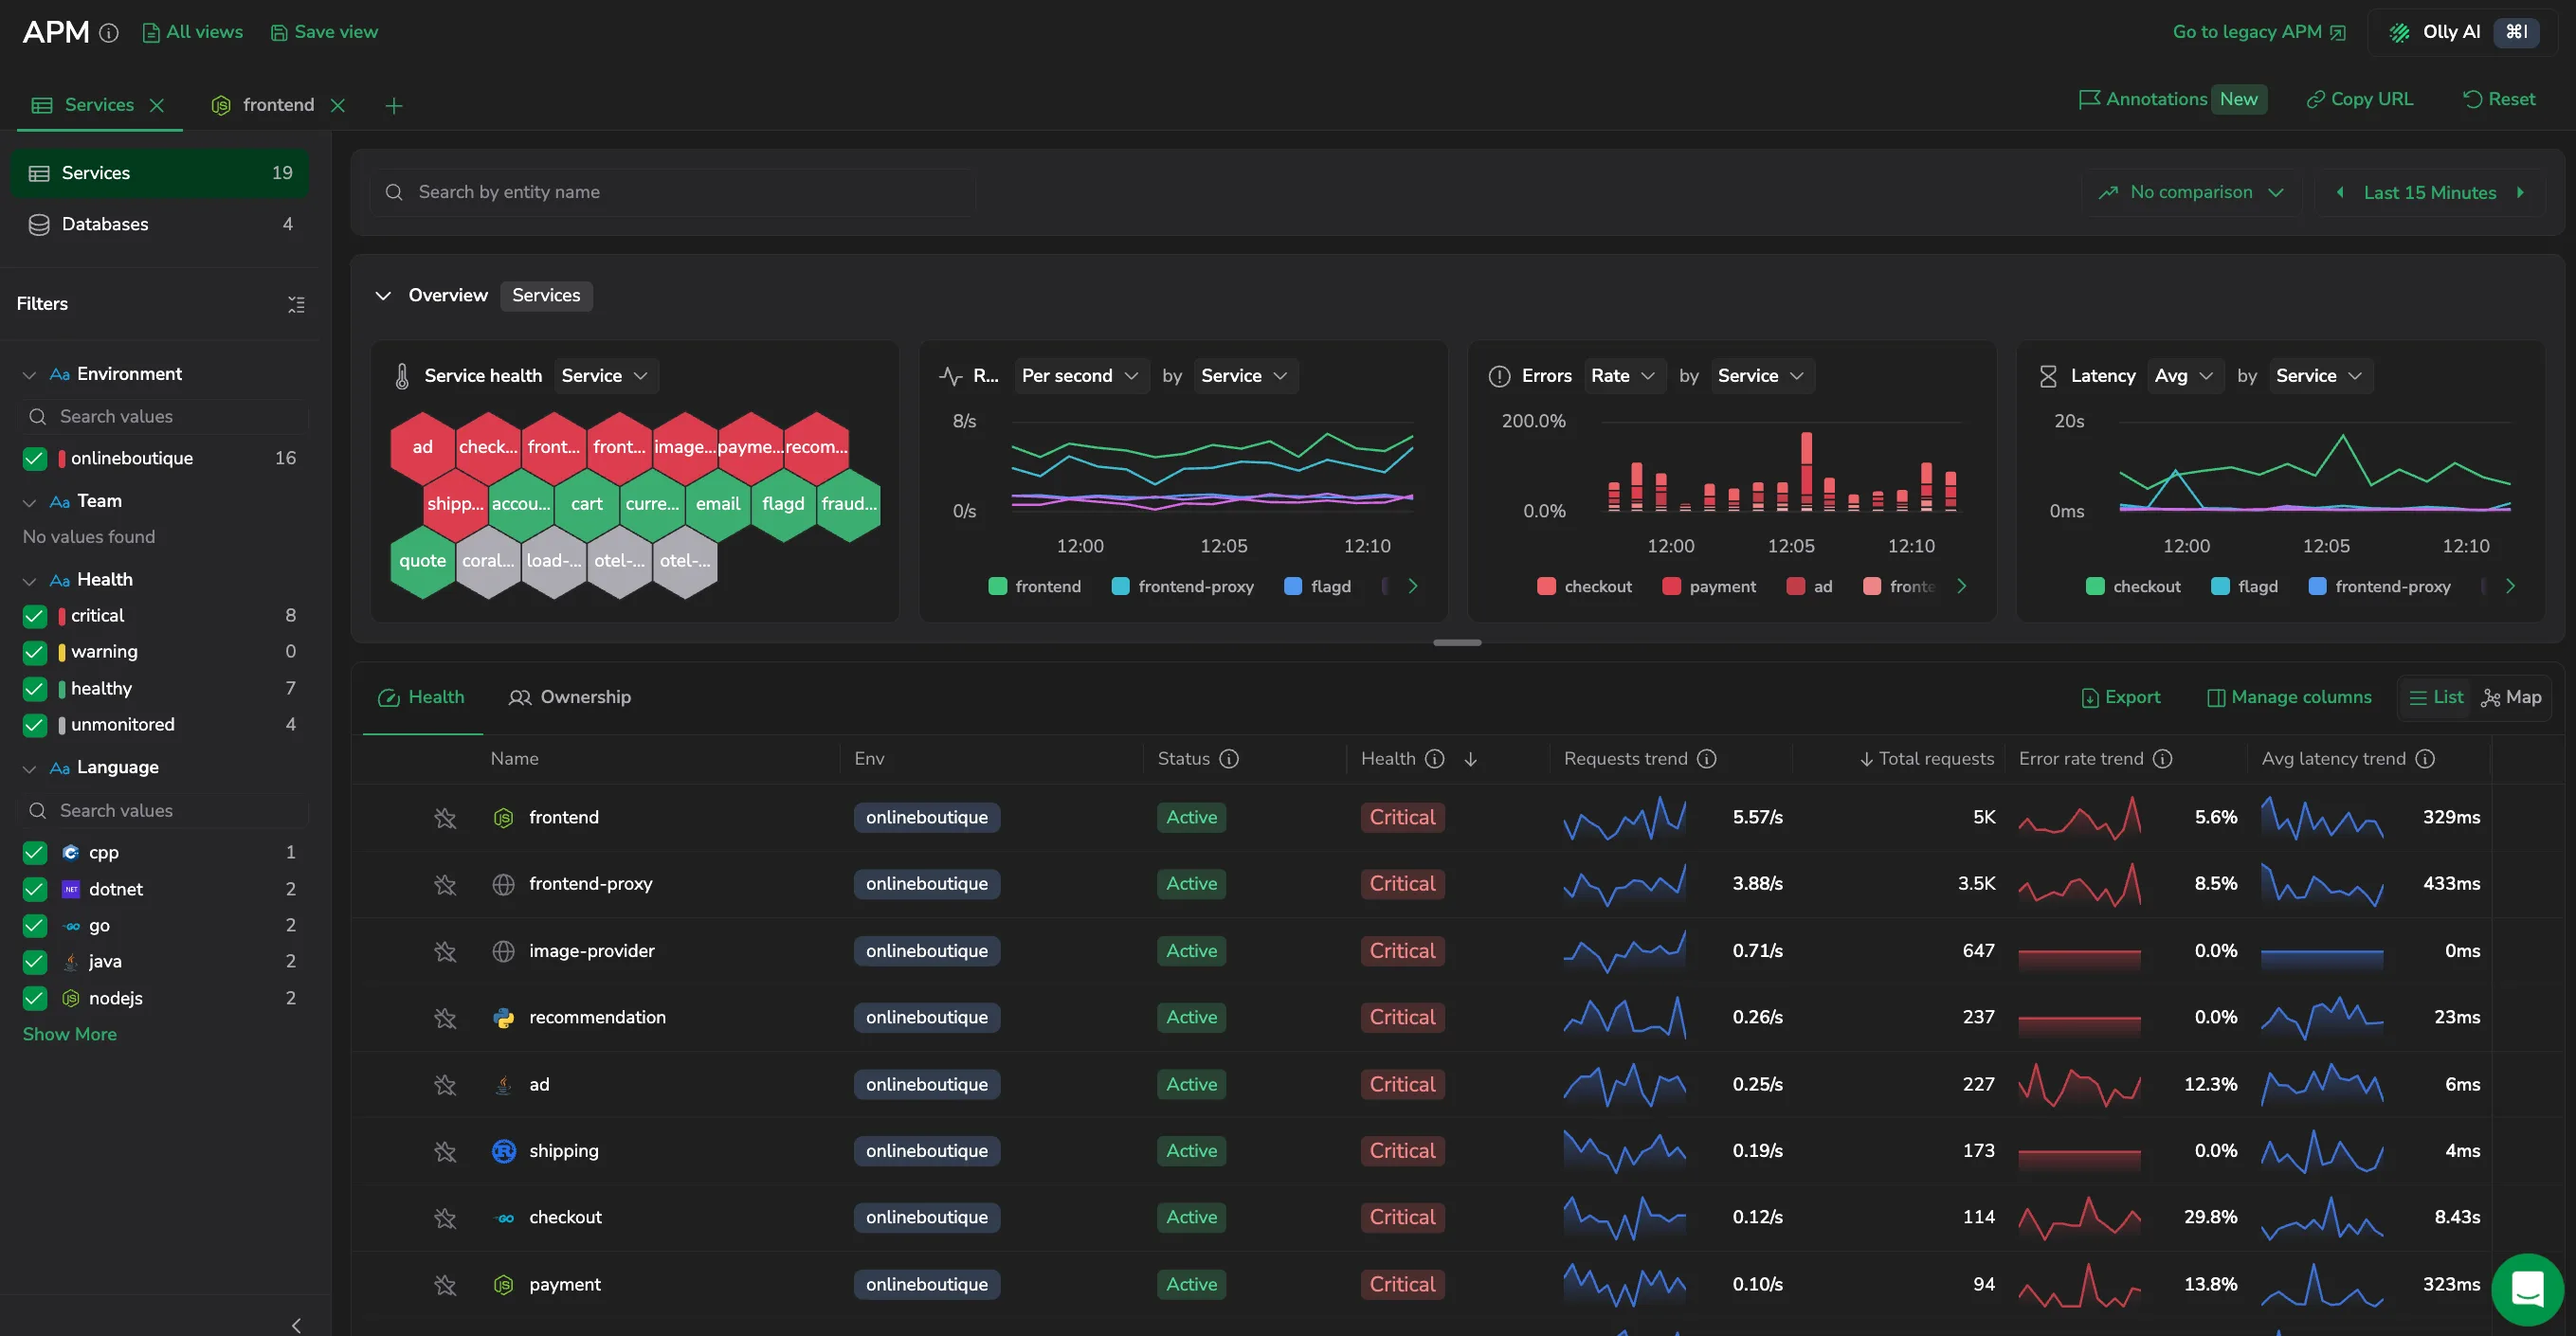
A single catalog lists all your services and databases, and each entity opens a drilldown with the telemetry that matters for its type - health, transactions, errors, dependencies, and more.
Instrument your first service in the onboarding tutorial.
What you can do
- Explore entities in one catalog: browse every instrumented service and database, sort by health or ownership, and filter by environment, team, or health.
- Drill into a single entity: open a service or database to see its health, transactions, errors, dependencies, traces, logs, profiles, and infrastructure.
- Correlate signals: pivot from a metric spike to the traces, logs, and profiles behind it without leaving APM v2.
- Track health over time: compare current performance against a previous period and watch annotations for deployments, alerts, and configuration changes.
Entities
APM v2 monitors two entity types:
- Services: instrumented applications that receive and send requests. Services expose the full feature set: health, transactions, errors, runtime metrics, dependencies, traces, logs, profiles, and infrastructure.
- Databases: database systems your services query. Databases expose a focused set: operations, errors, traces, and their place in the service map.
Use the sidebar to switch the catalog between services and databases.
Signals
A signal is a data source that reports for an entity. The catalog's Signal column shows which ones are arriving, as a row of chips per entity. An entity reports six:
- Traces: distributed traces from the entity.
- Profiles: CPU profiles from Continuous Profiling.
- Infra: resource metrics for the hosts, pods, and containers the entity runs on.
- Transactions: transaction data, from Span Metrics with transactions enabled.
- Runtime metrics: runtime data from the service. Currently available for Java services that send JVM metrics.
- Ops events: deployment and custom events sent for the service.
Services that receive traffic from frontend applications monitored with Real User Monitoring also show a RUM chip.
A chip is active once that data source starts reporting, so the column reflects what is arriving now, not what you have configured. A signal that isn't sending is dimmed, and hovering it explains why and links to its setup guide. See the Signal column.
Two things are deliberately not signals:
- Span Metrics are the RED metrics derived from your spans. They aren't a chip, because they're what populates the catalog and the health model in the first place - without them there is no entity to report a signal. See What you need.
- Logs correlated to an entity appear in its drilldown's Logs tab, but they aren't tracked as a signal in the catalog.
Health
Every entity is assigned a health state based on its monitoring policies - apdex, cases, error rate, latency, log errors, and SLOs:
- Critical: one or more policies are breached.
- Warning: one or more policies are at risk.
- Healthy: all policies are within range.
- Unavailable: no health policies evaluate for this entity yet.
How it's organized
| Surface | What it shows |
|---|---|
| Catalog | The main screen - a filterable table of all services or databases, with RED and health overview widgets above it. |
| Entity drilldown | A single entity's detail view, split into tabs for health, transactions, errors, dependencies, and more. |
| Getting started | Instrument your services with span metrics so they appear here. |
| Use cases | Common tasks mapped to features, plus a role-based tour. |
What you need
- Instrumented services that send spans to Coralogix. See the onboarding tutorial.
- Compact span metrics for your services. The new APM reads these to populate the Services catalog - regular Span Metrics alone is not enough. See Using compact Span Metrics.
- Compact database metrics to monitor your databases. These power the Databases catalog only. Without them, the new APM still works for your services and Databases are unavailable - continue using legacy APM for databases until the metrics are in place.
How you get the new APM
Once your account meets those requirements, Coralogix opens the new APM for you - you don't have to opt in. Selecting APM in the toolbar takes you straight there, with a welcome dialog over the page that confirms what's ready. An account that doesn't yet meet them stays on legacy APM, where a banner offers Try it now as the way across.
Three conditions are checked:
- The service catalog reports through Span Metrics rather than Events2Metrics.
- The database catalog reports through Span Metrics.
- Compact Span Metrics are available for your services.
You can go back at any time with Go to legacy APM, and legacy APM stays reachable while you migrate.
When database metrics are missing
Compact database metrics are not part of that check, so an account without them still gets the new APM for its services. In that case:
- The Databases scope in the sidebar is unavailable. Hover it to see why, with links to open the databases in legacy APM and to the setup documentation.
- Selecting a database anywhere in the new APM - a map node, a table row, an overview - opens its drilldown in legacy APM, carrying your current time range.
- The welcome dialog reports that services are open and marks the database metric as Not sending.
Related resources
- Span metrics
- Continuous Profiling
- Service Level Objectives
- The new APM experience: every service monitored from day one, and ready for your AI agent - an overview of the new APM, on the Coralogix blog.
Next steps
See how each role uses APM v2 in Use cases.