Databases
Databases are the datastores your instrumented services query, monitored in APM v2 as first-class entities alongside your services. Coralogix derives RED metrics (requests, errors, duration) from the database client spans your services emit, so a slow query or a failing datastore surfaces next to the services it affects, with no database agent to install. Select Databases in the sidebar to scope the catalog to databases, then open any database to drill into its operations.
Use it to:
- Find the slow database behind a slow service: rank a database's operations by the time they consume and surface the query dragging performance down.
- Catch failing queries: track query error rate and failures per second, per operation.
- See which services hit a database: read how many services call each operation, and which tables they touch.
- Trace a query to its spans: open any operation to inspect the individual query spans and the traces they belong to.
What you need
- Coralogix APM installed, with your services instrumented to emit spans.
- Span Metrics with database metrics enabled. The Span Metrics preset generates RED metrics for database client spans (the
db_compact_calls_totalmetric), which is what makes your databases appear as entities. It is on by default in the latest Coralogix Helm chart. Without this metric, Databases are unavailable in the new APM - your services are unaffected, and legacy APM remains available for databases until it arrives. - Database client spans that follow the OpenTelemetry database semantic conventions, so Coralogix can identify the datastore, table, and operation:
| Attribute | Populates |
|---|---|
db.system | The database system - for example postgresql, mysql, mongodb, redis. Also the catalog's DB system filter. |
db.namespace | The database (or namespace) being accessed. |
db.collection.name | The table or collection an operation reads or writes. Populates the Table column. |
db.operation.name | The operation, such as SELECT or findAndModify. |
Databases in the catalog
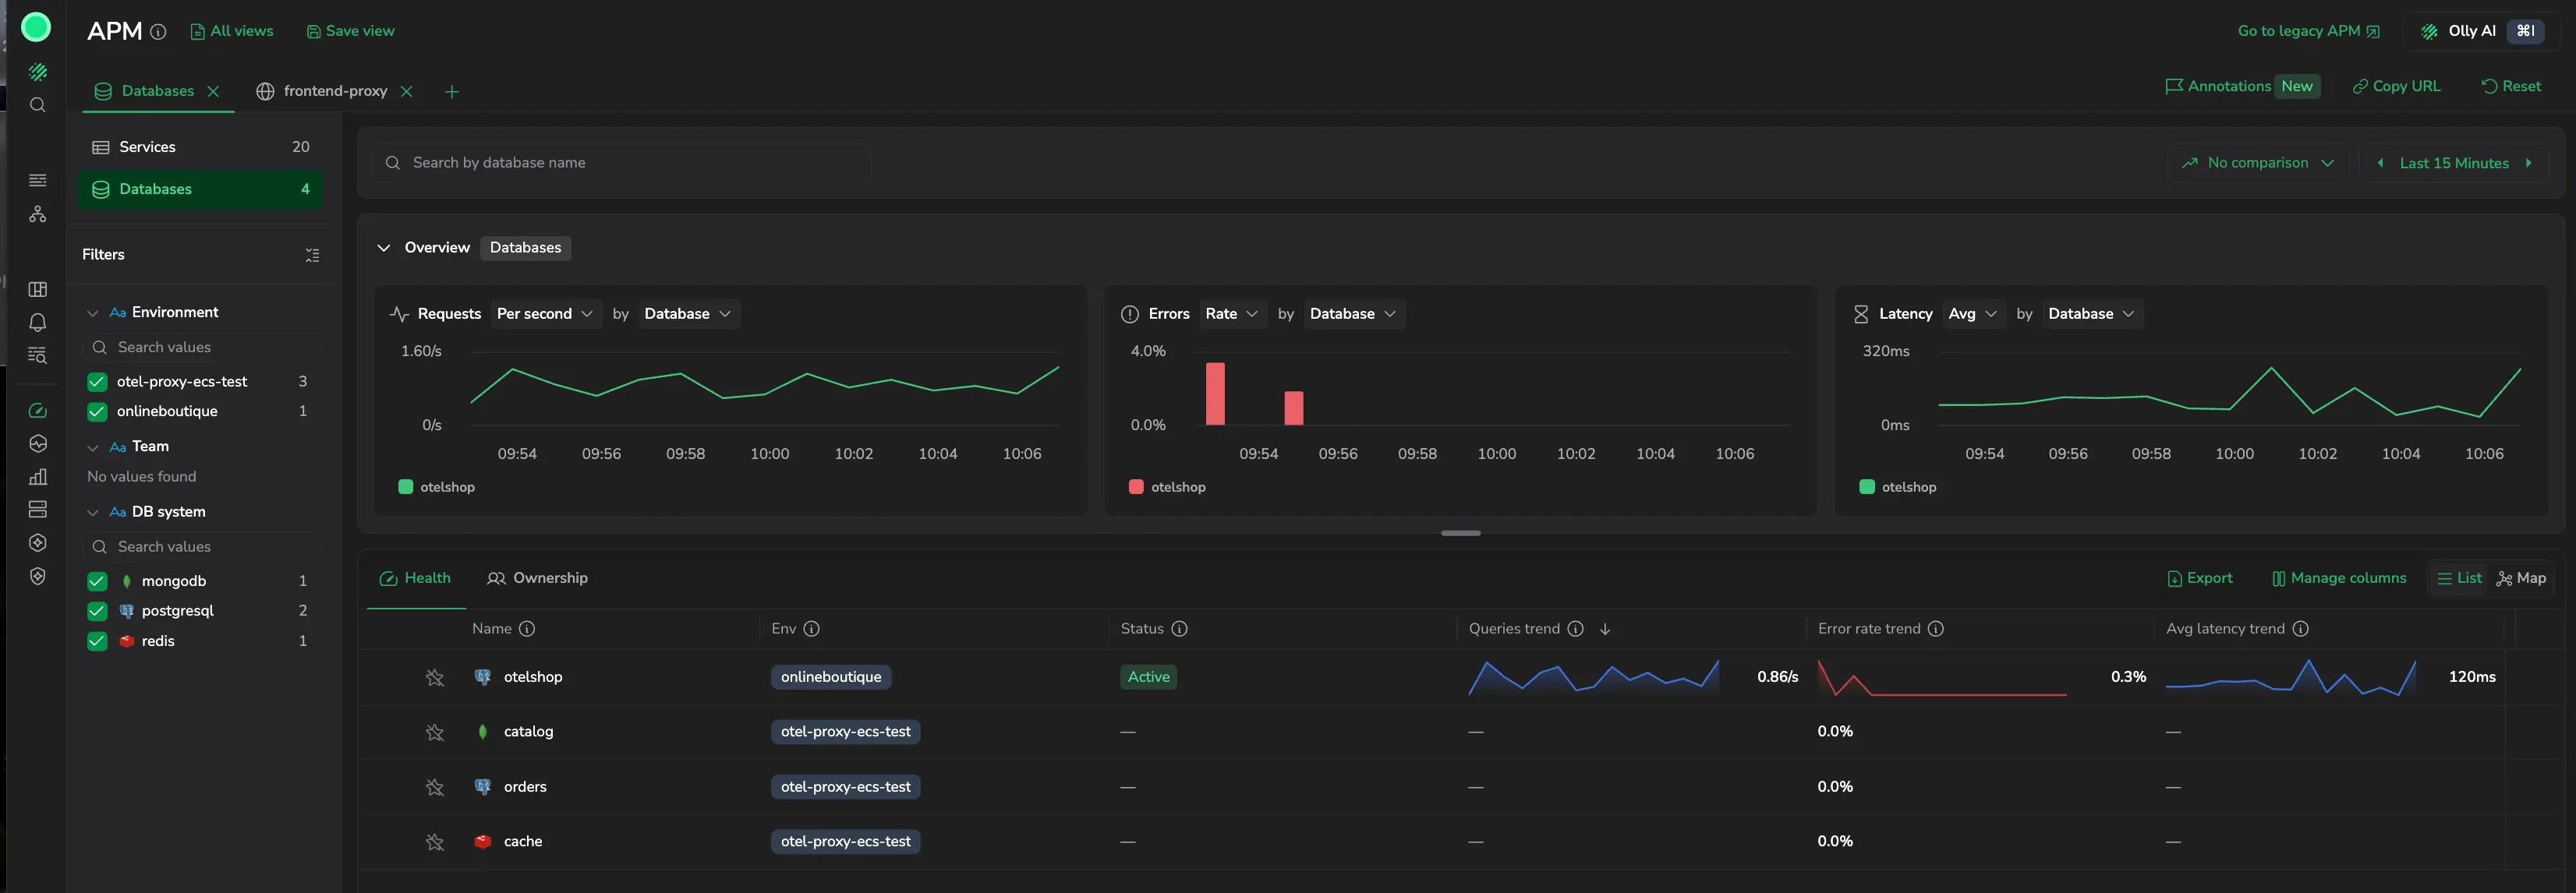
Databases appear in the catalog alongside services. Select Databases in the sidebar to scope the catalog to databases only. The table then shows database-specific columns - query volume (Queries, Total queries), error rate, latency, and health - and the sidebar offers Environment, Team, Health, and DB system filters. Select a database to open its drilldown.
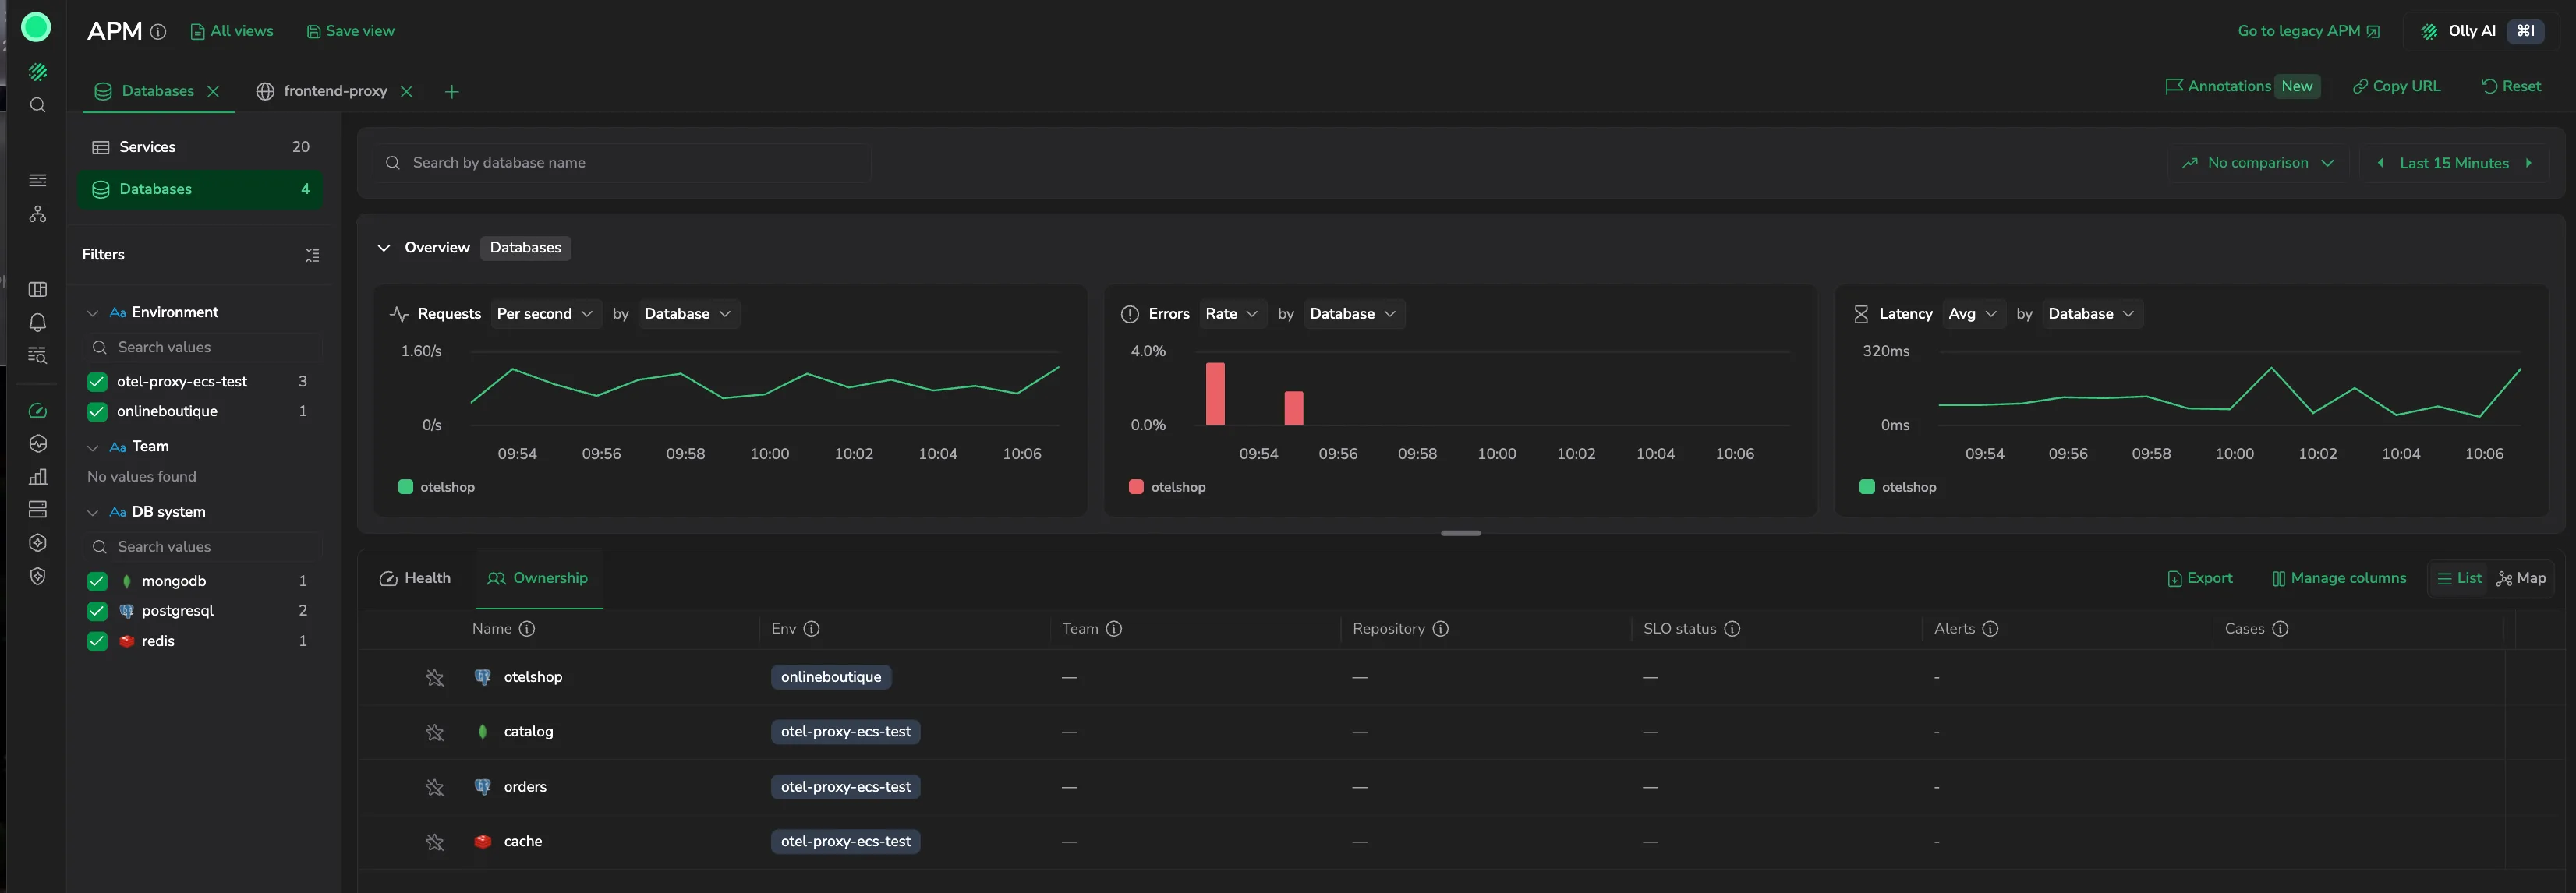
As in the Services catalog, switch the table between its Health view (performance columns) and its Ownership view (the owning Team, SLO status, alerts, and cases).
The database drilldown
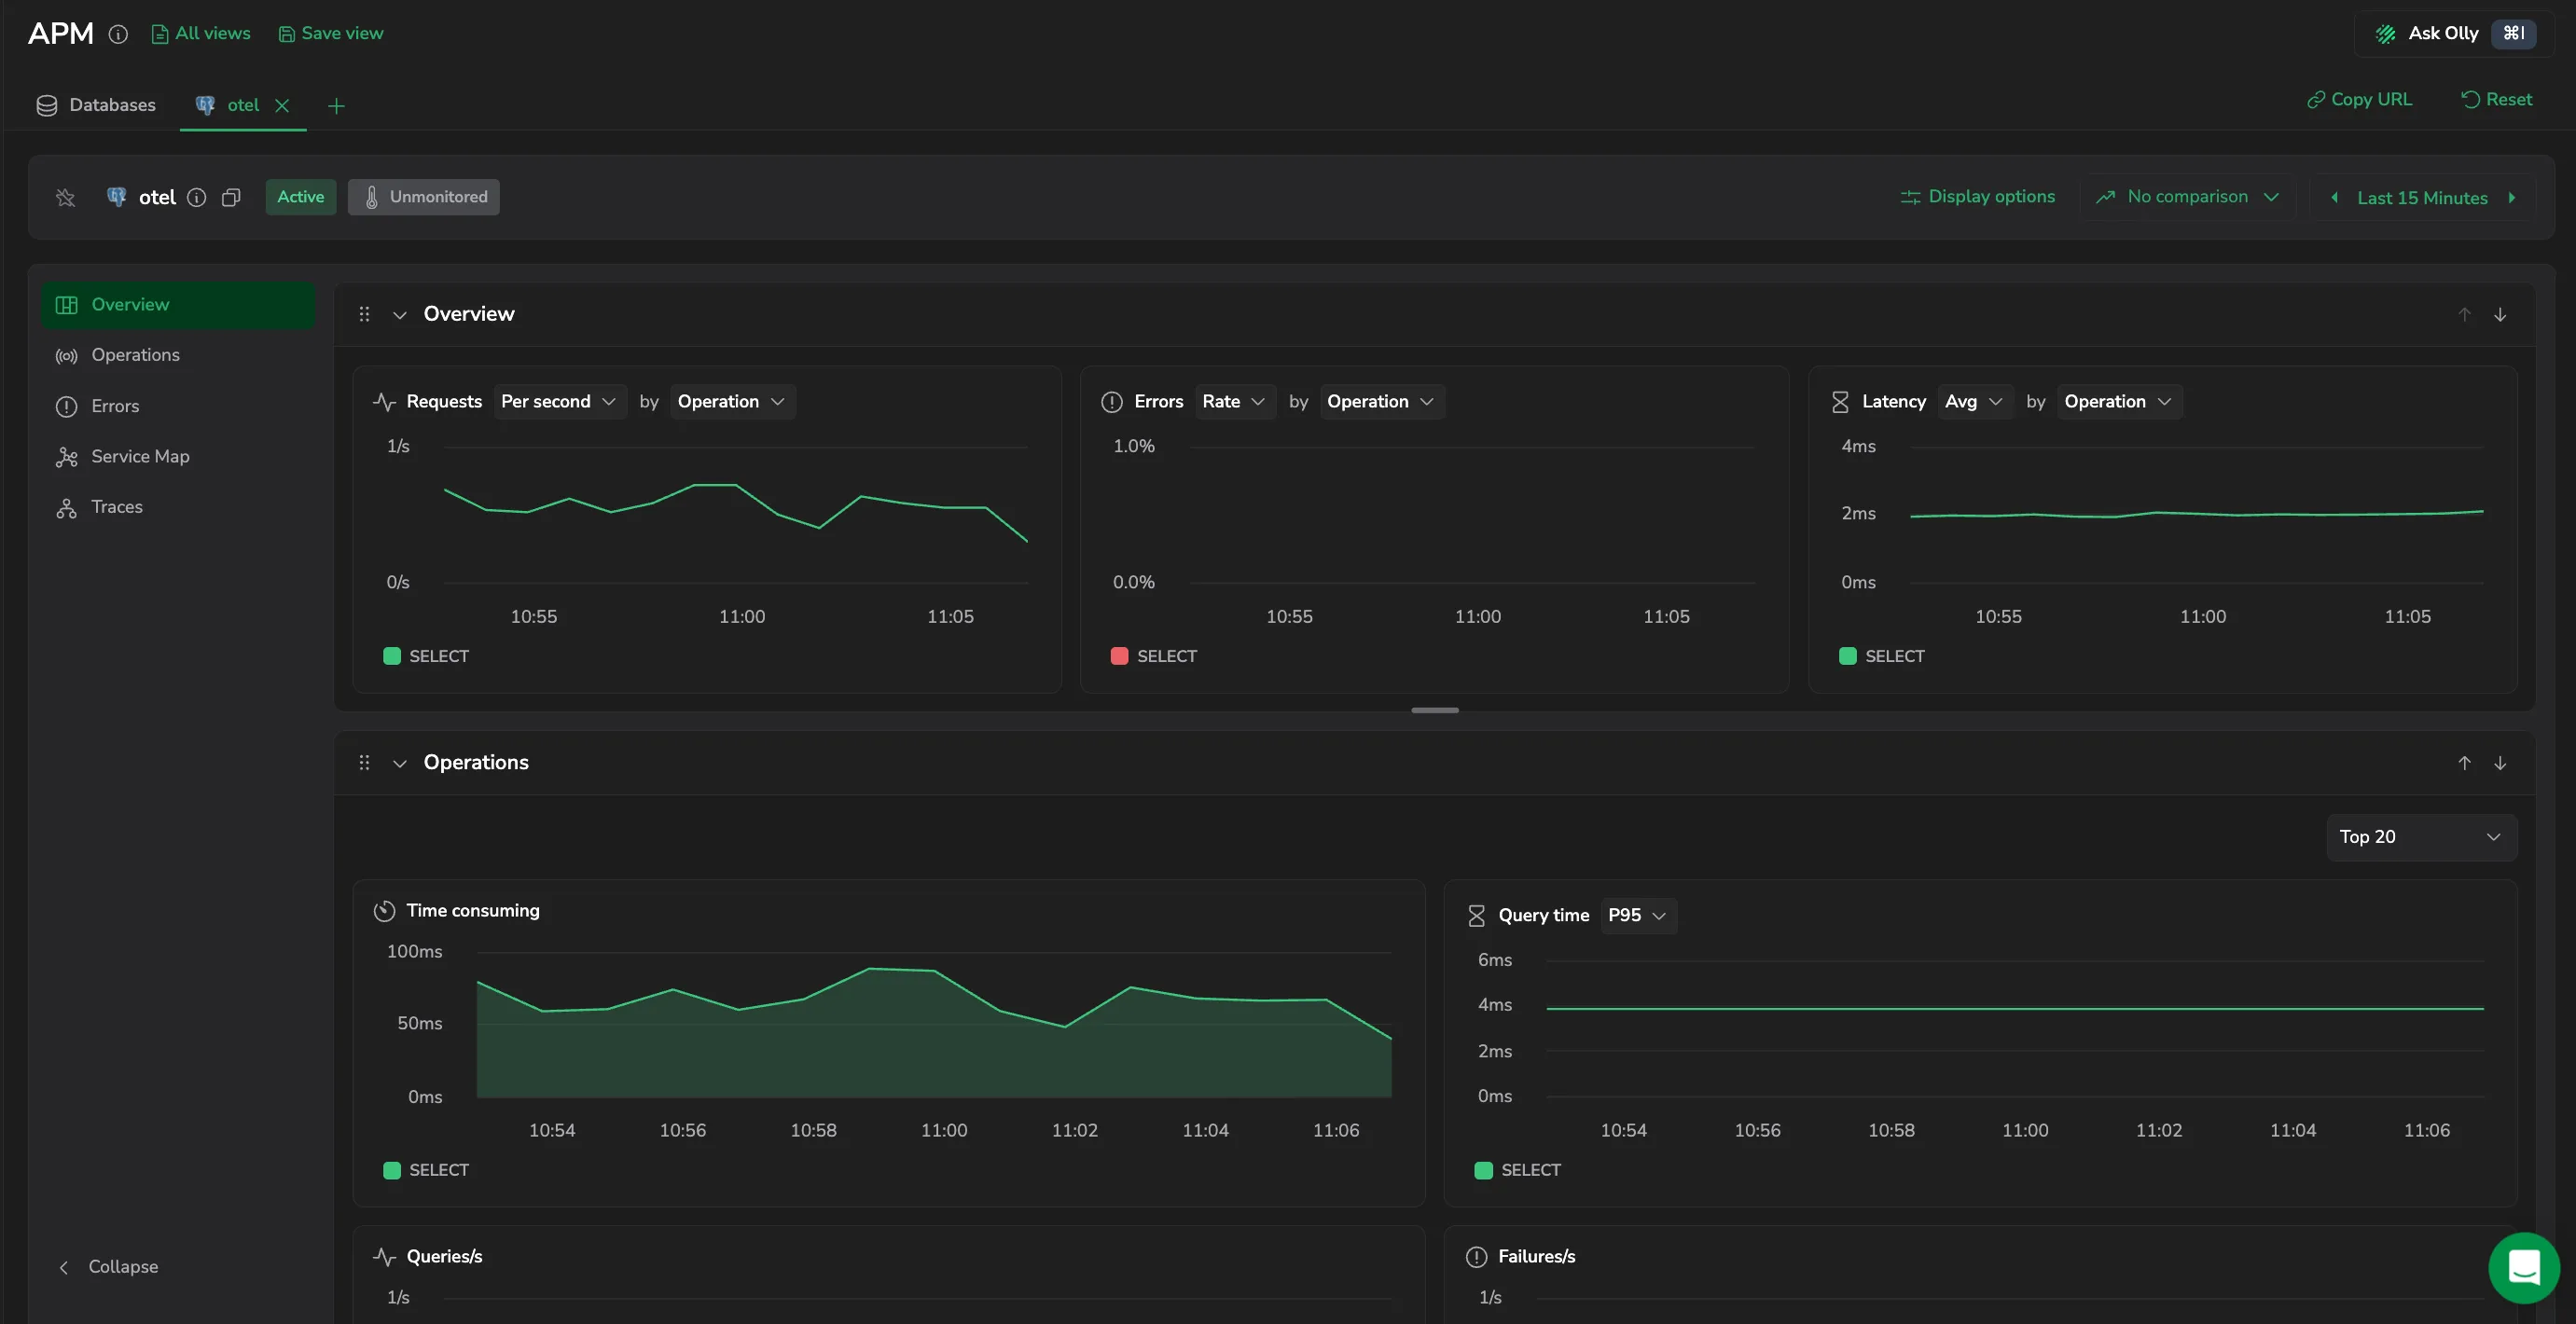
Databases expose a focused set of tabs:
- Overview: RED metrics for the database over the selected range.
- Operations: query performance per operation and table. See Operations.
- Errors: failed queries grouped for triage. See Errors.
- Traces: the spans and traces the database participates in. See Traces.
- Service map: the database's place in your dependency graph. See Service map.
Alerting
Create a metric alert from a database's overview charts: the More actions menu on a Requests, Errors, or Latency widget opens the alert editor prefilled from that metric and scoped to the database. The alert carries the database's APM labels, so it surfaces in the catalog's alerts column. See APM monitoring with alerts.
Olly AI
Select Olly AI in the APM header, or press Cmd+I / Ctrl+I, to open the Olly drawer scoped to what you're viewing - the databases in view on the catalog, or the database you've drilled into - so you can ask what's slowing a query or driving failures without describing your view first.
Next steps
Open a service or database to explore its telemetry in the entity drilldown.