Drill into an entity
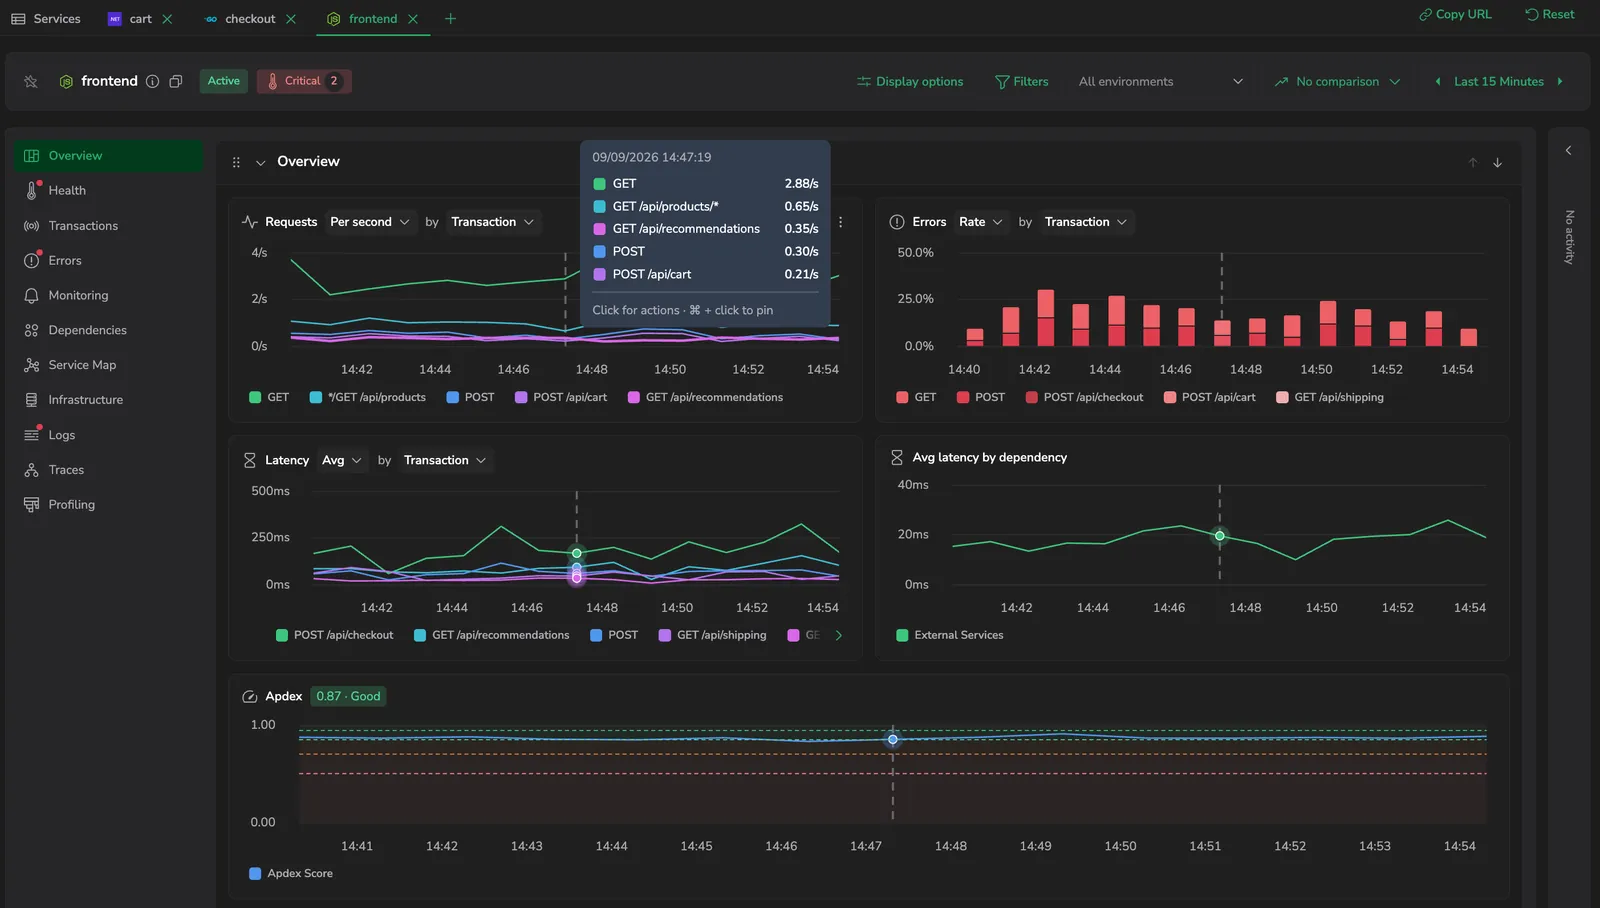
Select a service or database in the catalog to open its drilldown - one entity, with every signal APM has for it gathered into a single tabbed view. Start at the entity's overview and follow a health or latency signal into the transactions, traces, logs, and profiles behind it without leaving the entity.
Use it to:
- Go from symptom to cause: start at a RED chart or health signal and follow it into the transactions, errors, traces, logs, and profiles behind it, all for one entity.
- See an entity's full picture in one place: overview, health, errors, dependencies, and infrastructure without switching screens.
- Confirm what changed: line up a deployment or other event in the Activity timeline with a shift in the charts.
What you need
- Coralogix Application Performance Monitoring (APM) installed and configured.
- A service or database reporting to APM, opened from the catalog. Individual tabs may need their own data source: a tab with no data prompts you to set it up.
Header
The drilldown header identifies the entity and holds the controls that apply across every tab:

- Favorite: star the entity to mark it as a favorite.
- Copy name: copy the entity's name to the clipboard, from the header or from a row in the entity switcher.
- Entity switcher: switch to another entity without leaving the drilldown: Switch service or Switch database.
- Status badge: Active or Inactive, based on whether the entity reported data in the selected time range.
- Health pill (services): the entity's health - Healthy, Warning, Critical, or Unavailable - with a count of breached policies. Its issues tooltip lists the breaching policies and the tabs they belong to; select one to jump straight to that tab.
- Info tooltip: ownership, deployment, and data source status. It shows the owning team, the Last deployment, Environments - each environment's active or inactive state, health, and last-seen time - and Data sources, where each signal is marked Connected or Not sending.
- Filters and the environment filter (services): scope every tab to specific dimensions or environments. Each section shows which of these filters it applies, so you can tell, for example, when the environment filter doesn't reach a particular section.
- Compare to: overlay an earlier period so a delta appears next to each metric.
- Time picker: set the time range that every tab reads from.
- Display options (the menu after the time picker): control what the charts show, such as the Activity timeline and restart counts.
- Annotations: a dedicated toolbar control that overlays deployments, alerts, and other events on the charts. See Annotations.
Display options
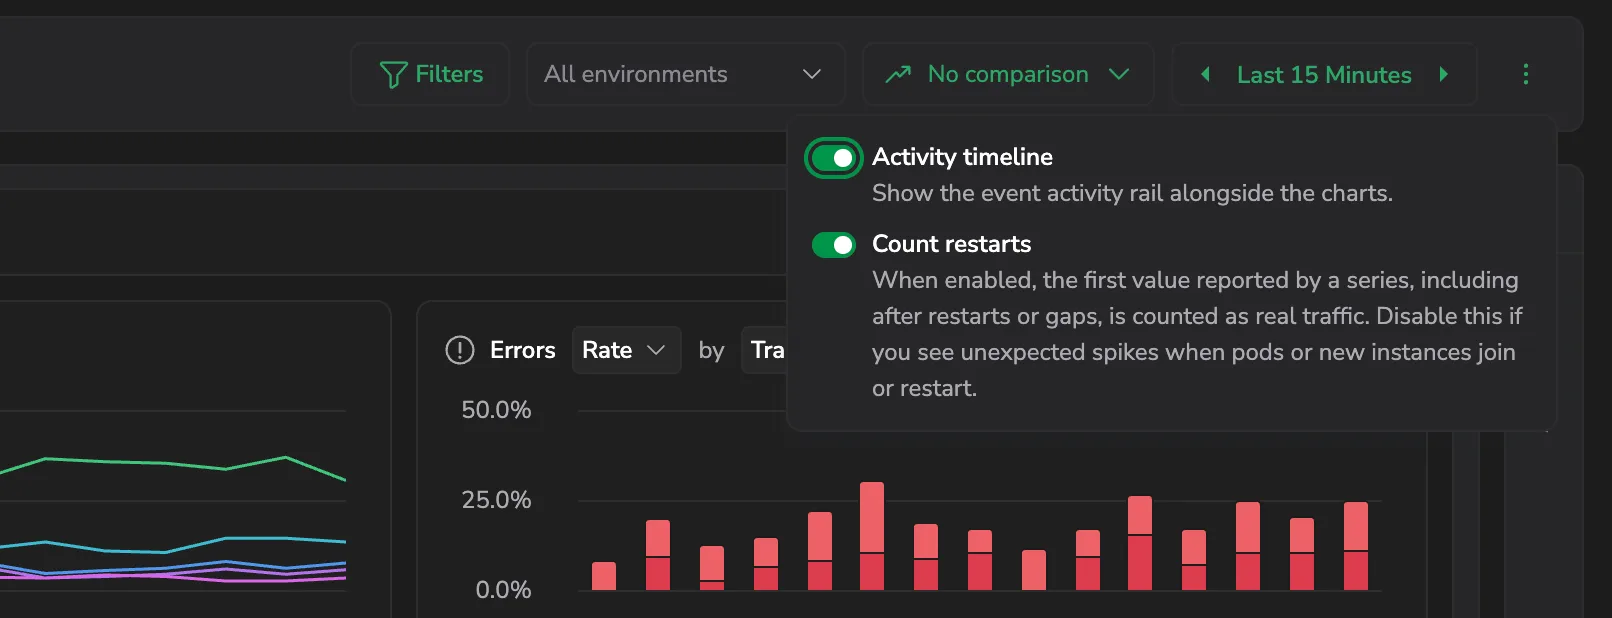
Select Display options - the menu after the time picker - to control what the charts show. The panel has two toggles:
- Activity timeline: show the event activity rail alongside the charts. Select an event on the rail to open its details drawer, where Time around the event (1h, 3h, 6h, or 12h total, centered on the event) scopes its impact charts.
- Count restarts: when enabled, the first value reported by a series, including after restarts or gaps, is counted as real traffic. Disable this if you see unexpected spikes when pods or new instances join or restart.
Environment filter
Scope the drilldown to specific deployment environments (for example, dev, staging, or prod). The environment filter is a top-level filter on the catalog and appears again, scoped to the current service, inside the drilldown.
Inside the drilldown, the environment filter:
- Offers only the environments the service reported spans in - not the catalog's full list.
- Carries your catalog selection over when you open a service, intersected with the service's environments; opening from an environment row pre-selects just that environment.
- Drops invalid selections when you switch services, defaulting to all of the new service's environments when none remain valid.
- Labels each environment Active or Inactive by whether it reported spans in the selected range, with a last-seen time for the inactive ones.
To populate environments, set the deployment.environment.name resource attribute on your spans - the Coralogix Helm chart does this from deploymentEnvironmentName with resourceDetection enabled. See Environment filter for the full configuration.
Tabs
The drilldown organizes everything it knows about the entity into tabs. Use the tab navigation to move between them, and collapse or expand the navigation for more room. Each tab can be collapsed in place (Collapse section / Expand section) and reordered (Move up / Move down), so you can arrange the drilldown around what you're investigating. A tab with no data shows "No data received. Set up the data source to see this section." and points you to its setup.
The table lists the tabs in their default order.
| Tab | Services | Databases | What it shows |
|---|---|---|---|
| Overview | Yes | Yes | RED metrics - requests, errors, and latency - plus an optional apdex score for services. |
| Health | Yes | - | The health policies that determine the entity's status. |
| Transactions | Yes | - | Performance per transaction - the requests the service serves. |
| Operations | - | Yes | Query performance per database operation - throughput, latency, and failures, broken down by table and calling service. |
| Errors | Yes | Yes | Failing requests and their occurrences. |
| Runtime | Yes | - | Runtime metrics for Java services. |
| Monitoring | Yes | - | SLOs, alerts, and cases linked to the entity. |
| Dependencies | Yes | - | Upstream and downstream calls, including database queries and external calls. |
| Service map | Yes | Yes | The entity's place in your service topology. |
| Infrastructure | Yes | - | The infrastructure resources the entity runs on. |
| Logs | Yes | - | Logs correlated to the entity. |
| Traces | Yes | Yes | Recent traces and spans for the entity. |
| Profiling | Yes | - | Profiles from Continuous Profiling. |
Databases expose exactly five tabs - Overview, Operations, Errors, Traces, and Service map. The rest apply to services, and database coverage is expanding.
Overview
The Overview tab summarizes the entity's golden signals over the selected time range as a set of cards:
- Requests: incoming request throughput, as requests per second or a total count.
- Errors: failed requests, as a rate, a total count, or errors per second.
- Latency: response time at the percentiles you select.
- Avg latency by dependency (services): the average time the service spent waiting on each dependency, per request, so you can see which backend contributes most to response time. Shown when the service has dependency data.
- Apdex (services): the service's apdex score and rating - Excellent, Good, Fair, Poor, or Unacceptable - against its configured latency threshold. Apdex is a service-level score, so it needs server spans and never appears for databases.
Each card carries its own controls:
- Group by the series: None, Environment, Version, Transaction, Operation, Status code, or Dependency.
- Switch the Chart type (Area, Bar, Line) and Scale (Linear, Logarithmic).
- Open Full view to expand the card, View query to see the underlying query, or Open in Metrics Explorer to continue there.
The percentile selector appears on the Latency card only, and it is multi-select - choose any of Avg, P50, P75, P90, P95, and P99 to plot several latency lines at once. When Compare to is on, each card overlays the previous period so you can read the change.
The Apdex card shows the score and rating. Open Apdex details to see the satisfied, tolerating, and frustrated buckets over time and to tune the Apdex threshold - the response time the service is expected to answer within. A new threshold applies to new data only.
Operations
Databases expose an Operations tab in place of Transactions - it breaks the database down by operation so you can find the slowest or busiest and see which services call them. See Operations.
Olly AI
Select Olly AI in the header, or press Cmd+I / Ctrl+I, to open the Olly drawer scoped to the entity you're drilled into, so you can ask what's driving its errors or latency without describing your view first.
Next steps
Continue with the entity's Service health policies - the signals that set its status across the catalog and the drilldown.