Annotations
Annotations overlay deployments, alerts, feature-flag changes, campaigns, and configuration changes on your APM charts, so you can line a latency spike or error surge up with the change that caused it. Every dated change sits on the same timeline as your metrics, so you can answer "what changed?" on the chart itself, without switching tools.
Use it to:
- Confirm whether a deploy caused a regression: Line a deployment annotation up with the moment error rate or latency shifted to see whether the release is the culprit.
- Rule a config change in or out: Check whether a configuration-change annotation sits at the start of a spike before you look elsewhere for the trigger.
- Correlate a campaign with a traffic surge: Overlay campaign annotations on throughput to see which push drove the extra load.
What you need
- Access to APM and the service you want to analyze.
- Events ingested through the Coralogix ops-events ingest API - these appear as annotations on your charts. See Send events to Coralogix.
Turn on annotations
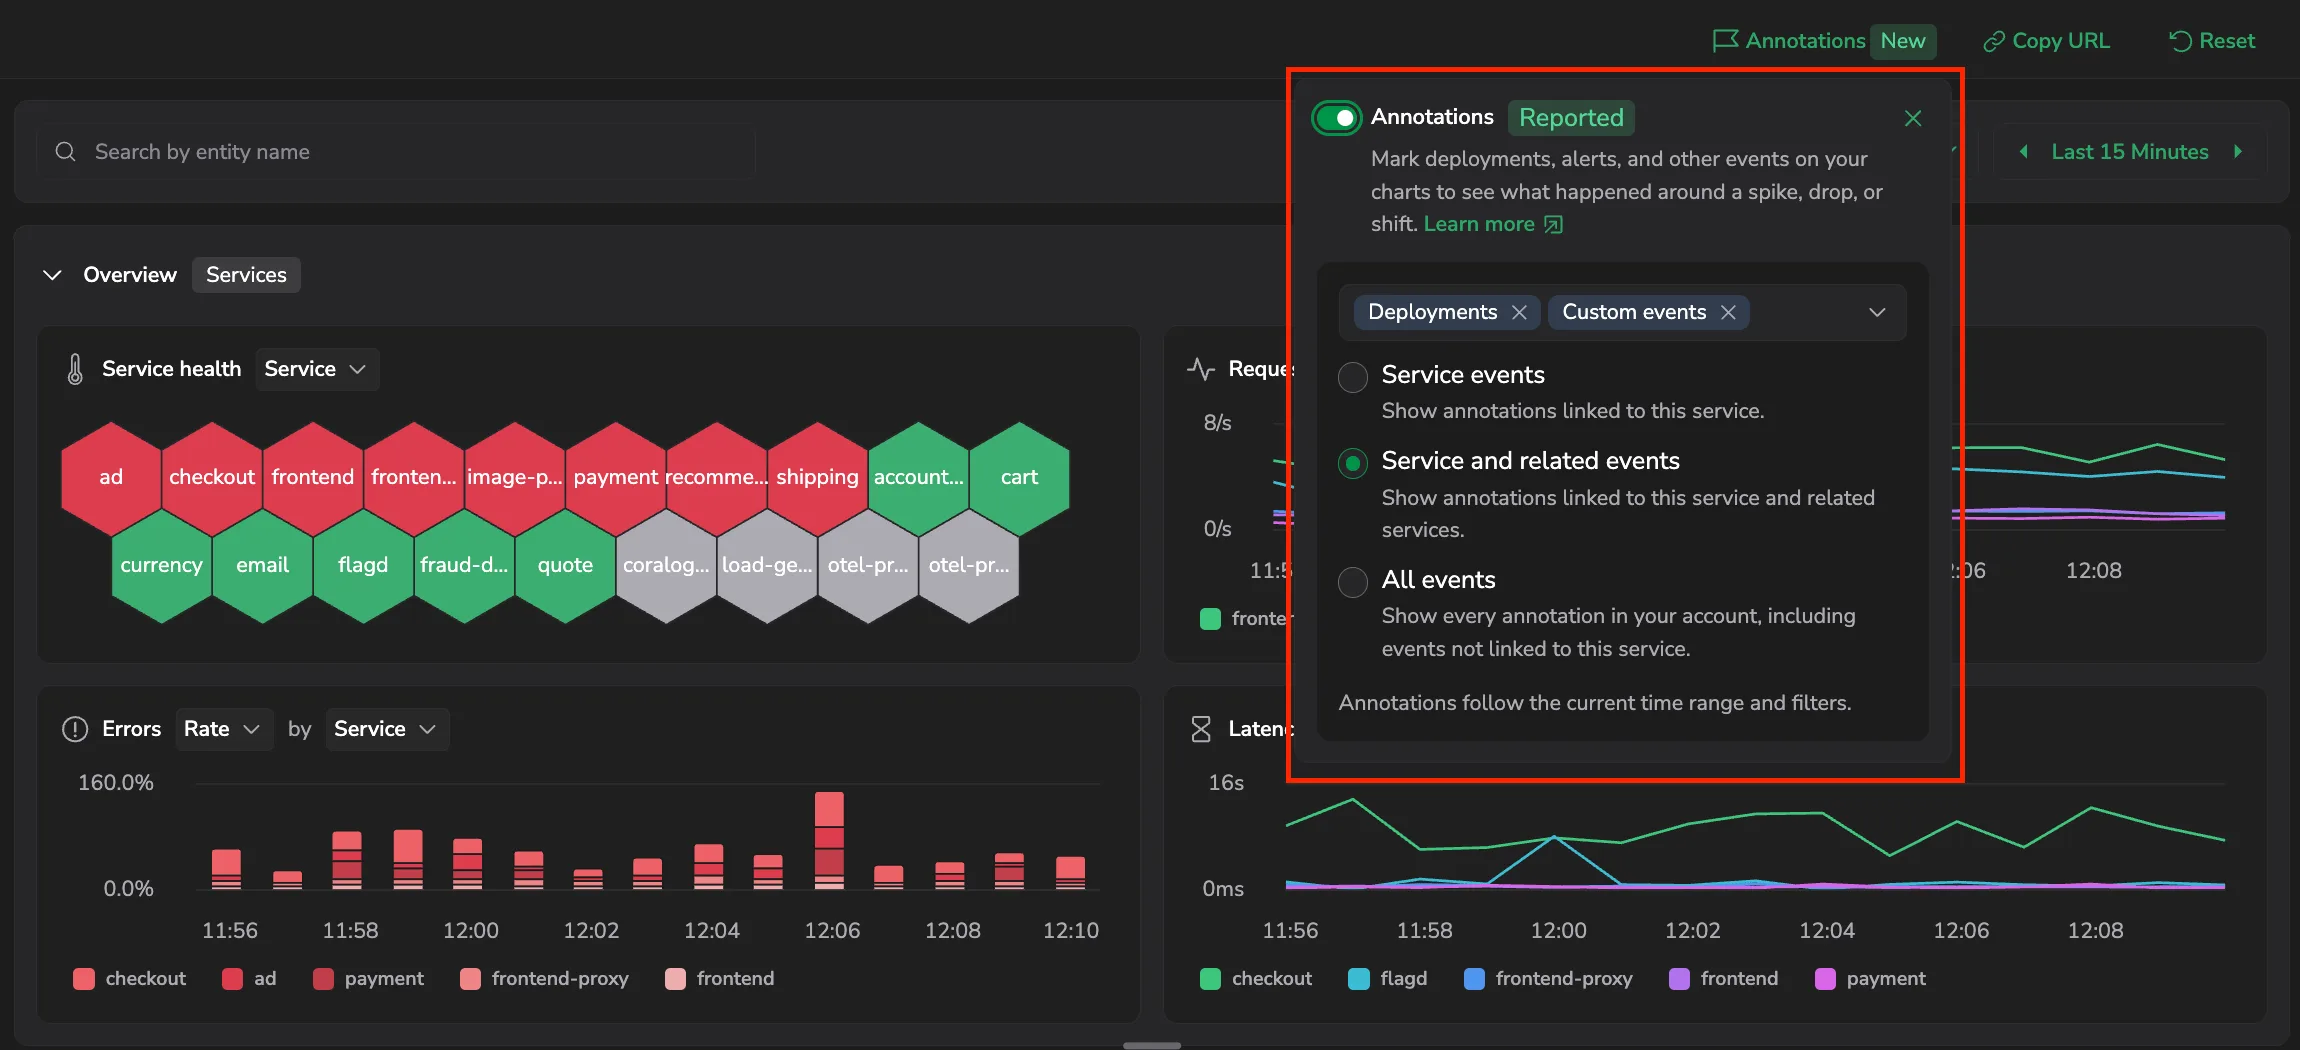
Annotations appear on the overview charts in the catalog and on the charts in an entity drilldown. Each of these charts has its own Annotations control on the toolbar; open it to show them. The first time, a short introduction (Annotations on your charts) explains the layer - select Got it to dismiss it. When annotations are on, the control carries a Reported badge, and the setting persists across sessions.
The Annotations panel has two settings:
- Annotation types to show: select which types appear - Deployments and Custom events (alerts, feature flags, campaigns, and configuration changes). Select at least one type; with none selected, the panel reads No types selected and no annotations draw.
- Which events to show: set the scope - Service events, Service and related events, or All events (see Select which events appear).
Annotations follow the current time range and filters.
Annotations appear as vertical lines across the charts, aligned to event timestamps. Hover an annotation to see its details - the source system, the event description, and the service and environment it applies to - and to open its actions. These include Explore Logs to jump to the logs around that event and, for deployment events, Open pipeline run, Open repository, Open in the source system, and Copy commit SHA, Copy pipeline name, or Copy branch/tag name. When several events fall in the same time bucket, the hover shows one with a count (N events at this time) and a +N more line; Cmd/Ctrl-click to pin the tooltip and read the full list.
Select which events appear
In the Annotations panel, Which events to show sets the scope:
- Service events: annotations linked to the service you're analyzing.
- Service and related events: annotations linked to this service and its related services. See Related services.
- All events: every annotation in your account. Events without a
service.name- for example, account-wide incidents, marketing campaigns, or feature-flag changes - appear only in this scope, alongside every service's deployment events.
Annotation types on the chart
On the chart, Coralogix draws each annotation type in its own color, with a matching dashed entry in the chart legend. Deployments sent as cdEvent are grouped together, and custom events sent as customEvent form their own group. Only types with events in the current time range appear. Use Annotation types to show in the Annotations panel to pick which types draw.
Send events to Coralogix
Send events through the Coralogix ops-events ingest API; they appear as annotations on your charts. Coralogix stores each event as an opsEvents entity in the default/ops.events dataset, so you can set that dataset as the source in Explore to view your events as a table and query them with DataPrime.

The API is available both as gRPC and as REST (HTTP transcoding):
- REST:
POST /v1/ops-events - gRPC:
com.coralogixapis.opsevents.v1.OpsEventsIngestService/CreateOpsEvent
Authenticate with a Coralogix api_key_v2 in the Authorization header: Authorization: Bearer <api_key_v2>.
Request body
Wrap each event in an opsEvent object:
{
  "opsEvent": {
    "timestamp": "…",
    "description": "…",
    "attributes": { … },
    "cdEvent": { … }
  }
}
Minimum required fields
timestamp: RFC 3339 timestamp for when the event happened. It must be within 24 hours of the current server time: the API rejects events dated more than 24 hours in the past or future, so send events as the deploy happens rather than backfilling older ones.description: a short, human-readable summary of the event, shown on hover in the UI. Must not be empty.- An event object: you must include one: either
cdEventfor CI/CD deploys orcustomEventfor a generic event. More typed kinds are added over time.
Fields that unlock filtering and correlation
Add these to route the event to the right filters and to make the annotation useful in the UI:
attributes.service.name: links the event to a service. Events without this attribute appear only in the All events scope.attributes.environment: scopes the event to an environment (for example,production,staging).cdEvent.system: the CI/CD system that produced the event. One ofCD_SYSTEM_GITHUB,CD_SYSTEM_ARGOCD,CD_SYSTEM_JENKINS,CD_SYSTEM_GITLAB,CD_SYSTEM_BITBUCKET,CD_SYSTEM_AZURE_DEVOPS,CD_SYSTEM_SPINNAKER.cdEvent.pipeline.name: pipeline name shown on hover.cdEvent.pipeline.run.id,cdEvent.pipeline.run.url: run identifier and deep link to the pipeline run.cdEvent.pipeline.run.durationSeconds: how long the pipeline run took, in seconds.cdEvent.pipeline.result.status: one ofPIPELINE_RESULT_STATUS_SUCCESS,_FAILURE,_TIMEOUT,_CANCELLATION,_ERROR,_SKIP.cdEvent.pipeline.task.name,cdEvent.pipeline.task.type: task identifier and kind (PIPELINE_TASK_TYPE_BUILD,_TEST,_DEPLOY).cdEvent.vcs.system,cdEvent.vcs.type: version control provider (VCS_SYSTEM_GITHUB,_GITLAB,_BITBUCKET) and reference kind (VCS_REF_TYPE_BRANCH,_TAG).cdEvent.vcs.repository.name,cdEvent.vcs.repository.url: repository name and clickable link.cdEvent.vcs.ref.head.name,cdEvent.vcs.ref.head.revision: branch or tag name and commit hash.
For events that do not describe a CD pipeline - account-wide incidents, marketing campaigns, feature-flag changes - send a customEvent instead of a cdEvent. A customEvent carries no fields of its own: put the summary in description and any structured data under attributes.additional. As with any event, one sent without attributes.service.name is visible only in the All events scope.
Stored events strip the enum prefix - CD_SYSTEM_ARGOCD becomes argocd, PIPELINE_RESULT_STATUS_SUCCESS becomes success, and so on - so DataPrime queries against default/ops.events filter on the lowercase form.
Example - send a deployment event
Send this with a current timestamp - the API rejects events dated more than 24 hours from the server time:
curl -X POST https://api.<coralogix-domain>/v1/ops-events \
  -H "Authorization: Bearer $CX_API_KEY" \
  -H "Content-Type: application/json" \
  -d '{
    "opsEvent": {
      "timestamp": "2026-07-13T10:15:00Z",
      "description": "payments-api v2.14.0 deployed to production",
      "attributes": {
        "service": { "name": "payments-api" },
        "environment": "production"
      },
      "cdEvent": {
        "system": "CD_SYSTEM_GITHUB",
        "pipeline": {
          "name": "deploy-production",
          "run": {
            "id": "9753949763",
            "url": "https://github.com/org/payments/actions/runs/9753949763",
            "durationSeconds": 145
          },
          "result": { "status": "PIPELINE_RESULT_STATUS_SUCCESS" },
          "task": { "name": "deploy-to-production", "type": "PIPELINE_TASK_TYPE_DEPLOY" }
        },
        "vcs": {
          "system": "VCS_SYSTEM_GITHUB",
          "type": "VCS_REF_TYPE_BRANCH",
          "repository": {
            "name": "payments-platform",
            "url": "https://github.com/org/payments-platform"
          },
          "ref": {
            "head": {
              "name": "main",
              "revision": "abc123def456789abcdef0123456789abcdef01"
            }
          }
        }
      }
    }
  }'
A successful request returns the server-generated event id.
Example - send a custom event
A custom event needs only a current timestamp, a description, and an empty customEvent object. Attach any structured data under attributes.additional:
curl -X POST https://api.<coralogix-domain>/v1/ops-events \
  -H "Authorization: Bearer $CX_API_KEY" \
  -H "Content-Type: application/json" \
  -d '{
    "opsEvent": {
      "timestamp": "2026-07-13T13:45:00Z",
      "description": "quarterly feature flag rollout started",
      "attributes": {
        "environment": "production",
        "additional": { "flag": "new-billing-ui", "rolloutPercent": 25 }
      },
      "customEvent": {}
    }
  }'
This event has no attributes.service.name, so it appears only in the All events scope.
Send events from your CI/CD pipeline
Each of these guides has a ready-to-use step or configuration that sends a deployment event on every run:
Each guide sends a cdEvent with the matching cdEvent.system value.
For the full schema, per-language SDK examples, and Terraform provider usage, see the ops-events ingest API reference in the developer portal (in progress).
Related services
A related service is a service that sends requests to the current service or receives requests from it. Coralogix derives the set from the Service map.
When you select Service and related events, the scope includes:
- The current service: the service you're analyzing.
- Every service in that service's Service map neighborhood.
This scope shows a n services button that opens those related services in the Service map.
Limitations
- Annotations support two event kinds today:
cdEventfor continuous-delivery events (with pipeline and VCS metadata) andcustomEventfor generic events. Both appear on charts; onlycdEventcarries the CD-specific fields. More structured kinds are added over time.
Related resources
- Service map: how Coralogix builds the service dependency graph that defines related services.
- Group by service version: compare metrics across the deployments an annotation represents.
- OpenTelemetry CI/CD semantic conventions: the OTel conventions that inspired the
cdEventfield names.
Next steps
Monitor your AWS Lambda functions in Serverless monitoring.