Apdex score
Overview
Apdex (Application Performance Index) is a standardized metric that measures user satisfaction with a service's response time. It condenses a full latency distribution into a single score from 0 to 1, where 1 means every request felt fast and 0 means every request was slow or failed.
Use it to:
- Turn raw latency into one number: give your team and your stakeholders a single, standardized score to track user satisfaction and compare it across services and over time.
- Set a per-service expectation: define the response time you consider acceptable for a service through its threshold, then measure real traffic against that target.
- Feed the health model: let Apdex contribute to a service's overall state through the Apdex health policy.
How it works
Apdex is derived from a single target threshold, T, that represents the response time you consider acceptable for a service. Every request falls into one of three categories:
- Satisfied: answered in T or less.
- Tolerating: answered in more than T but no more than 4T.
- Frustrated: slower than 4T, or errored regardless of how fast it returned.
Satisfied requests count in full and tolerating requests count as half:
Apdex = (satisfied + tolerating / 2) / total requests
For example, with a threshold of 2 seconds, a request answered within 2 seconds is satisfied, one answered in 2 to 8 seconds is tolerating, and anything slower than 8 seconds - or any errored request - is frustrated.
Coralogix maps the resulting score to five quality ratings:
| Rating | Score |
|---|---|
| Excellent | 0.94-1 |
| Good | 0.85-0.94 |
| Fair | 0.7-0.85 |
| Poor | 0.5-0.7 |
| Unacceptable | Below 0.5 |
Apdex in APM
Apdex applies to services that report server (incoming) spans. APM surfaces it in three places:
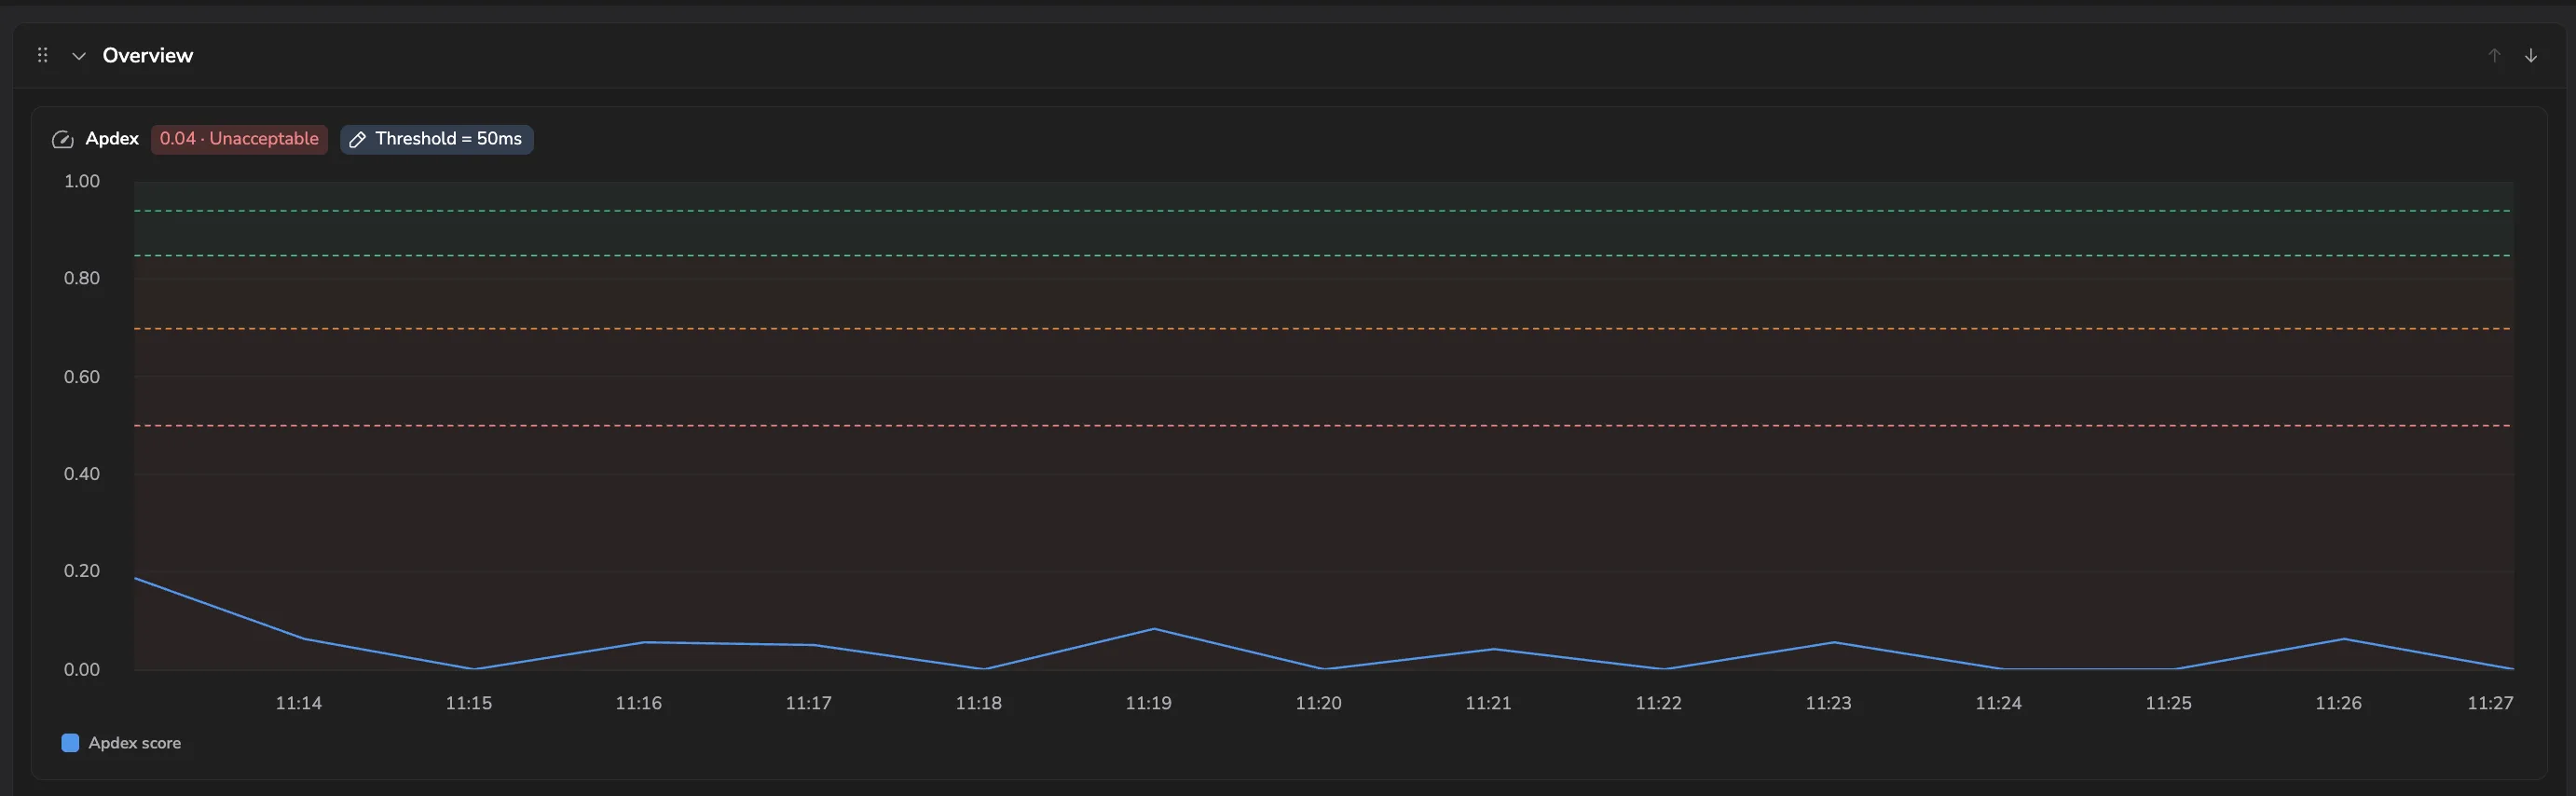
- Apdex card: on a service's Overview, the Apdex card charts the score over your selected timeframe on a fixed 0 to 1 axis, with the quality bands shaded behind the line so you can read the rating at a glance. A Threshold = value pill on the card opens the Apdex threshold editor. Click a point on the trend to open the Apdex details; hold ⌘ (or Ctrl) and click to pin the tooltip.
- Apdex health policy: Apdex feeds a service's overall health state through a dedicated health policy, so a drop in satisfaction surfaces alongside the service's other signals.
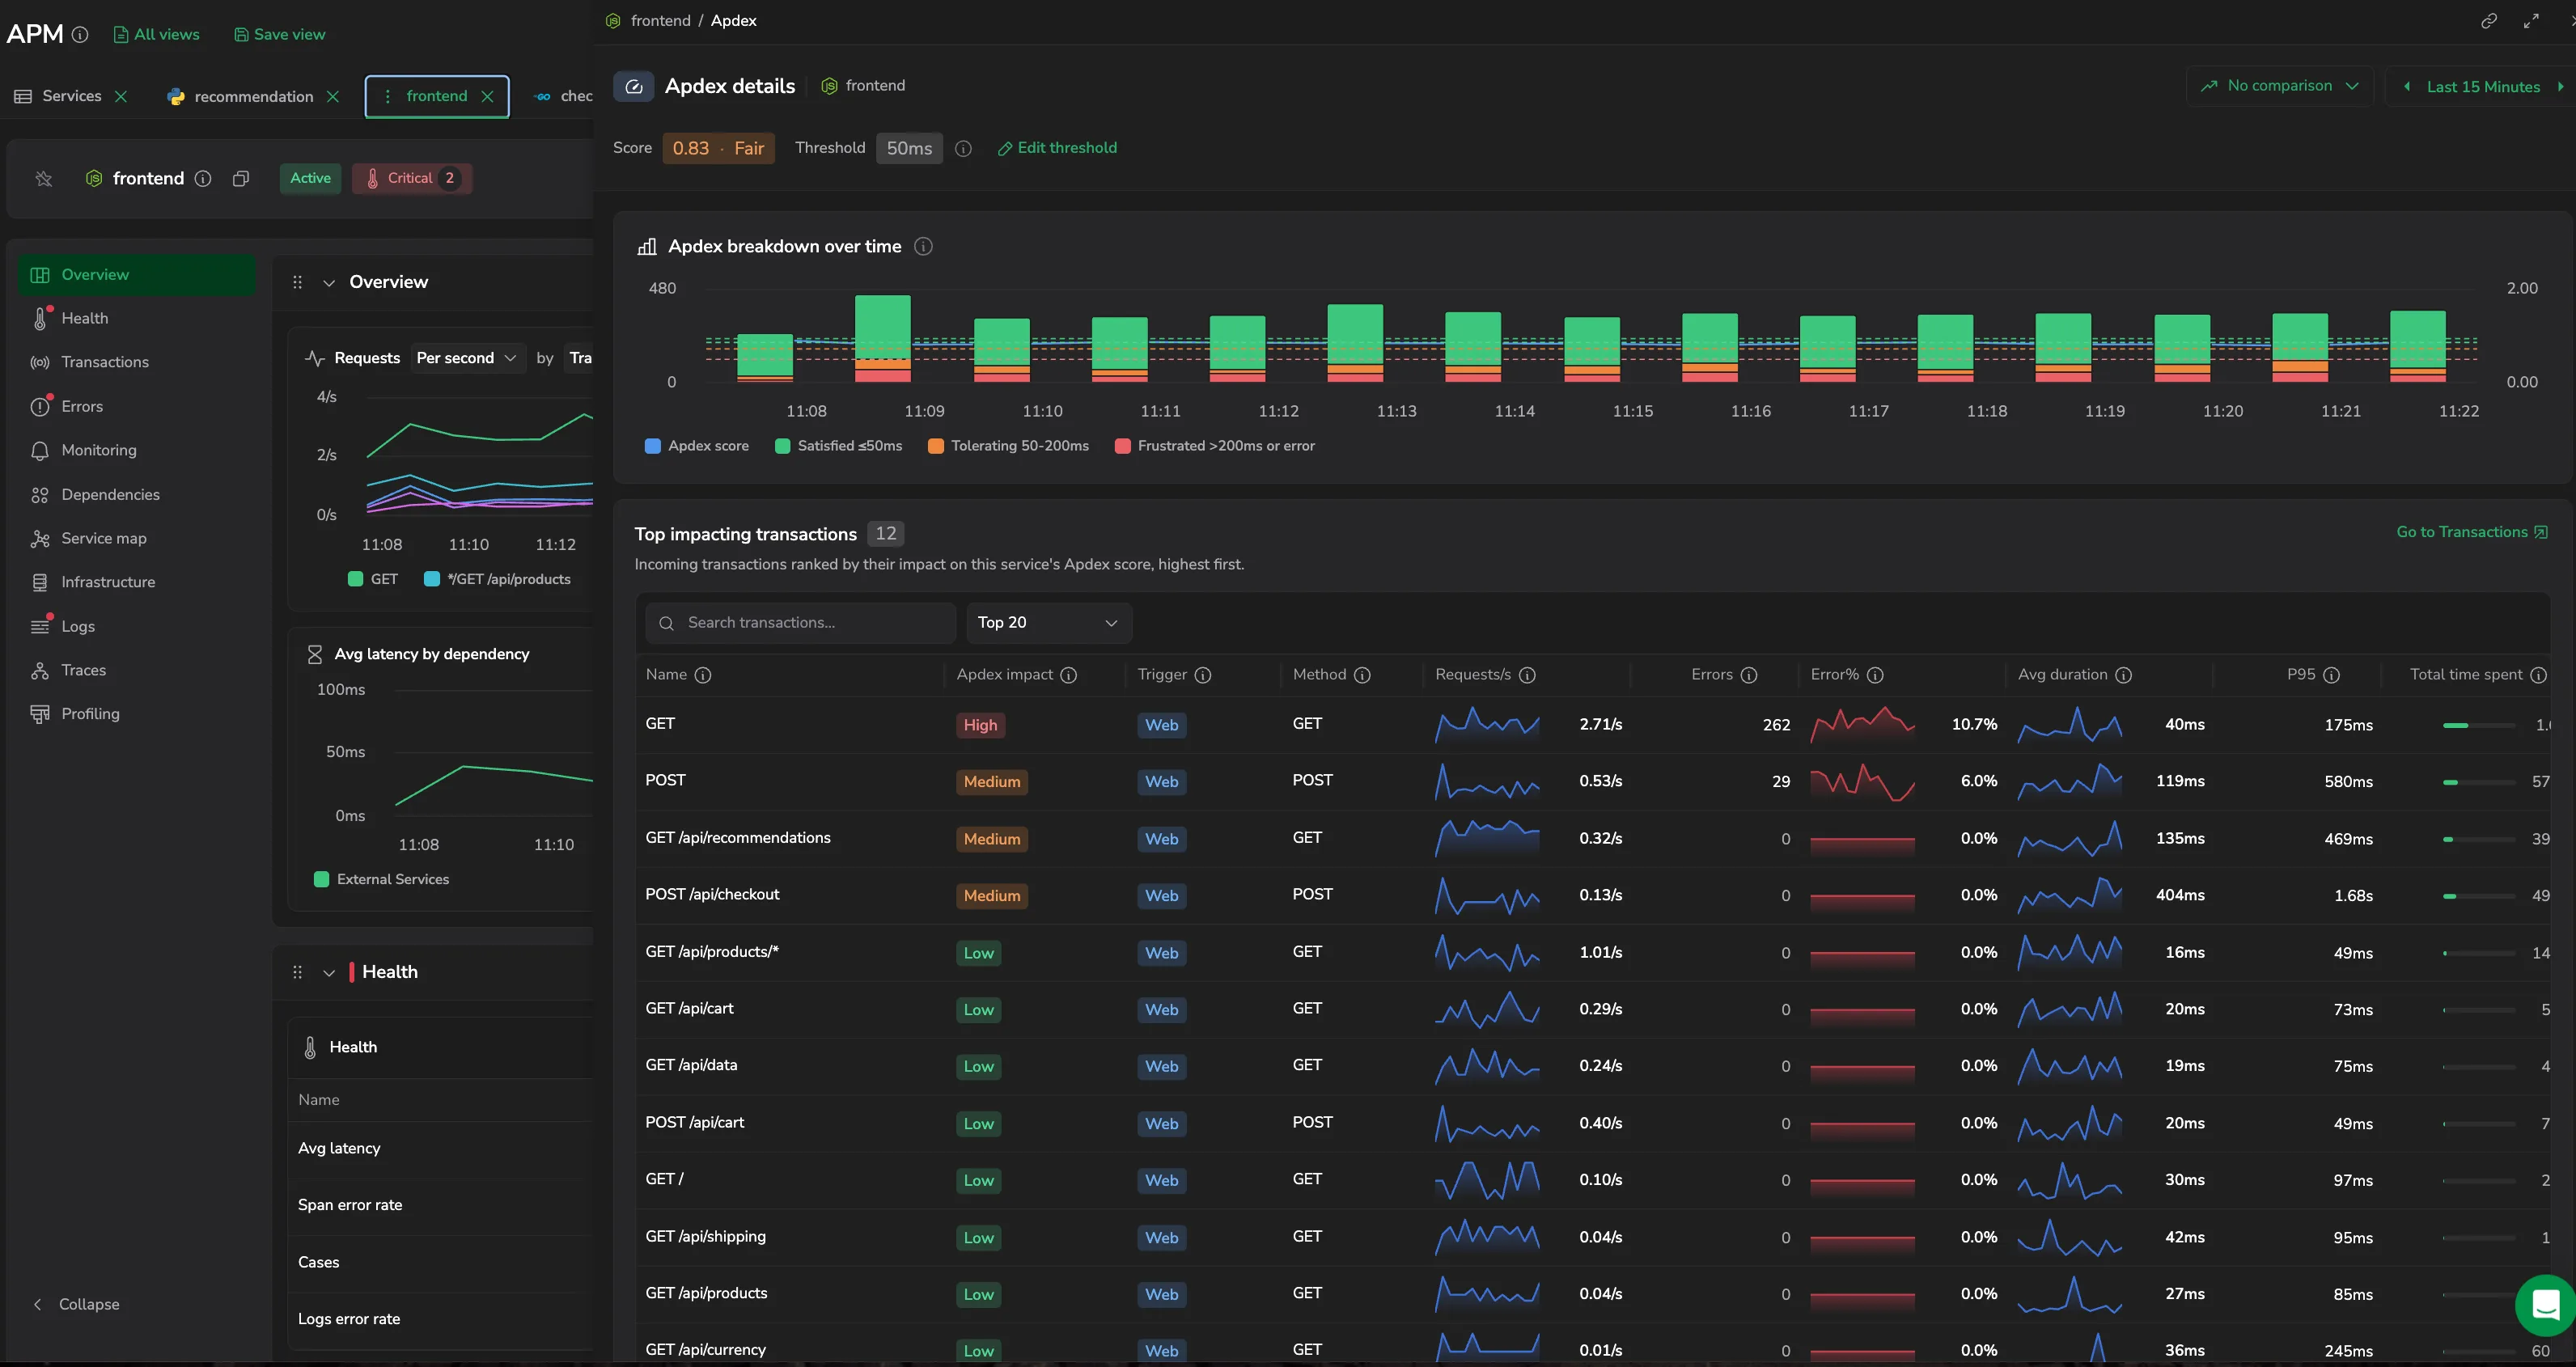
- Apdex details panel: open the panel from the Apdex card to review the score over time and the operations dragging it down, and to edit the threshold. See Apdex details panel.
Apdex details panel
Select Apdex details on a service's Apdex card to investigate the score. The panel opens over the drilldown and follows the same time range and comparison. Use Copy link in the panel toolbar to share a direct link to it; the panel and the threshold editor also restore from the URL when you reload.
At the top it shows the current Score and rating and the Threshold it is measured against. Select Edit threshold to open the Apdex threshold editor, which lets you try a threshold before saving it:
- Effect on this service: for a candidate threshold, the editor scores what the service would rate at that threshold against its current score, and shows the Satisfied / Tolerating / Frustrated split of requests at that value.
- Account default or override: a service either uses the account default (Using the account default) or overrides it (Overrides the account default); Reset to default returns it to the account value.
- Latency vs. threshold: a percentile chart with a draggable handle for setting the threshold against the service's real latency. The threshold is chosen from the service's recorded latency buckets.
- Apdex formula: the editor shows the Apdex formula in a panel of its own, so you can see how the threshold drives the score as you try values.
On first setup, the editor pre-fills a suggested default threshold - you can save it as-is without changing anything.
Saving closes the editor and confirms the threshold it wrote. A changed threshold applies only to data received after the change - scores already recorded are not recalculated.
- Apdex breakdown over time: a bar chart of how many requests fell into each satisfaction bucket over the selected range, so you can watch the mix shift. A Stacked / Individual toggle in the chart header switches between stacking the three buckets into one bar per interval and drawing them as separate bars; it opens on Stacked, and your choice travels in the panel's link, so a shared or saved view reopens the chart the same way. The legend labels the buckets against the current threshold - for a 0.5s threshold, Satisfied ≤500ms, Tolerating 500-2000ms, and Frustrated >2000ms or error. The Apdex score is drawn on a secondary axis fixed from 0 to 1, so you can read the bucket mix and the resulting score together. Event markers (annotations) appear on the chart, so you can line up a shift in the mix with a deployment or other event.
- Top impacting transactions: the transactions with the largest impact on the service's Apdex, sorted worst-first. Each row shows the operation's Name, its Apdex impact, the Trigger and Method, Requests and their trend, and Errors and the error-rate trend. Use Search operations to find one by name, the Top N selector to limit the table to the highest-impact operations, and select a row to open its transaction drilldown. Select Go to Transactions to open the full Transactions tab.
When Apdex cannot be calculated
Apdex is computed from your span metrics' latency histogram, so the score exists only when the histogram includes buckets at both the threshold (le=T) and its 4× counterpart (le=4T). If either bucket is missing, the Apdex card cannot run the calculation and shows an empty state in place of a score.
To resolve this, configure your collector so both T and 4T are present in the bucket list. For the full setup, see Apdex settings under Span Metrics configuration.
Next steps
Overlay deployments and configuration changes on your charts with Annotations.