Dependencies
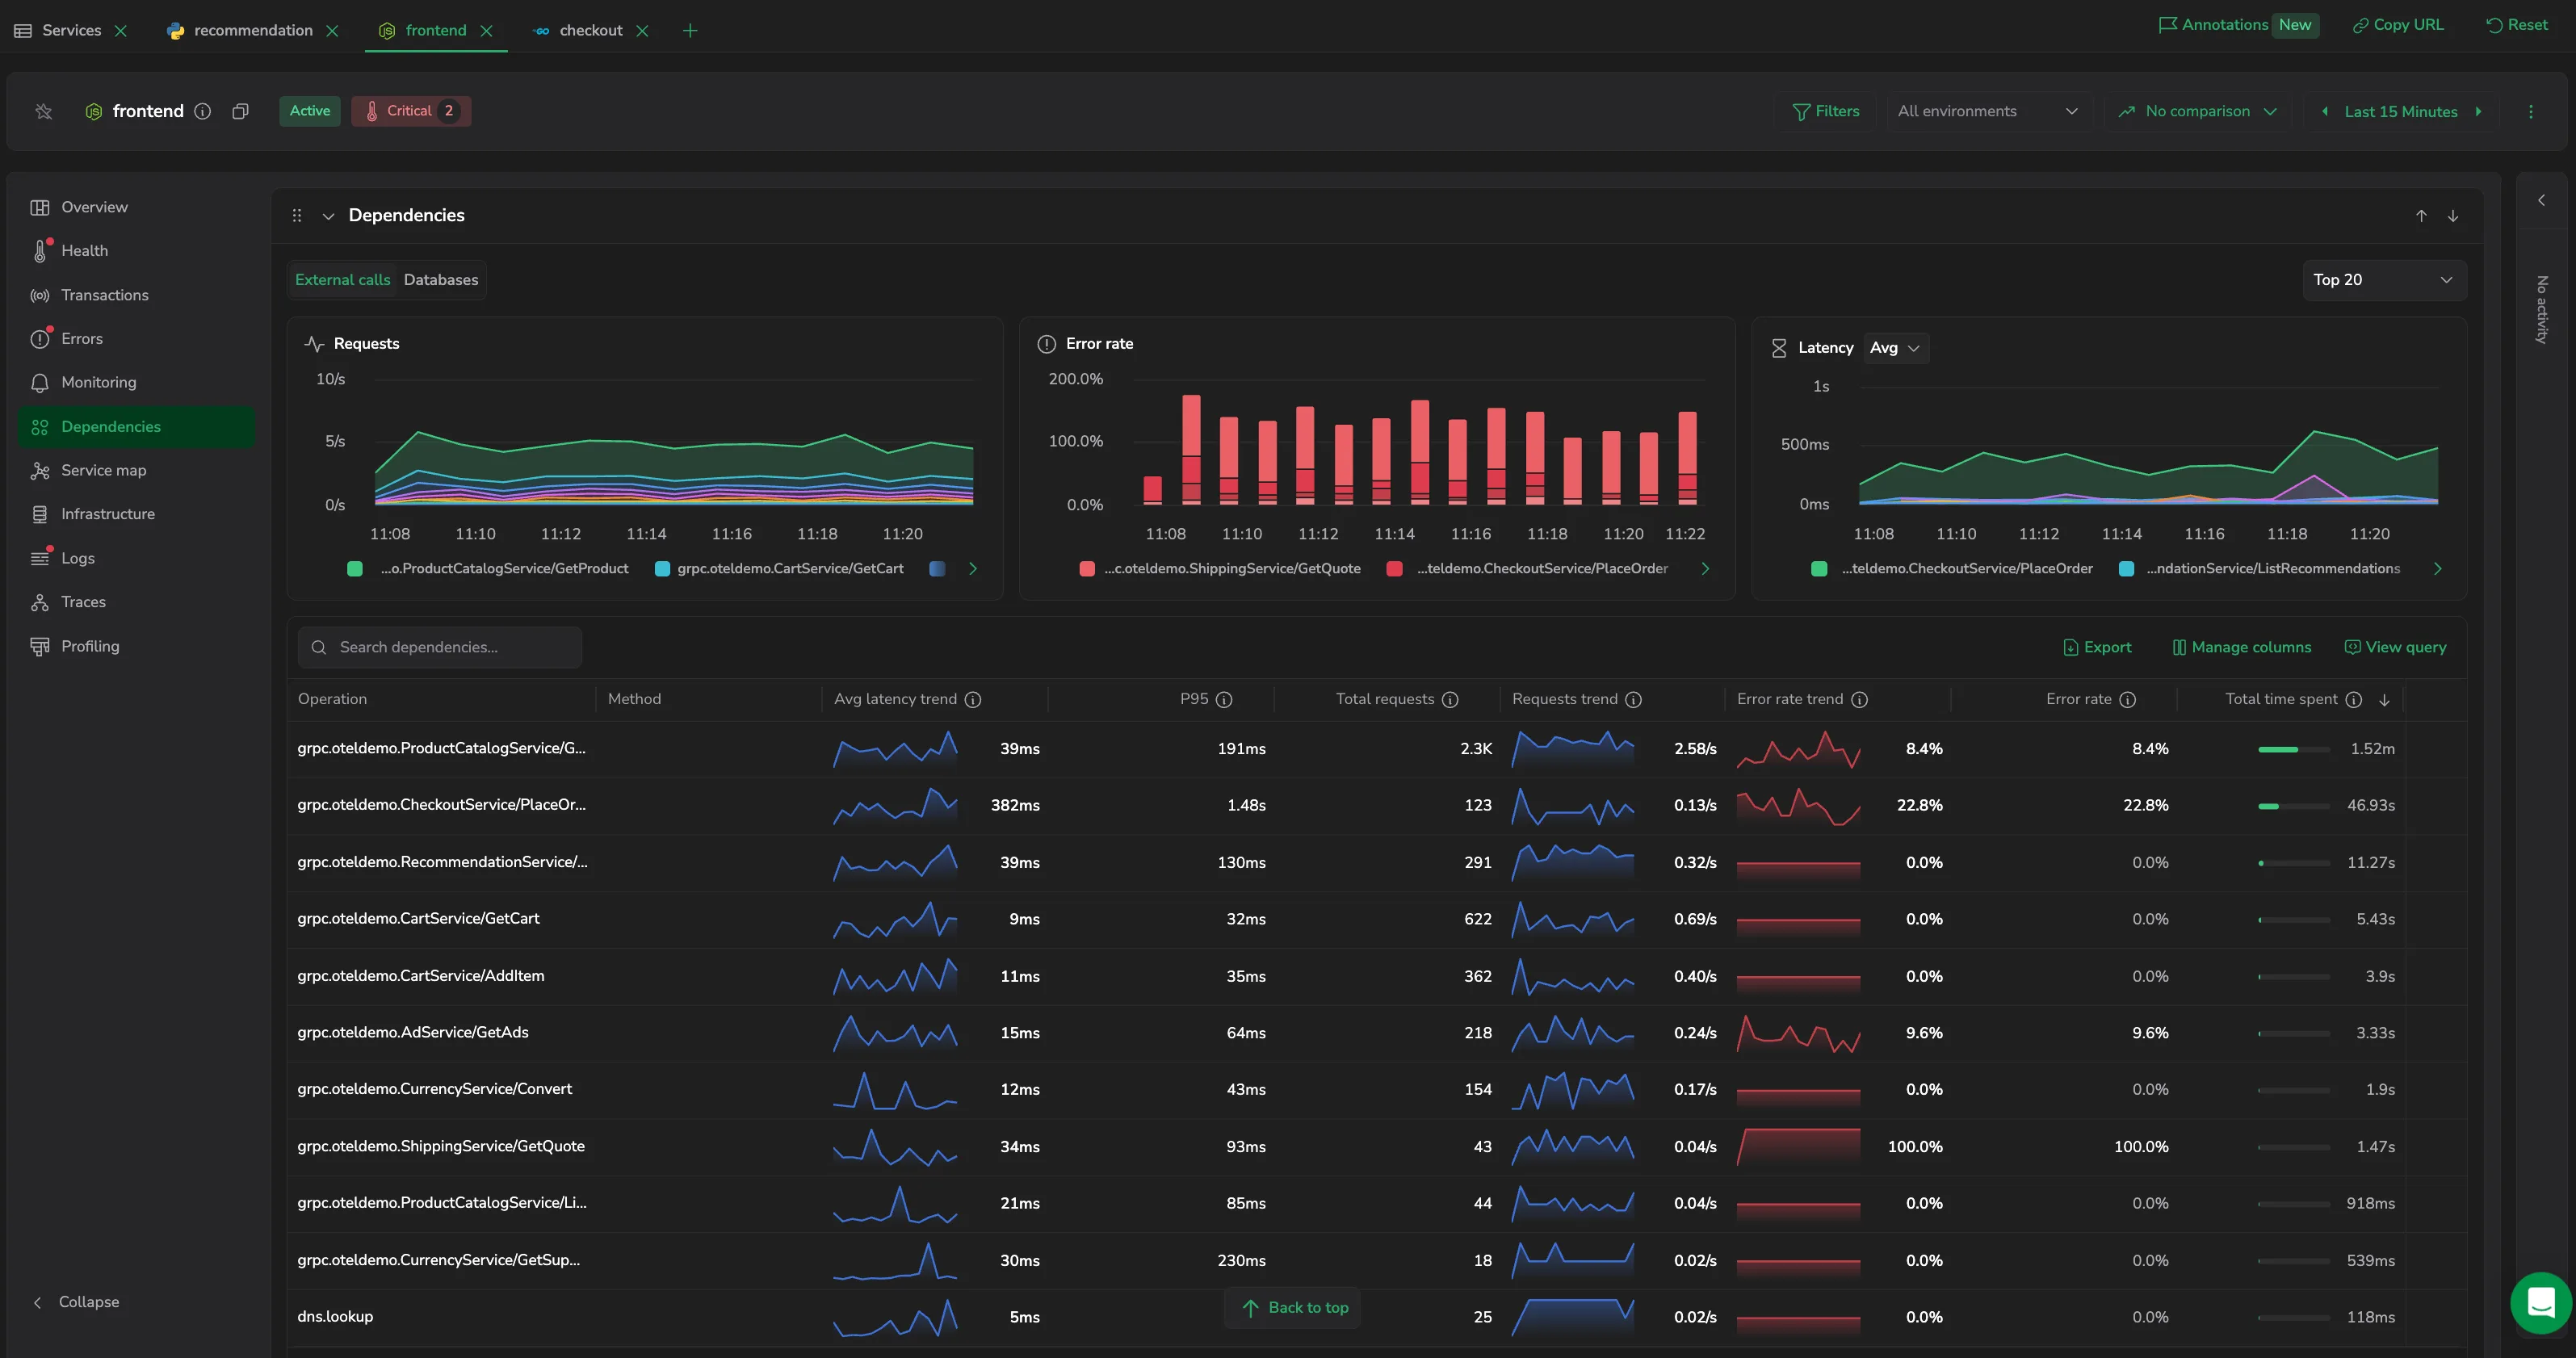
The Dependencies tab shows how a service talks to the things outside its own code - the databases it queries and the external calls it makes to APIs, object storage, messaging systems, and other services. Coralogix detects these dependencies automatically from the service's outgoing spans and tracks the duration, throughput, and error rate of each one, so you can find the slow or failing dependency behind a degraded service and trace it back to the traffic that drives it.
Use it to:
- Find the slow or failing dependency: rank a service's databases or external calls by the time spent waiting on them, and surface the one hurting performance most.
- Analyze databases and external calls separately: switch between the External calls and Databases views to study each kind of dependency on its own terms.
- Trace load back to its source: see which root transactions drive the most time on a dependency, then open the exact spans and traces behind a call.
- Assess the blast radius of a change: before altering a table or a query, see which operations and transactions depend on it.
What you need
- Coralogix Application Performance Monitoring (APM) installed and configured.
- Span Metrics enabled for the service: this powers the charts and tables.
- For root-transaction attribution - the Root transactions breakdown, the per-chart Transaction split, and the database queries' Root transaction column - the Coralogix transactions processor. See Root transaction analysis.
The Dependencies tab is available for services.
What Coralogix detects
Coralogix identifies a service's dependencies from its outgoing spans, without any extra code. They fall into two groups, which the tab presents as separate views:
- External calls: outbound requests to something outside the service - HTTP/S and gRPC APIs, object storage (for example, S3, GCS, Azure Blob), and messaging systems (for example, Kafka, RabbitMQ, SQS, Pub/Sub).
- Databases: queries to datastores such as MySQL, PostgreSQL, MongoDB, and Redis.
A root transaction is the entry-point service operation that starts the trace a dependency call runs in - the request that ultimately triggers a database query or external call. With the transactions processor enabled, Coralogix attributes each dependency call to its root transaction, so you can see which transactions drive the most load on a given database or external service, and are therefore most exposed to errors or latency there.
Access the Dependencies tab
- In your Coralogix toolbar, select APM.
- Open a service from the catalog to open its drilldown, then select the Dependencies tab.
- Choose a view: External calls (the default) or Databases.
- Set the Top N selector - Top 5, Top 20 (default), or Top 100 - to control how many dependencies the charts and table return. Dependencies are ranked by Total time spent.
- Read the trend charts and the dependencies table, then select a row to open the dependency's drilldown drawer.
The Top N and environment selections scope both the charts and the table.
External calls and Databases
The two views share the same layout - trend charts above a ranked table, with a drilldown drawer per row - and differ only in terminology and a few controls:
| External calls | Databases | |
|---|---|---|
| Throughput chart | Requests | Queries |
| Error chart | Error rate | Failure rate |
| Latency chart | Latency | Latency |
| Chart grouping | split by dependency (no group-by) | group by DB name (default), DB system, Operation, or Environment |
| Leading table columns | Operation, Method | DB name, DB system, Operation |
| Drilldown split | Transaction or Version | Transaction |
| Per-query table in the drilldown | - | Queries |
Summary charts
Three charts at the top of each view summarize the service's dependencies, each plotting the top dependencies over the selected range:
- Throughput - Requests (external calls) or Queries (databases) - plotted per second.
- Errors - Error rate (external calls) or Failure rate (databases) - the share that failed.
- Latency - response time per dependency, with a percentile selector (Average, P50, P75, P90, P95, P99) that opens on Average.
Use each chart's menu to change its chart type, scale, stacking, or time bucket, open it in Full view, open View query, or open the chart in the Metric Explorer. The charts plot per-second throughput and rates over the selected range - there is no count or per-minute selector on them; that control lives inside the drilldown drawer. The Databases charts add a group-by (DB name, DB system, Operation, or Environment); the External calls charts always split by the dependency.
Dependencies table
The table below the charts lists every dependency matching the selected scope. Its leading columns identify the dependency (see the comparison above), followed by the metric columns shown by default:
- Throughput total - Requests or Queries - over the timeframe.
- Requests/Queries trend: a sparkline of throughput per second over the range.
- Error/Failure rate trend: a sparkline of the failure rate over the range.
- Error/Failure rate: the share that failed.
- Avg latency trend: a sparkline of average duration over the range.
- P95: 95th-percentile duration.
- Total time spent: cumulative time the service spent waiting on this dependency, and its share of the dependencies shown.
The table returns the Top N dependencies ranked by Total time spent. Selecting a column header re-sorts the returned rows in place; it does not change which rows are returned. Select Manage columns to add others - including Requests/s or Queries/s, Errors, Errors/s, Errors/min, Avg latency, and other latency percentiles (P50, P75, P90, P99).
Use the toolbar to work with the table: Search dependencies to filter the rows by name, Export to download the table, Manage columns to choose which columns appear, and View query to inspect the query behind the table.
Each row - and each series in the charts - has an actions menu (the icon): View details opens the dependency's drilldown drawer, and Copy dependency name copies its name (shown only for a named dependency).
Investigate a dependency
Select a row to open its drilldown drawer, which summarizes the dependency over the selected timeframe. The header shows the service and dependency, a row of key metrics - Requests or Queries, Avg latency, P95, and Error rate or Failure rate - and a time picker. Use the toolbar to Copy link, Expand or Collapse the drawer, step to the Previous or Next dependency, or Close it.
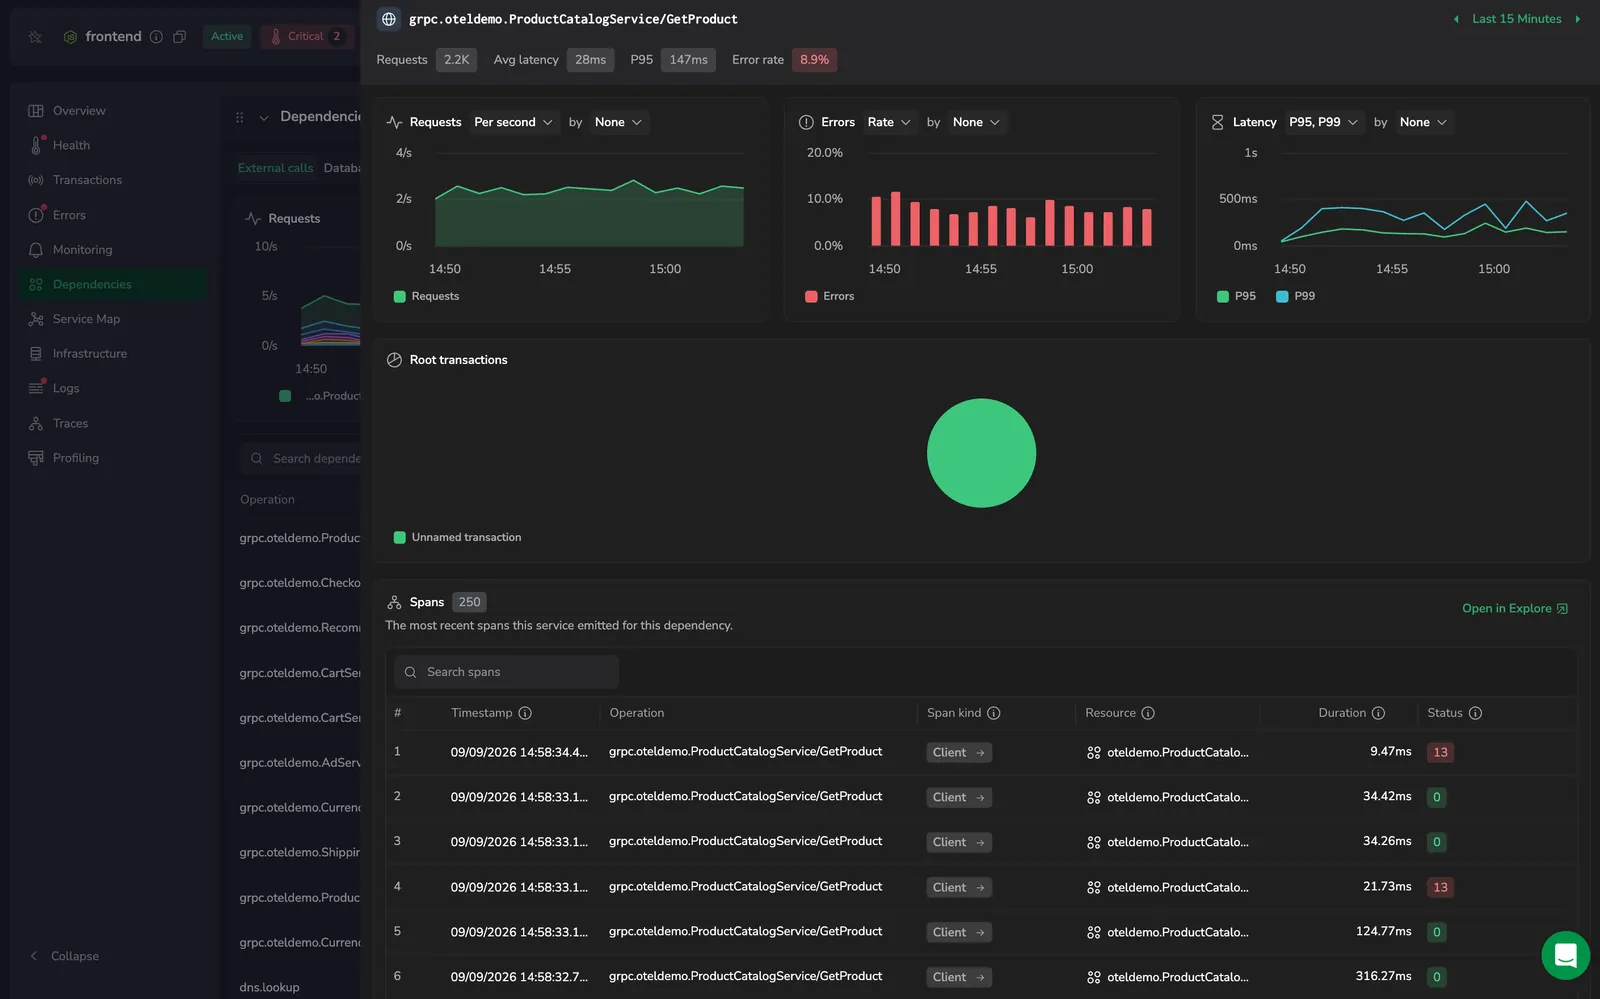
The drawer contains:
- Charts: throughput, errors, and latency over time for this dependency. Each has a Split control: set it to Transaction to fan the chart out by the root transactions behind the calls; external calls can also split by Version (the calling service's version). The Latency chart lets you show one or more percentiles (P95 and P99 by default).
- Root transactions: see Root transactions.
- Queries (databases only): see Queries.
- Spans: see Spans.
Root transactions
The Root transactions chart is a breakdown of the transactions this dependency was called from, sized by the time each spent waiting on it. Hover a slice to read its total time, its share, and the number of requests or queries it made. Use it to identify which service transactions drive the most load on the dependency.
Root transactions require the Coralogix transactions processor. See Root transaction analysis.
Queries
For a database, the drawer adds a Queries table listing the most recent queries the service ran against it. Each row shows:
- Timestamp: when the query ran.
- Query: the statement the span sent to the datastore.
- Root transaction: the transaction that started the trace the query ran in.
- Duration: how long the query took.
- Status: the query's status.
- Span ID: the query span's unique identifier.
Use Search query to filter the list. Select a row to open the related trace for full context on how the query fits into the broader transaction.
Spans
The Spans table lists the most recent spans the service emitted for this dependency, with each span's timestamp, operation, span kind, resource, duration, and status. Use Search spans to filter the list, and Open in Explore to open the spans in Explore.
Select a span to open the Tracing drilldown, where you can switch between Dependencies, Flame, and Gantt views and pivot to correlated logs, infrastructure, profiles, or AI insights. See Investigate with the tracing drilldown for the full reference.
Enable Dependencies
Dependencies is available for services. It is powered by the OpenTelemetry Span Metrics connector together with Coralogix Span Metrics.
Automatic setup
Dependencies are enabled by default when you use the latest version of the Coralogix Helm chart. No further configuration is required.
Manual setup
If you're not using the Helm chart, enable Dependencies by adding the following extraDimensions to the spanMetrics connector in your OpenTelemetry Collector configuration:
extraDimensions:
  - db.system
  - db.namespace
These dimensions are added as labels to the span metrics, letting Coralogix identify database interactions. For richer database analysis, also add db.collection.name, which populates the Collection dimension. Operation-level detail comes from the span name automatically and needs no extra dimension.
Root transaction analysis
For deeper insight - such as identifying which transactions initiate specific database queries or external calls - enable the transactions processor (for supported languages). Without it, the Root transactions breakdown, the Transaction chart split, and the database queries' Root transaction column have no data.
Next steps
See how a service connects to the rest of your system in the Service map.