Monitor errors
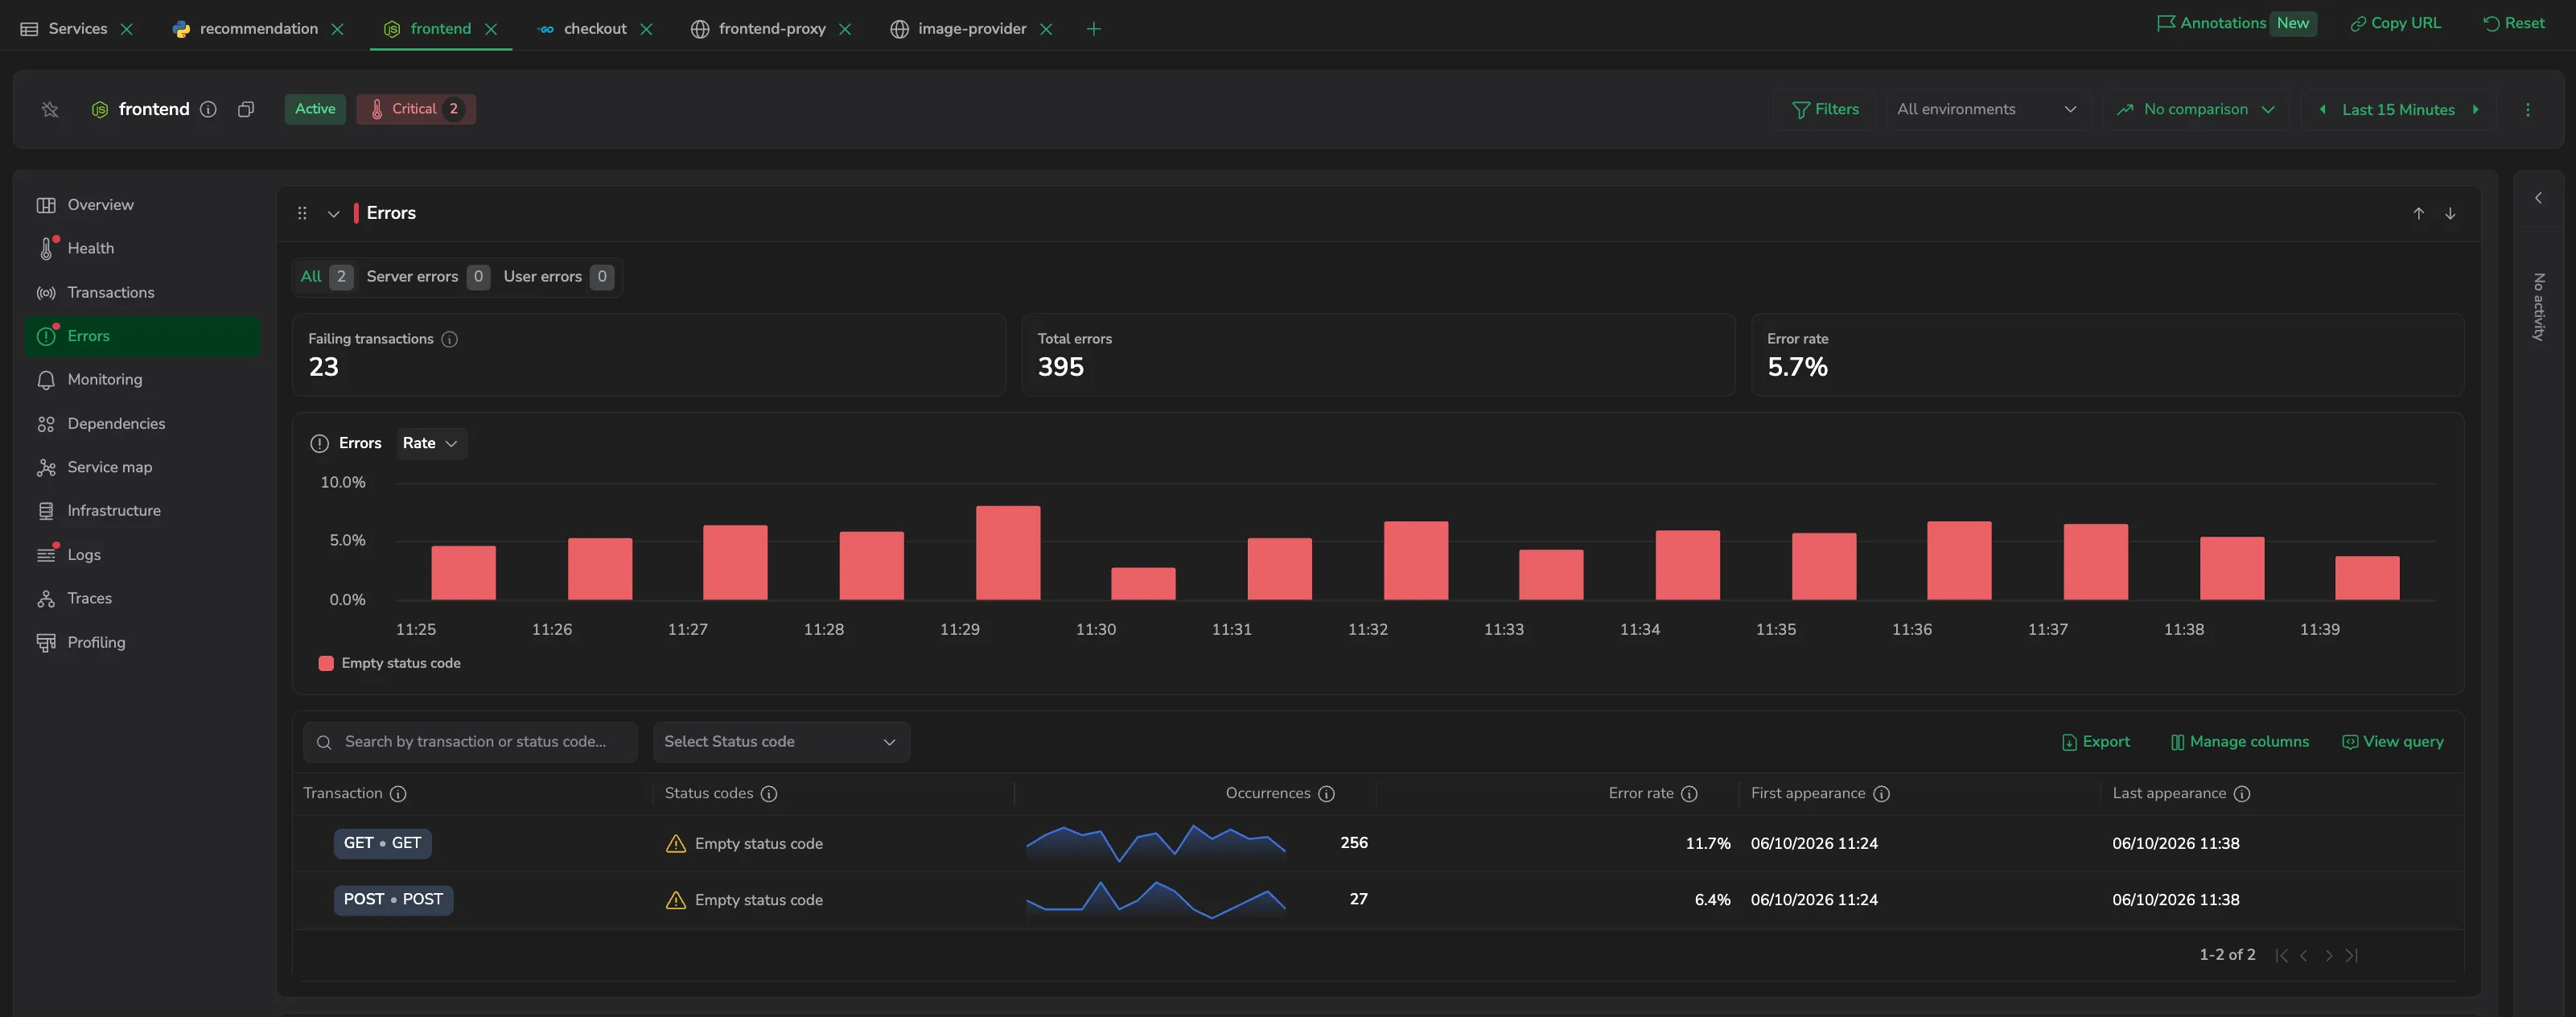
The Errors tab groups an entity's failures so you can rank them by impact and drill into the spans and traces behind them. Services group errors by transaction, each expandable to the status codes behind it (HTTP, gRPC, or GraphQL); databases group them by operation. The tab is available for both services and databases.
Use it to:
- Prioritize by impact: rank errors by occurrences and rate, and fix the failures hitting the most requests first.
- Separate server faults from client mistakes: filter services to server or user errors to tell an application bug apart from a bad request.
- Find the operations behind a failure: see which endpoints raise a status code, then open the exact error spans that carry it.
- Move from an aggregate to the evidence: jump from an error group straight to its error spans and the traces they belong to.
What you need
- Coralogix Application Performance Monitoring (APM) installed and configured.
- Span Metrics enabled for the entity: the KPIs and the chart are built from span metrics.
Access the Errors tab
- In your Coralogix toolbar, select APM.
- Select a service or database to open its drilldown, then select the Errors tab.
The Errors tab is available for both services and databases. Services group errors by transaction, expandable to their status codes; databases group them by operation. The environment filter and any drilldown dimensions scope the errors shown.
Filter by error class
For services, a filter above the summary scopes the tab to All, Server errors, or User errors, each with a count badge. The selection filters the KPIs, the chart, and the table together.
Coralogix derives the class from the status code: HTTP 5xx and their gRPC equivalents are server errors, HTTP 4xx and their gRPC equivalents are user errors. Databases don't classify errors this way, so the filter isn't shown for them.
Key metrics
For services, three KPIs summarize errors over the selected time range:
- Failing transactions: transactions that produced at least one error in the range, grouped by root cause or error signature.
- Total errors: the total count of errored requests.
- Error rate: errored requests as a percentage of all requests.
Databases show two of these - Total errors and Error rate. They don't show Failing transactions.
Errors chart
The Errors chart plots error volume over the selected time range so you can spot spikes and line them up with deployments or traffic surges. Toggle between Rate and Count. For services, the chart plots one series per status code; for databases, a single series for the operation's errors. Use the chart's menu to change its chart type, scale, and bucket, open View query, or open the chart in the Metric Explorer. Select the full-view toggle in the chart header to double the chart's height, moving the table further down the page. Select it again to restore.
Errors table
For services, the table below the chart is a tree grid: each parent row is a transaction (its operation name and HTTP method), expandable to the status codes raised under it. Status codes cover HTTP, gRPC, or GraphQL operations. Its columns are:
- Transaction: the transaction's operation name and method. This column is locked and always first; expand a row to see its status codes.
- Status codes: the codes raised under the transaction, shown on the expanded child rows. When a transaction raises many codes, the extras collapse under an Other status codes row.
- Occurrences: the total count of the error over the range, with an inline trend sparkline.
- Error rate: the share of total requests that resulted in the error.
- First appearance and Last appearance (from Manage columns): when the error was first and most recently seen over the range.
Hover a transaction or a status-code row to reveal a copy button for that value.
Use Search by transaction or status code... to find a group, and the Status code multi-select in the toolbar to narrow to specific codes. The toolbar also has Export to download the table, Manage columns to choose which columns show, and View query. A code Coralogix can't read appears as Empty Status Code; its tooltip notes this usually points to an instrumentation gap, with a Read more link.
For databases, the table groups by operation instead. It shows an Operation column, followed by Occurrences and Error rate. Search it with Search errors by operation....
Investigate an error
Select a row to open a side panel for that error group. Its header has a time picker to change the panel's range, and the open error's row stays highlighted in the table behind it.
The panel contains:
- Header: the status code (or, for a database, the operation), with the transaction it belongs to shown as a chip. A badge marks the protocol - HTTP, gRPC, or GraphQL.
- KPIs: Count, Error rate, First seen, and Last seen for the error.
- Errors by operation: a chart that breaks the error's volume down by the operations that raised it, with a Rate/Count toggle.
- Error spans: a table of the individual error spans, with columns #, Timestamp, Operation, Application, Duration, Rpc.Service, Net.Peer.Name, and Message. Search the list, and select Open in Explore to open the spans in Explore.
Select a span to open the Tracing drilldown for its trace, where you can follow the failure across the trace and pivot to correlated logs, infrastructure, profiles, or AI insights.
Next steps
Dig into a Java service's JVM internals in Runtime metrics.