View infrastructure resources
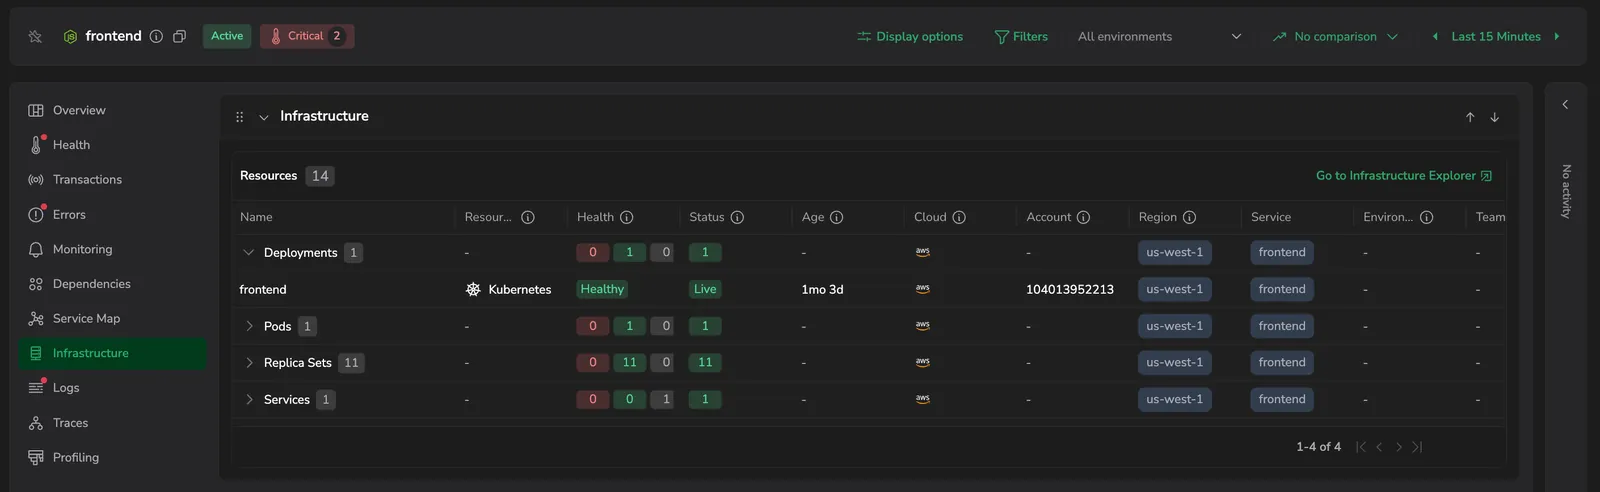
The Infrastructure tab lists the infrastructure a service runs on - its pods, containers, or nodes - so you can see where the service is deployed and check the health and lifecycle status of each resource behind it.
Use it to:
- See where a service runs: identify the pods, containers, or nodes behind a service, grouped by resource type.
- Check resource health at a glance: spot resources that are critical or in a problem lifecycle status, such as Pending or OOMKilled.
- Jump to the full resource view: open the service's resources in Infrastructure Explorer to inspect their metric history and related resources.
What you need
- Coralogix Application Performance Monitoring (APM) installed and configured.
- Infrastructure Explorer data for the hosts, pods, and containers the service runs on. Coralogix correlates resources to the service by its service name and by the deployments the service catalog links to it. Set up Deployment Tracking for services it can't correlate this way.
- Infrastructure Explorer read access to view the tab.
Without Infrastructure Explorer read access, the tab shows You don't have permission to view infrastructure resources. Ask an administrator for Infrastructure Explorer access.
Access the Infrastructure tab
- In your Coralogix toolbar, select APM.
- Select a service to open its drilldown, then select the Infrastructure tab.
The Infrastructure tab is available for services only. On a database it isn't shown; the tab reports Infrastructure resources are available for services only.
Resources table
The tab is a single Resources table - it has no charts. Each row is a resource the service runs on, and rows are grouped by resource type (for example pods, containers, or nodes). Each group is a collapsible row with a count badge showing how many resources it contains; select a group row to expand or collapse it. A badge next to the table title shows the total number of correlated resources.
When you have an environment selected in the drilldown, the table shows resources in that environment. For Kubernetes resources that record the environment only as their cluster name, it matches on the cluster, so those resources still appear.
Each resource row shows its name, indented under its resource-type group, plus:
- Category: the resource category, for example pods, containers, or nodes.
- Health: the health of the resource: critical, warning, or healthy.
- Status: the current lifecycle status, for example Running, Pending, Terminating, or OOMKilled.
- Age: time since the resource was created.
- Cloud: the cloud provider, for example AWS, GCP, or Azure.
- Account: the cloud account for the resource.
- Region: the cloud region for the resource.
- Environment: the deployment environment, for example production or staging.
- Team: the team that owns the resource.
Select any column header to sort the table by that column.
Open a resource's details
Select a resource row to open its Resource details in a drawer without leaving APM. Step through the correlated resources with Next resource and Previous resource, and use Copy link to share the view. For a resource's full metric history and related resources, select Go to Infrastructure Explorer in the table toolbar. It opens the service's resources in Infrastructure Explorer in a new tab, filtered to the service and grouped by type.
Empty and error states
- No infrastructure signal: if Coralogix finds no infrastructure resources for the service, the tab shows No Infrastructure data yet with a Set up Deployment Tracking button. Set up Deployment Tracking for the service to start receiving data.
- No resources in range: if the service is correlated but no resources match the selected time range, the table shows No infrastructure resources are correlated to this service in the selected time range.
- Load error: if resources can't be loaded, the tab shows Couldn't load infrastructure resources.
Next steps
See the logs correlated to a service in Logs.