Read a service's logs
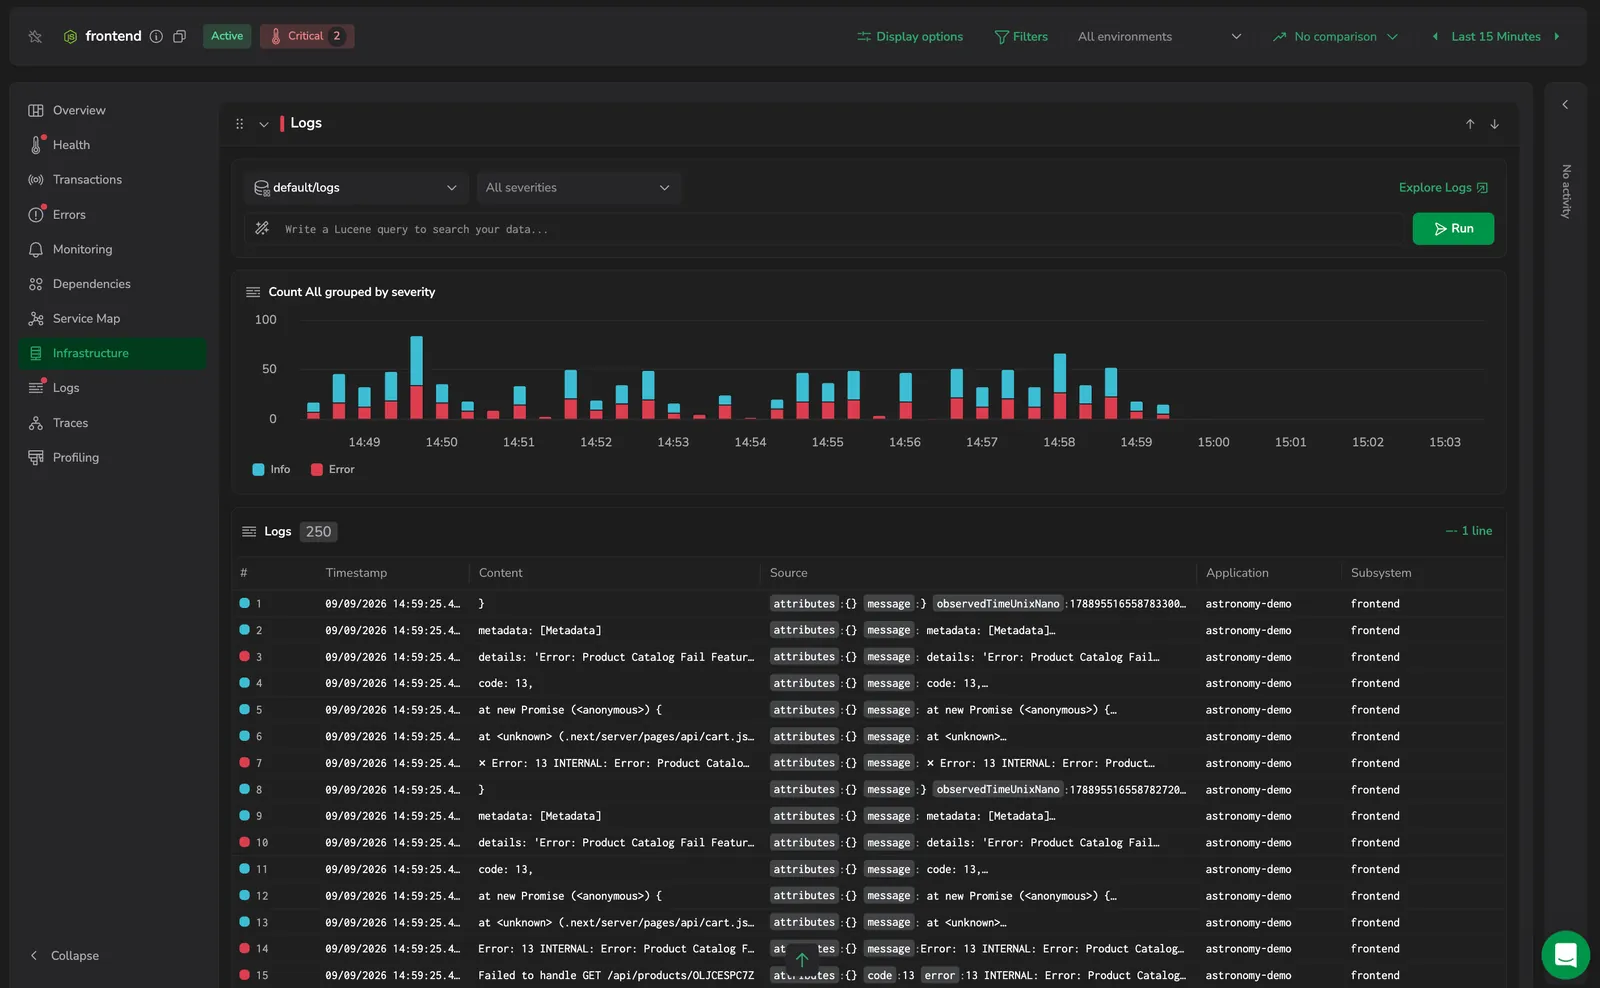
The Logs tab shows the logs correlated to the service you opened, matched by subsystem name - a log whose subsystem name equals the service name appears here - so you can read the log lines around an incident without rebuilding a query in another screen. It is available for services.
Use it to:
- Read the logs around an incident: see a service's log lines for the selected time range without leaving the drilldown.
- Narrow to what matters: filter by dataset, severity, or a Lucene query to isolate errors or a single request.
- See the severity mix over time: read the severity chart to spot a spike in warnings or errors across the range.
- Pivot to full log exploration: open the current scope and filters in Explore Logs: uncapped, with the complete query, field, and visualization tools.
What you need
- Coralogix Application Performance Monitoring (APM) installed and configured.
- Logs shipped to Coralogix for the service. By default, the tab correlates logs to the service by subsystem name: a log's subsystem name must match the service name.
Access the Logs tab
- In your Coralogix toolbar, select APM.
- Select a service to open its drilldown, then select the Logs tab.
The Logs tab is available for services only. For any other entity it reads Logs are available for services only.
The drilldown's time range and environment filter scope both the severity chart and the log table. When the Logs section is collapsed, its header summarizes the range with two mini-metrics - Logs (total log count) and Errors (the count of Error and Critical logs, shown in red when any are present).
Filter the logs
The filter bar at the top of the tab scopes both the severity chart and the log table:
- Dataset: which logs dataset to read. Defaults to your default logs dataset; switch it to read logs from another dataset.
- Severity: a multi-select filter, All severities by default. Choose any of Critical, Error, Warning, Info, Debug, or Verbose to limit the logs and the chart to those severities. A search box in the dropdown helps you find one.
- Lucene query: write a Lucene query and select Run (or press Enter) to apply it. The query is applied only when you commit it, not as you type.
- Explore Logs: opens the current dataset, severity, query, and time range in Explore Logs in a new tab, without the tab's row cap.
Severity chart
The Count All grouped by severity chart plots log volume broken down by severity over the selected time range, so you can read the severity mix and spot a spike at a glance.
Hover the chart to reveal its controls: change the chart type, scale, stacking, or time bucket, or open View query to inspect the underlying query. Select the full-view toggle in the chart header to double the chart's height; select it again to restore.
If the time range is too large to scan exactly, a warning icon appears next to the chart title: Counts are incomplete. This time range exceeded the query scan limit. Narrow the time range for exact numbers.
Logs table
The Logs table lists the most recent logs for the service in the selected range. A badge next to the title shows how many rows are displayed. Its columns are:
- #: a colored severity indicator with the row number.
- Timestamp: when the log was recorded.
- Content: the log message.
- Source: the log's body fields, flattened to key/value pairs.
- Application: the log's application name.
- Subsystem: the log's subsystem name: the field the service correlates on.
The table has no column manager. The only grid controls are a row-style toggle, which switches between 1-line, 2-line, and JSON rows, and pagination (25 rows per page). Select a column header to sort by it.
The table shows up to 250 logs. When more match, the row-count badge reads Showing the most recent 250 logs. Open Explore Logs for the full set. Select Explore Logs to open the complete, uncapped result set.
If no logs match the current filters, the table reads No logs match the current filters - or No logs in this time range when no filter is set. If the logs fail to load, it reads Failed to load logs.
Inspect a log entry
Select a log row to open its details in an inline log details panel in the same tab - the same details panel you use in Explore Logs. Selecting the row again closes the panel.
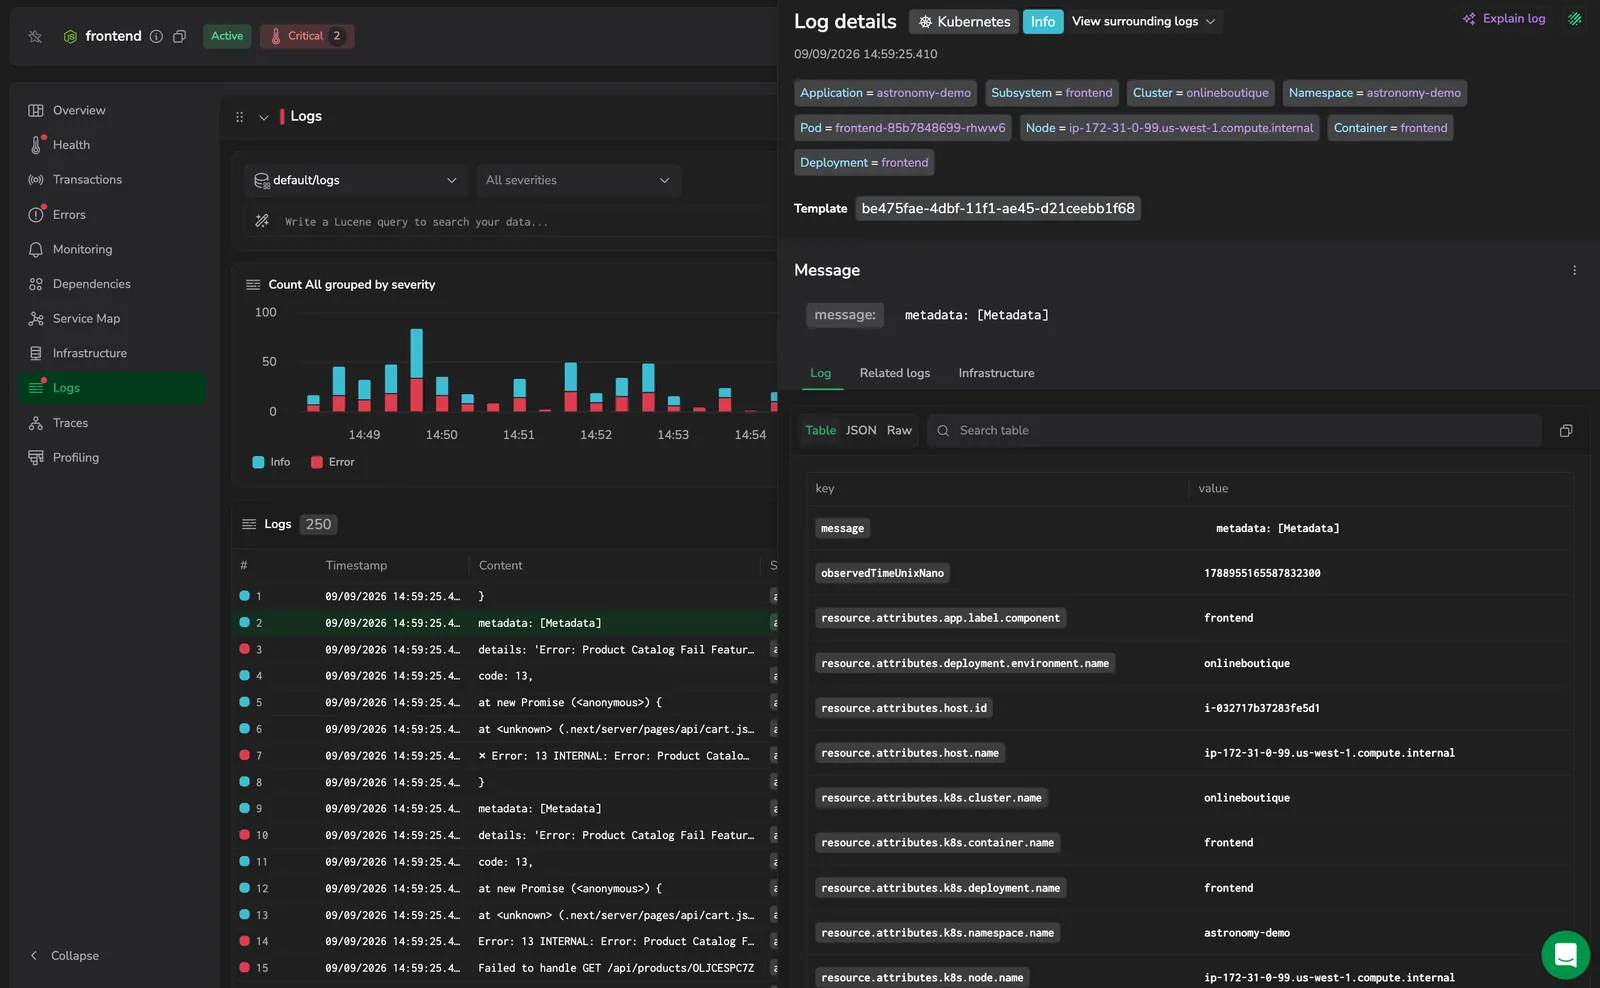
Selecting a row does not navigate to Logs. To open the full Logs screen - the complete query, field, and visualization tools, without the 250-row cap - select Explore Logs in the filter bar. It carries the current dataset, severity, Lucene filter, and time range into Explore Logs in a new tab.
Next steps
Explore a service's recent traces and spans in Traces.