Monitor messaging
The Messaging tab shows how a service uses message queues and topics. It reads the service's producer and consumer spans and summarizes the systems it talks to, the topics it reads and writes, and the throughput, lag, and failures behind them. Messaging supports Kafka and RabbitMQ.
Use it to:
- Read a service's messaging role at a glance: which systems it uses, whether it produces, consumes, or both, and how many topics.
- Spot a backlog: track consumer lag by topic, consumer group, and partition, in messages and in time.
- Find failing topics: compare consume and publish failure rates across topics.
- Follow the flow: see the topics a service exchanges and the services on the other side of them.
What you need
- A service on Kafka or RabbitMQ, instrumented with OpenTelemetry, that emits producer and consumer spans with the attributes listed in Messaging spans. The tab is available for services, not for databases.
- Span metrics with the messaging dimensions turned on. They're off by default; see Turn on messaging dimensions.
- For Kafka consumer lag, lag time, and bytes, Kafka metrics from one of the Kafka metric sources.
Set up messaging
Messaging spans
The Messaging tab reads your service's messaging spans, so the service has to emit them. Most OpenTelemetry messaging instrumentations do this by default: each messaging operation produces a span with the right kind and attributes, following the OpenTelemetry messaging semantic conventions. What the tab relies on:
- Span kind: a publish operation emits a producer span, and a receive or process operation emits a consumer span. The tab counts only producer and consumer spans, and a service's role comes from the span kind. When a service emits both receive and process spans for the same topic, the tab counts only the process spans, so it doesn't count a message twice.
messaging.system:kafkaorrabbitmq, the supported systems. The tab groups and labels activity by this value.messaging.destination.name: the topic or queue name. Drives the Topics table and the per-topic charts.messaging.consumer.group.name: the consumer group, on consumer spans. Drives the consumer-group rows and the lag series.
The Flow graph reads a sample of the raw spans directly, so the service's spans also have to be ingested, not fully sampled away.
Turn on messaging dimensions
The header, charts, and Topics table are built from span metrics, and span metrics don't carry the messaging attributes by default. In the Coralogix OpenTelemetry integration, turn on messagingDimensions under the spanMetrics preset:
opentelemetry-agent:
  presets:
    spanMetrics:
      enabled: true
      messagingDimensions:
        enabled: true
This adds messaging.system, messaging.destination.name, messaging.operation.type, and messaging.consumer.group.name as dimensions on the span metrics (calls_total and duration_ms_*). The setting is available from otel-integration v0.0.373, and under the same name in the ECS on EC2 and standalone host integrations. It's off by default because it adds span metric series. See Cardinality limits. If you use the spanMetricsMulti preset, set spanMetricsMulti.messagingDimensions.enabled; when unset, it follows the spanMetrics setting.
If you run your own collector, add the same four attributes as dimensions on the span metrics connector.
Kafka metric sources
Consumer lag, consumer lag time, and bytes come from Kafka's own metrics, not from spans, so they appear for Kafka only. Coralogix reads them from any of these integrations. You need only one, and each adds the values it reports:
| Source | Consumer lag | Consumer lag time | Bytes |
|---|---|---|---|
| Kafka exporter | kafka_consumergroup_lag | Estimated: lag divided by how fast the partition's latest offset (kafka_topic_partition_current_offset) grows | - |
| klag-exporter | - | kafka_consumergroup_group_lag_seconds | - |
| Kafka Java client metrics | kafka_consumer_records_lag_max | - | kafka_producer_byte_total_total (published), kafka_consumer_bytes_consumed_total_total (consumed) |
When more than one source reports a value, Coralogix picks one per topic (and consumer group) in each environment:
- Consumer lag: the Kafka exporter, then the Kafka Java client where the exporter has no lag.
- Consumer lag time: klag-exporter, then the estimate from the Kafka exporter. A service with only the Java client shows lag in messages but no lag time.
- Bytes: the Kafka Java client only. The tab shows one service, and only the client metrics record which service sent or read the bytes.
Coralogix matches the exporters' topic and group names to the ones on your spans. Keep in mind:
- Environment: Kafka exporter metrics carry the environment set on the exporter, not the one on your service, so lag can land under a different environment than the service's spans.
- Limits: without a consumer group or topic filter, lag from the exporters covers the service's 5 most recently seen consumer groups and the 10 most recently seen topics the exporters report. Other rows fall back to the Java client's lag and show no lag time.
Access the Messaging tab
- In your Coralogix toolbar, select APM.
- Select a service to open its drilldown.
- Select the Messaging tab.
The tab scopes to the drilldown's time range and environment filter. When a service has no messaging activity in the selected range, the tab shows No messaging activity, with a Messaging setup guide button that opens this page.
A Messaging chip in the catalog's Signal column and the drilldown header marks the services that produce to or consume from a Kafka topic, or consume from a RabbitMQ queue; select it to open this tab. The chip follows the selected environments: a service that consumes only in canary shows no chip while you view production. For a service without the chip, such as a RabbitMQ producer, Messaging starts collapsed in the drilldown; expand it to see the header and charts. A RabbitMQ producer shows no topics, because RabbitMQ publishes to exchanges, not queues.
Header
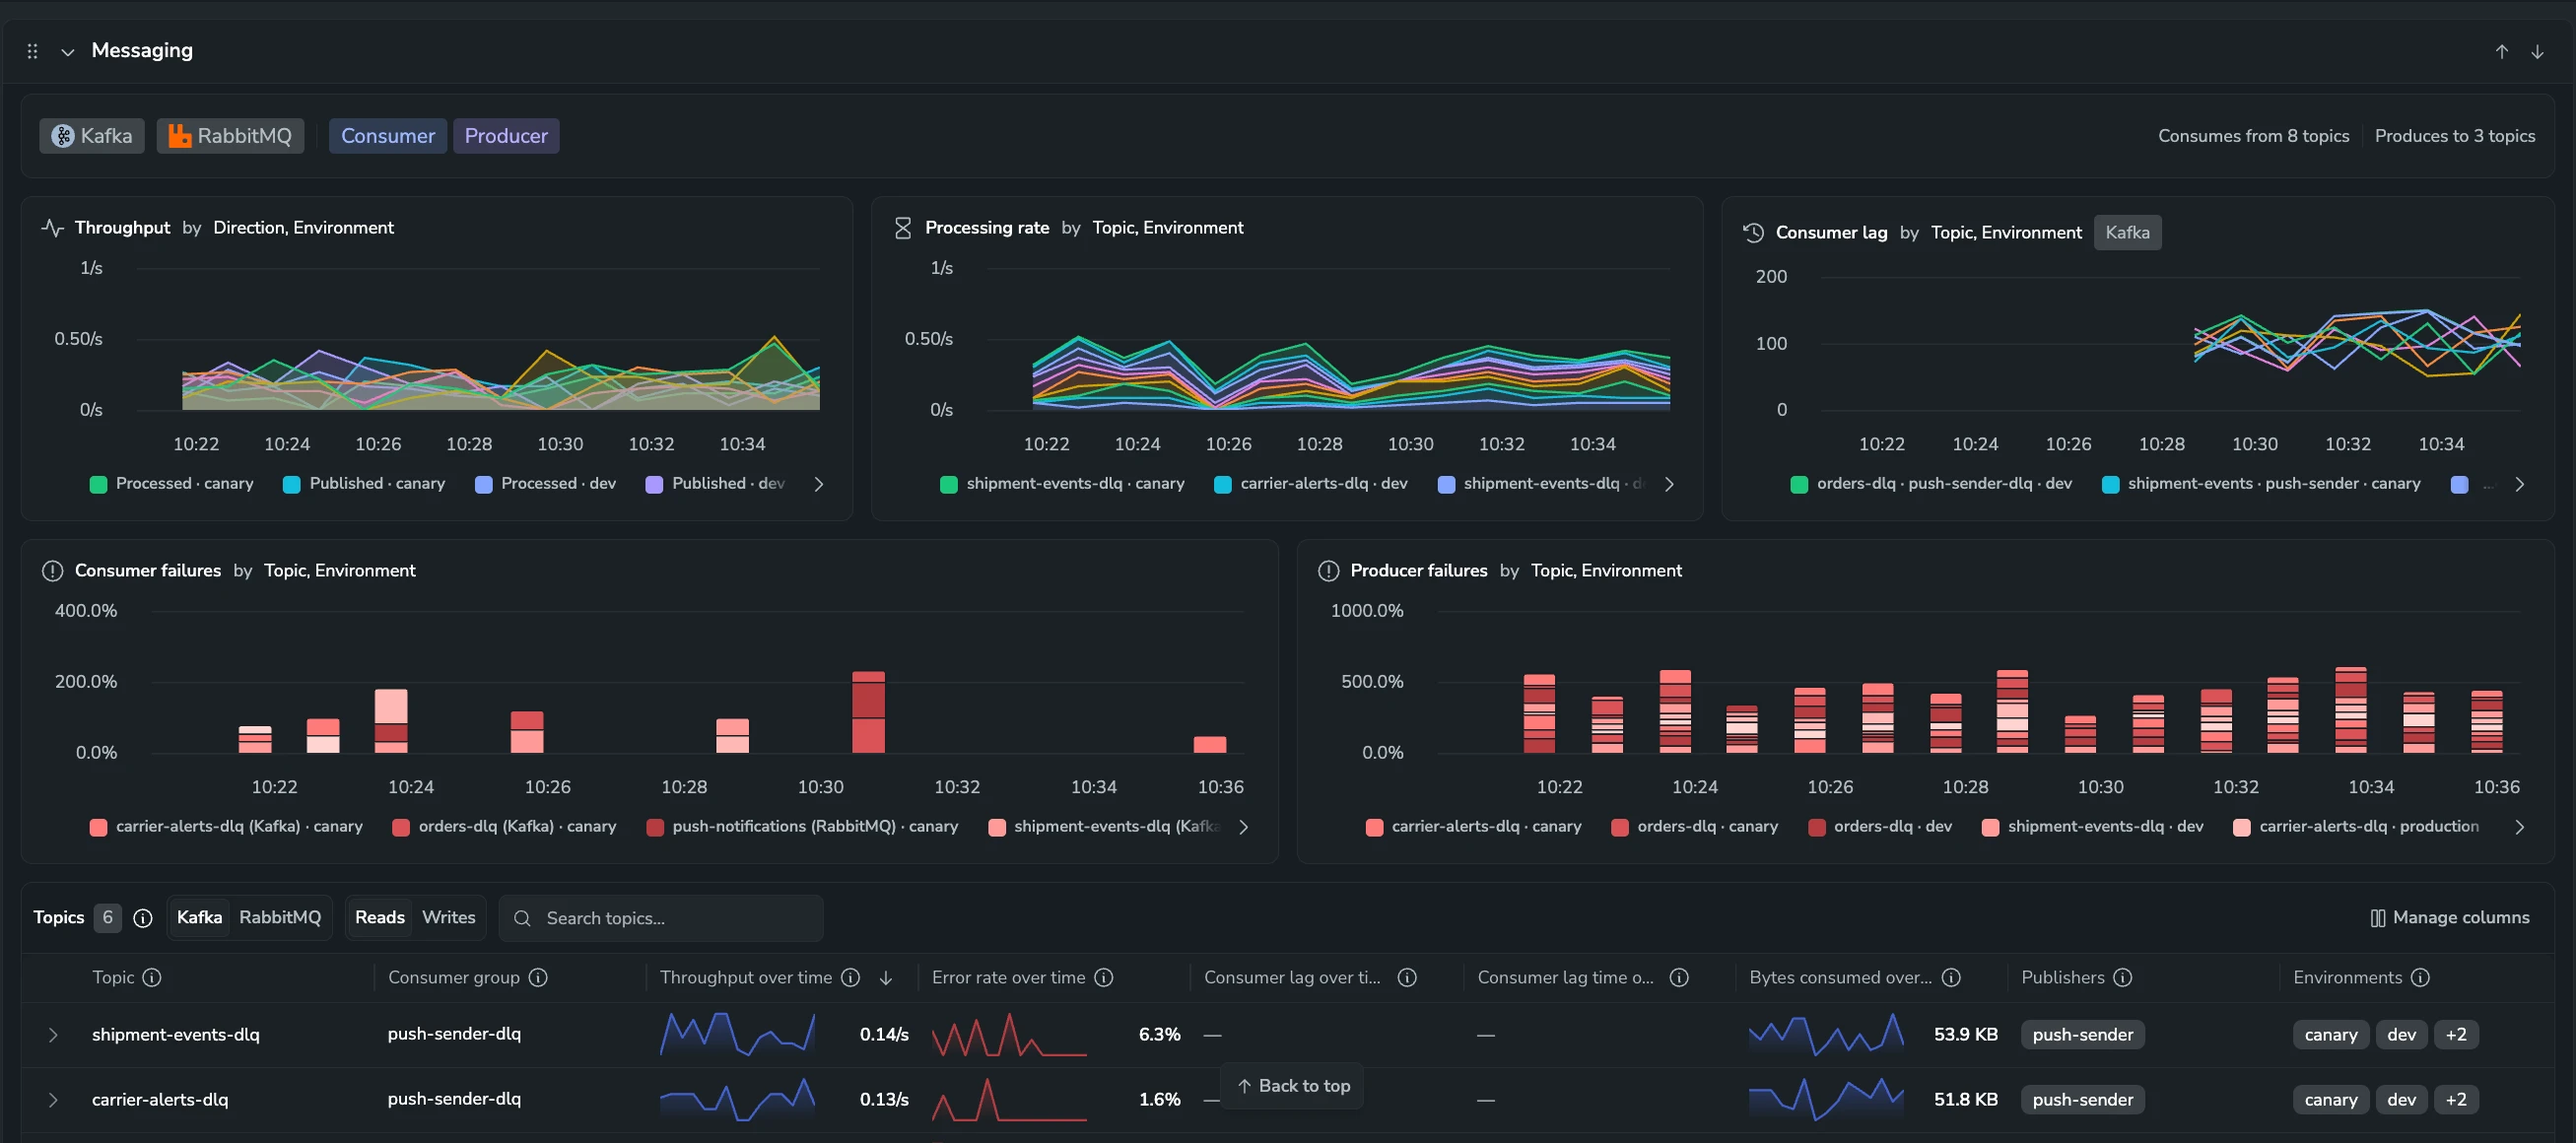
The top of the tab summarizes the service's messaging at a glance:
- Systems: a badge for each messaging system the service uses, Kafka or RabbitMQ.
- Messaging roles: whether the service is a Consumer, a Producer, or both. A consumer reads messages on its systems; a producer publishes them.
- Topic counts: how many topics the service consumes from and produces to.
Charts
The charts below the header break the service's messaging down over the selected range. Each chart's header shows how its series are grouped, and splits them by environment - the Throughput chart by direction and environment, the per-topic charts by topic and environment. Each chart appears only when the service's role supports it, and shares the drilldown's chart controls: full view, View query, Open in Metric Explorer, compare-to baselines, and event markers.
- Throughput (by direction, environment): messages the service published and processed per second, split into Published and Processed. Shown for any role.
- Processing rate (by topic, environment): messages the service processed per second, by the topic they came from. Shown for consumers.
- Consumer lag (by topic, environment): messages waiting to be consumed, by topic and consumer group. Read from Kafka, so it appears for Kafka consumers only.
- Consumer failures (by topic, environment): the share of consumed messages that failed processing, by topic. Shown for consumers.
- Producer failures (by topic, environment): the share of published messages that failed, by topic. Shown for producers.
Each chart plots up to 10 series - the busiest by value - so a service with many topics or environments shows only its top contributors. Each series is labeled by what splits it, ending in the environment - Processed · dev on the Throughput chart, orders · dev on a per-topic chart, and orders · shipment-dispatcher-audit · dev on the Consumer lag chart (topic, consumer group, then environment). When the plotted series span more than one system, the system is added too, as topic (system), so two same-named topics stay distinct.
When a chart's metric is past its cardinality limit, the chart shows Cardinality limit exceeded instead of data. See Cardinality limits.
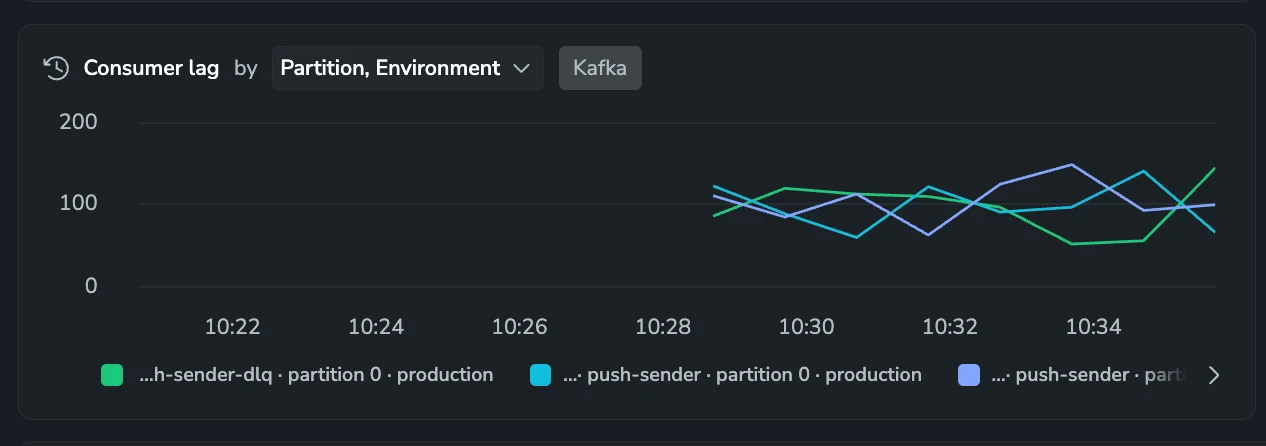
To tell a slow consumer, with lag on every partition, from a single stuck partition, such as a hot key or a poison message, split the Consumer lag chart by Kafka partition:
- In the drilldown's environment filter, select a single environment. With more than one environment, or all of them, the chart always splits by topic, and its header shows Topic, Environment as plain text.
- In the Consumer lag chart header, select Topic, Environment, then select Partition, Environment.
Each partition gets its own series, such as orders · shipment-dispatcher-audit · partition 3 · production, ordered by topic and then by partition number. When the lag comes from the Kafka Java client and several consumer groups read the topic, the client can't split lag by group and partition, so each group shows one series labeled all partitions. The URL keeps your choice.
Topics table
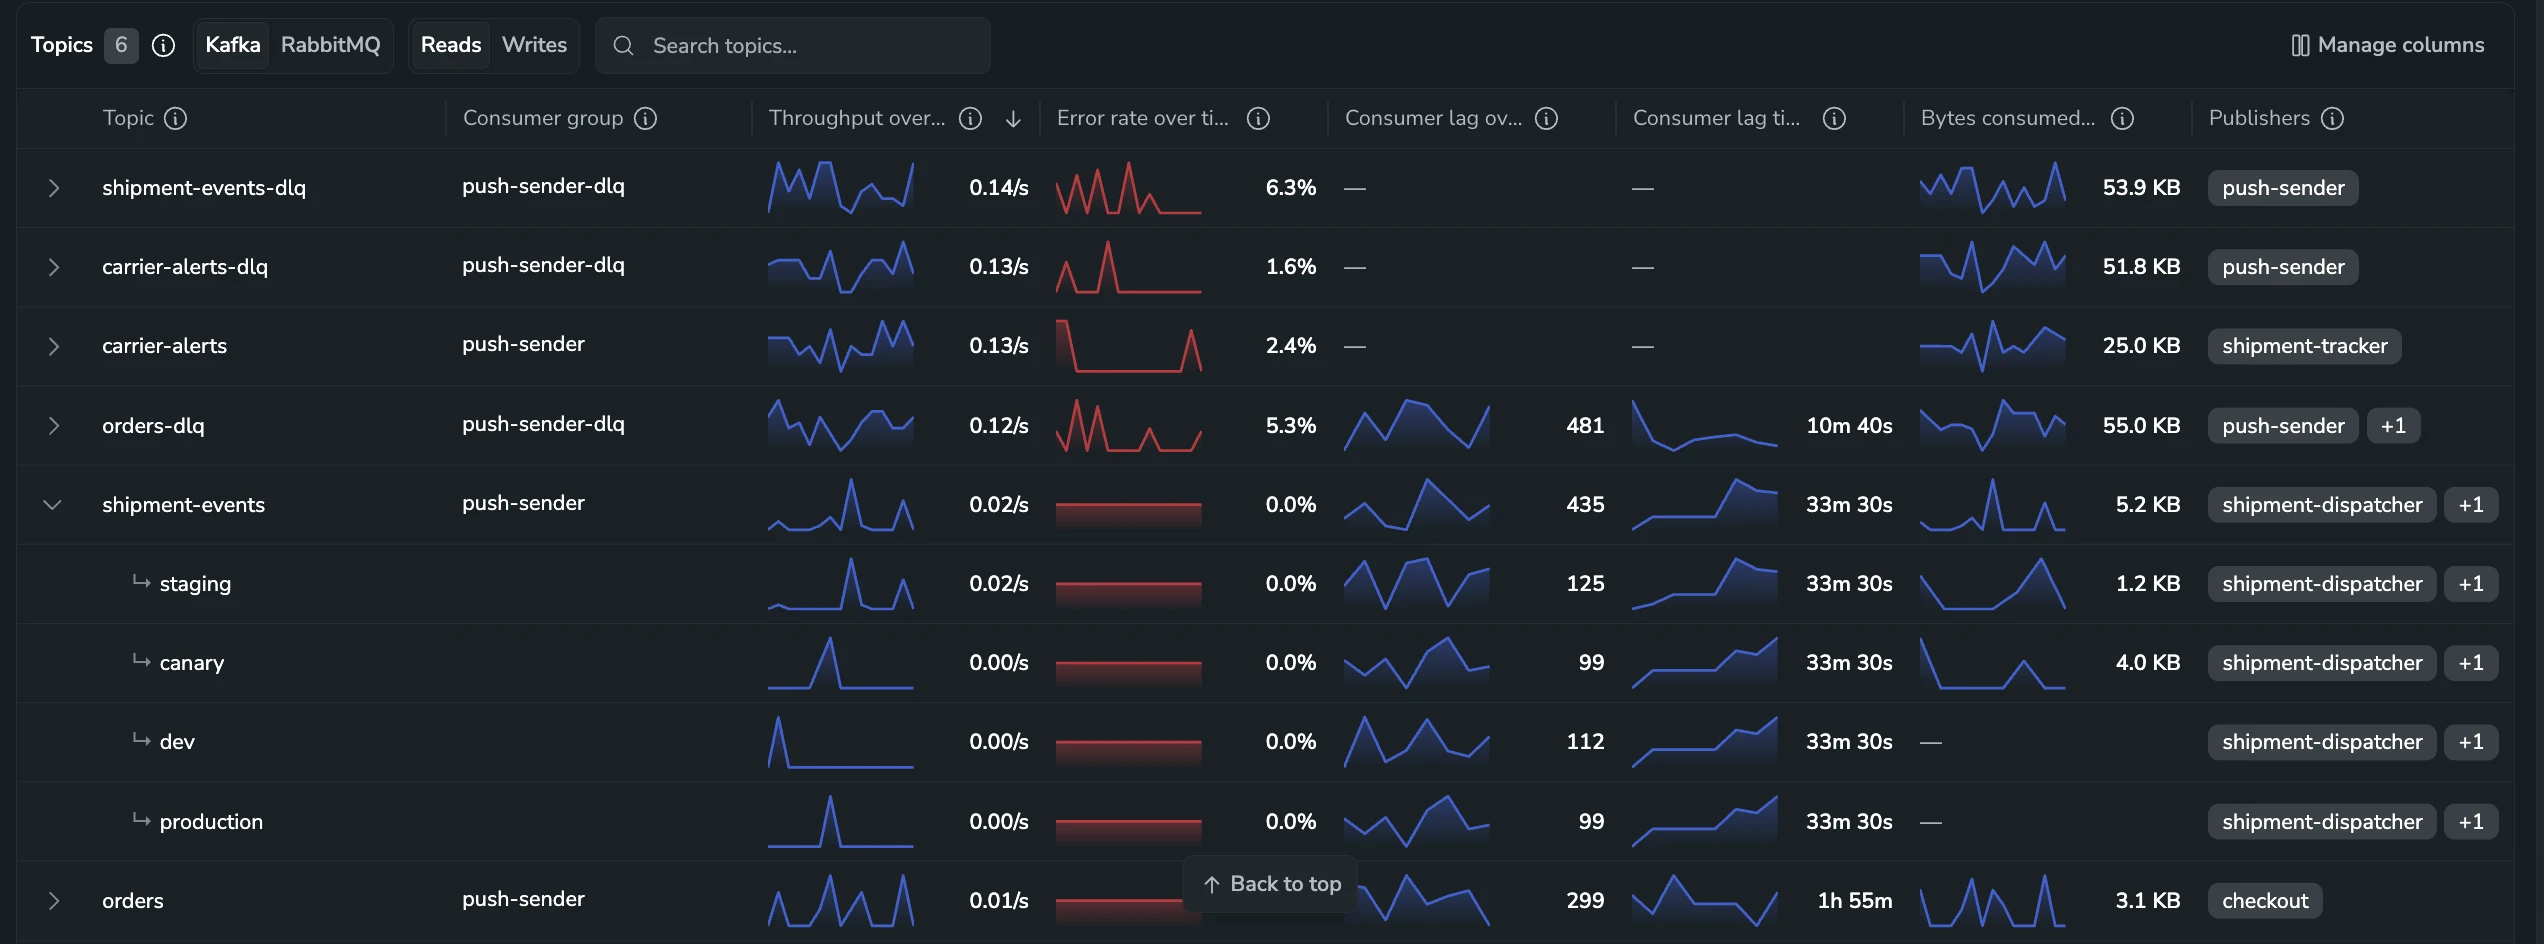
The Topics table lists the topics the service reads from or writes to, one row per topic (and consumer group, on Kafka reads). The controls above the table set what it shows:
- Messaging system: one button per system the service talks to, shown when it uses more than one.
- Reads or Writes: the service's consume side (Reads) or publish side (Writes). A direction the service doesn't use is disabled; a RabbitMQ producer shows no topics on Writes, since RabbitMQ publishes to exchanges rather than to queues.
- Search topics: filter the rows by topic, consumer group, or connected service name.
- Manage columns: set which columns show, their order, and which stay pinned. Topic and Consumer group identify the row and are always shown; the panel lists only the columns that apply to the selected system and direction. To keep a column in view while you scroll sideways, select Pin left or Pin right on it; Unpin returns it to the scrolling area. Pins reset when you reload the page.
By default the table shows the over-time graphs, the peers, and the environments; the plain number columns are turned on from Manage columns. It opens sorted by throughput, and your sort and column choices carry across a direction switch. The columns:
- Topic: the topic or queue.
- Consumer group (Kafka reads): the consumer group the service reads the topic with.
- Throughput and Throughput over time: messages per second the service read from or wrote to the topic - as a number, and as a sparkline across the range.
- Error % and Error rate over time: the share of publish or consume operations on the topic that failed - as a number, and over time.
- Consumer lag and Consumer lag over time (Kafka reads): messages waiting to be consumed, read from Kafka - as a number, and over time.
- Consumer lag time and Consumer lag time over time (Kafka reads): how far behind the consumer is in time - roughly the age of the oldest unread message on the worst partition, read from Kafka. The sparkline shows by default; the number is turned on from Manage columns. Values read in the two largest units, such as
3m 20sor4h 30m, and0swhen the consumer has caught up. The number turns orange from 60 seconds and red from 5 minutes. When it's estimated from the Kafka exporter, it stays empty for a topic that receives fewer than 0.01 messages per second. - Bytes consumed over time (Kafka reads) or Bytes published over time (Kafka writes): the bytes the service read from or wrote to the topic in each step of the selected range, reported by the Kafka Java client.
- Publishers or Consumers (Kafka): on Reads, the Publishers that write to the topic; on Writes, the Consumers that read it. Shows Unavailable when that lookup fails.
- Environments: every environment the topic has been seen in, regardless of the selected time range or environment filter.
A topic seen in two or more of the selected environments expands into one row per environment, as the services and databases tables do. Expand it to see each environment's throughput, errors, and lag, busiest first; only environments with data in the range are listed. Changing the time range, environments, comparison, system, or direction collapses the table.
Flow
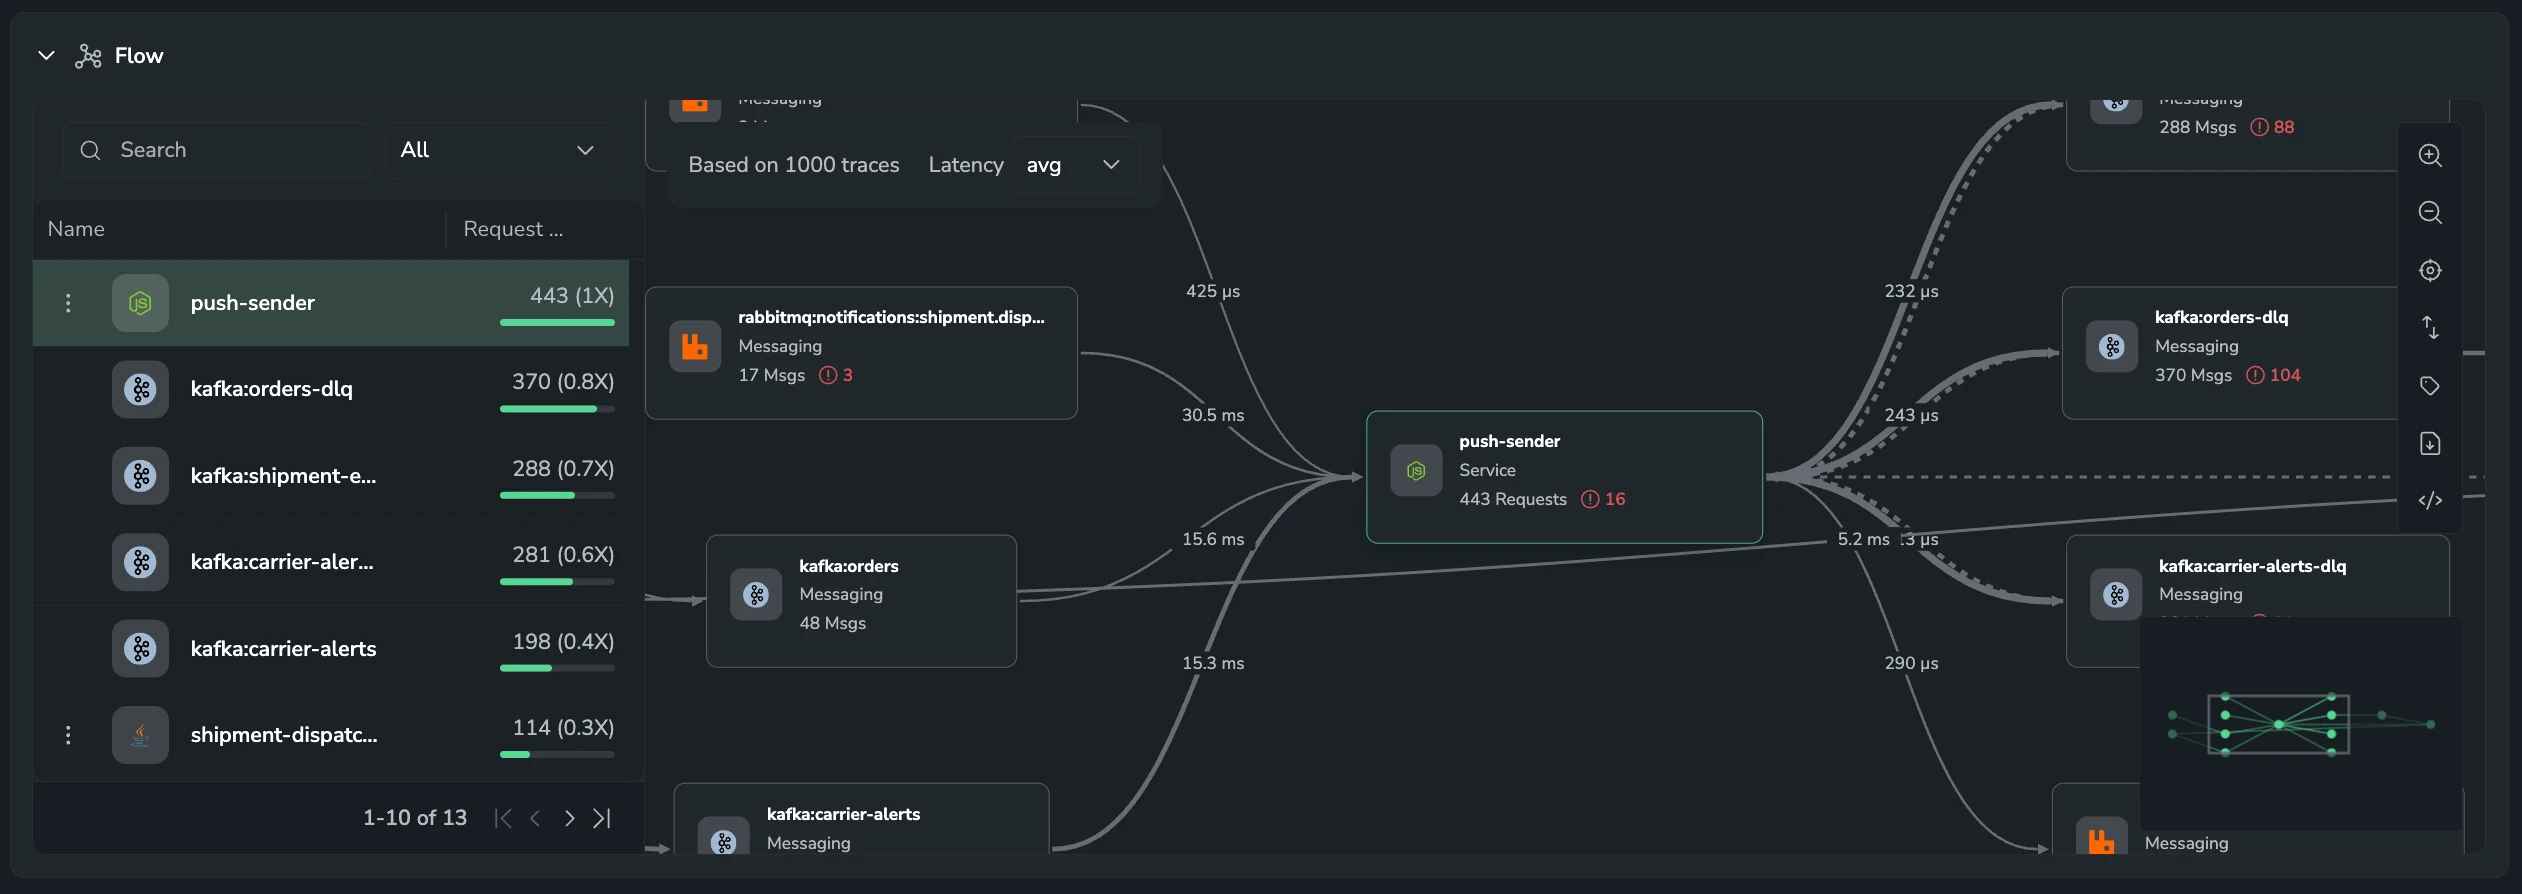
The Flow band at the bottom of the tab maps the service's messaging neighborhood. It is collapsed by default and shows four summary pills:
- Topics read: topics the service consumes from.
- Topics written: topics the service produces to.
- Connected services: services that produce to a topic this service reads, or consume one it writes.
- Messages: messages the service published or consumed in the sampled traces.
Expand it to see a dependency graph built from a sample of the service's traces - the header notes how many, for example Based on 1000 traces. The focus service sits in the middle, with the topics it reads and writes and the services on the far side of them around it. Each node is labeled with its type - Messaging for a topic (shown as system:topic) or Service for a service - and its volume and error count; each edge is labeled with the latency between the two, set by the Latency control (for example, average). A side list ranks the connected nodes by request volume relative to the focus service (1X, 0.8X, and so on); search or filter it to focus the graph, and select a node to see its request rate, errors, and latency. The graph drops direct service-to-service and non-messaging dependencies, so only the messaging path is shown.