Monitor a service
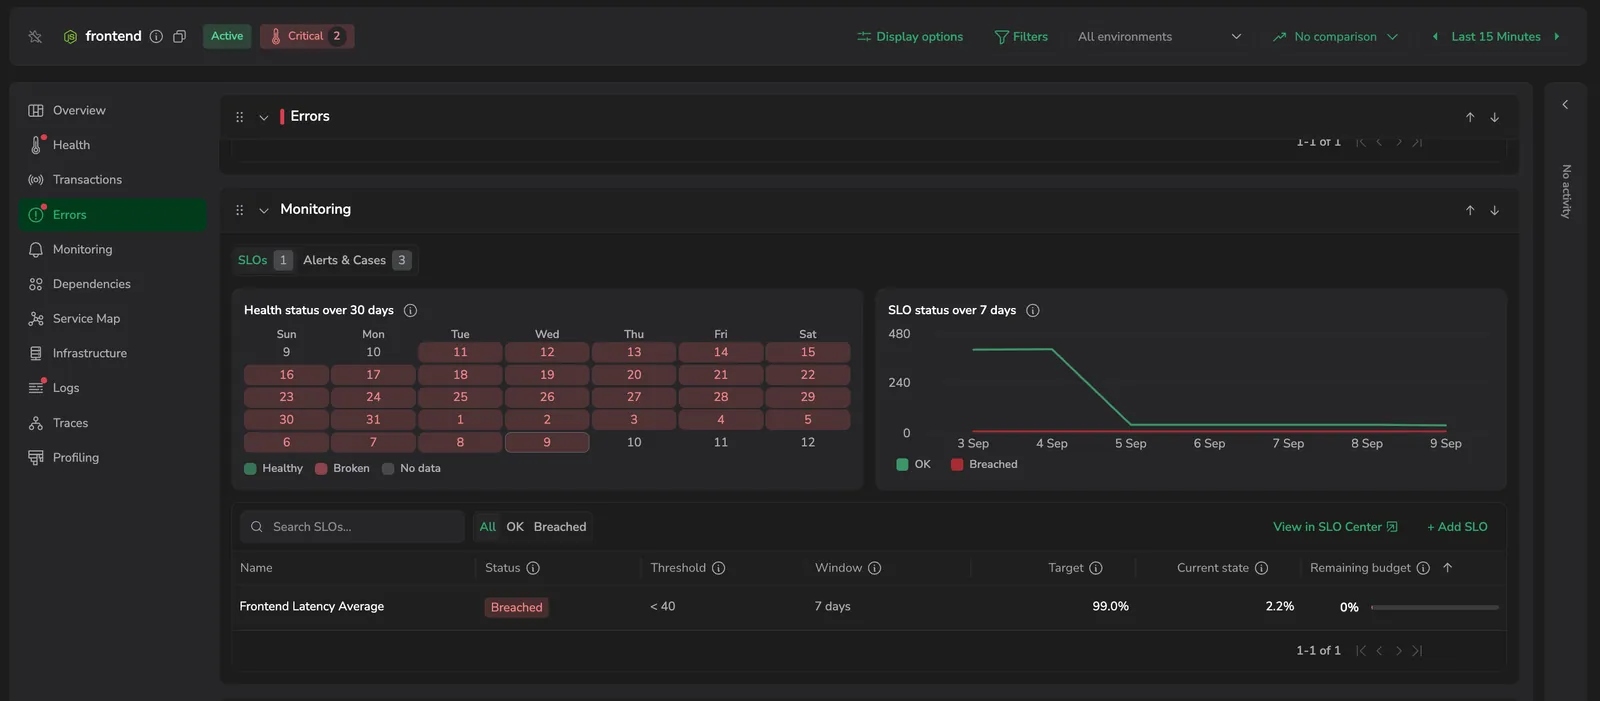
The Monitoring tab collects what watches a service - its service-level objectives (SLOs), the cases open on it, and the alerts scoped to it - so you can see the service's reliability targets and its open issues without leaving APM. The tab has three panels, switched with a toggle that shows a count on each: SLOs (the default), Cases, and Alert Definitions. Monitoring is available for services.
Use it to:
- Track reliability targets: watch each SLO's status, compliance against target, and remaining error budget for the service.
- See what's firing: scan the alerts scoped to the service, their type and priority, and when each last triggered.
- Reach the case behind an alert: a firing alert has already opened a case: open its row to jump to the case and start responding.
- Enable or silence an alert in place: flip a rule on or off from the table without leaving the tab.
What you need
- Coralogix Application Performance Monitoring (APM) installed and configured.
- Span Metrics enabled for the service.
- Monitoring is available for services. Databases do not show the tab.
Access the Monitoring tab
- In your Coralogix toolbar, select APM.
- Select a service to open its drilldown, then select the Monitoring tab.
- Use the switcher at the top of the tab to move between the SLOs, Cases, and Alert Definitions panels. Each button shows a count of the items in that panel; the tab opens on SLOs.
If you open the tab for a database, it shows Monitoring is available for services only.
SLOs
The SLOs panel lists the service-level objectives defined for the service in the SLO Center, with each objective's status, evaluation window, target, current compliance, and remaining error budget.
When the service has at least one SLO, a status-overview widget sits above the table: a health calendar and a seven-day status chart that summarize how the service's SLOs have tracked over the recent period.
The SLO table shows:
- Name: the SLO's name.
- Status: the worst status across the SLO's permutations: Healthy, Warning, Critical, Breached, or Pending.
- Threshold: the threshold a request must meet to count as good. Latency SLOs only; other SLOs show an em dash.
- Window: the rolling evaluation window, such as 7 days.
- Target: the compliance target for the SLO.
- Current state: current compliance for the SLO.
- Remaining budget: the error budget left before the SLO breaches, shown as a bar that fills to the remaining percentage.
Use Search SLOs… to find one by name, the All / OK / Breached filter to narrow by status, and any column header to sort. Select a row to open the SLO in a drilldown drawer - an SLO Overview with compliance over time, remaining error budget, total and good events, and a per-minute snapshot. To open the full SLO Center instead, select Go to SLO Center.
If you have permission to edit SLOs, the toolbar also offers + Add SLO, which opens the SLO Center create drawer with the service pre-filled. This action may not appear for all accounts. See Service SLOs.
Cases
The Cases panel lists the cases that affected this service - any case active at some point in the selected time range, not only those opened inside it. When you have environments selected on the page, the table narrows to cases carrying one of those environments; cases with no environment are left out.
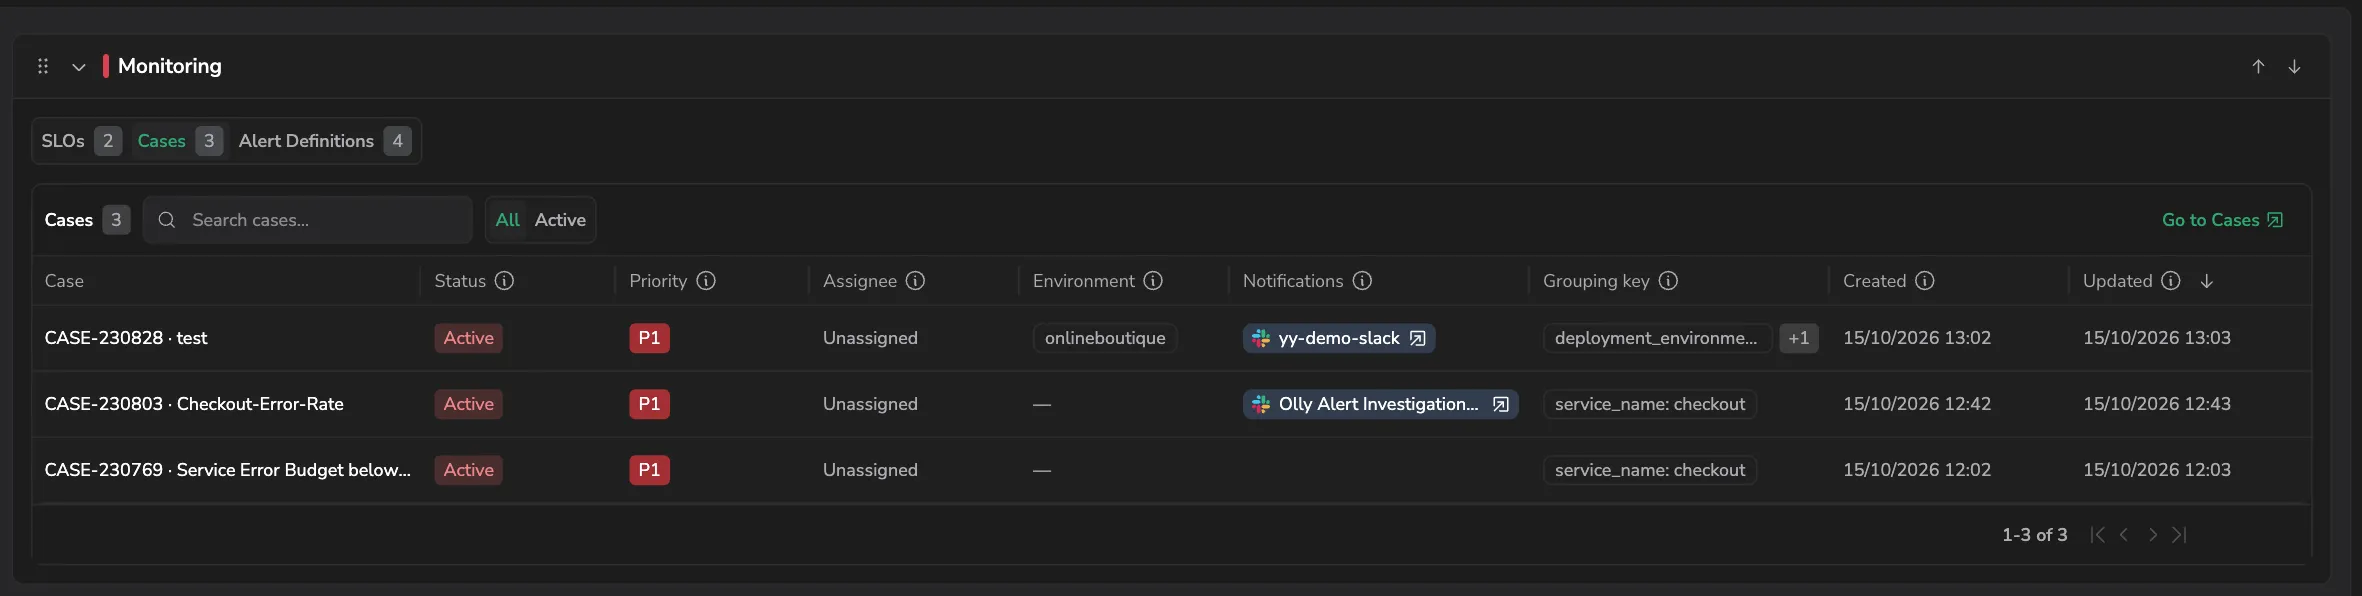
The table shows:
- Case: the case's readable ID and title.
- Status: where the case is in its lifecycle: Pending, Active, Acknowledged, Resolved, or Closed.
- Priority: the priority the case was opened at, P1 to P5.
- Assignee: the user the case is assigned to, or Unassigned.
- Environment: the environments of the service the case affects.
- Notifications: where the case was sent. Select a destination to open it - a Slack message, a PagerDuty or ServiceNow incident, a Microsoft Teams message, or a connector delivery.
- Grouping key: the labels the case is grouped by.
- Created: when the case was opened.
- Updated: when the case last changed.
Use Search cases… to find one by title or ID, and the All / Active filter to narrow by status, where Active covers the Active, Acknowledged, and Pending states. The table opens sorted by Updated, newest first. The filter and sort travel in the URL, so a shared link reopens the table the way you had it.
Select a row to open the case in a drawer without leaving APM. To open the full case feed for the service instead, select Go to Cases.
Alert definitions
The Alert Definitions panel lists the alerts scoped to the service.
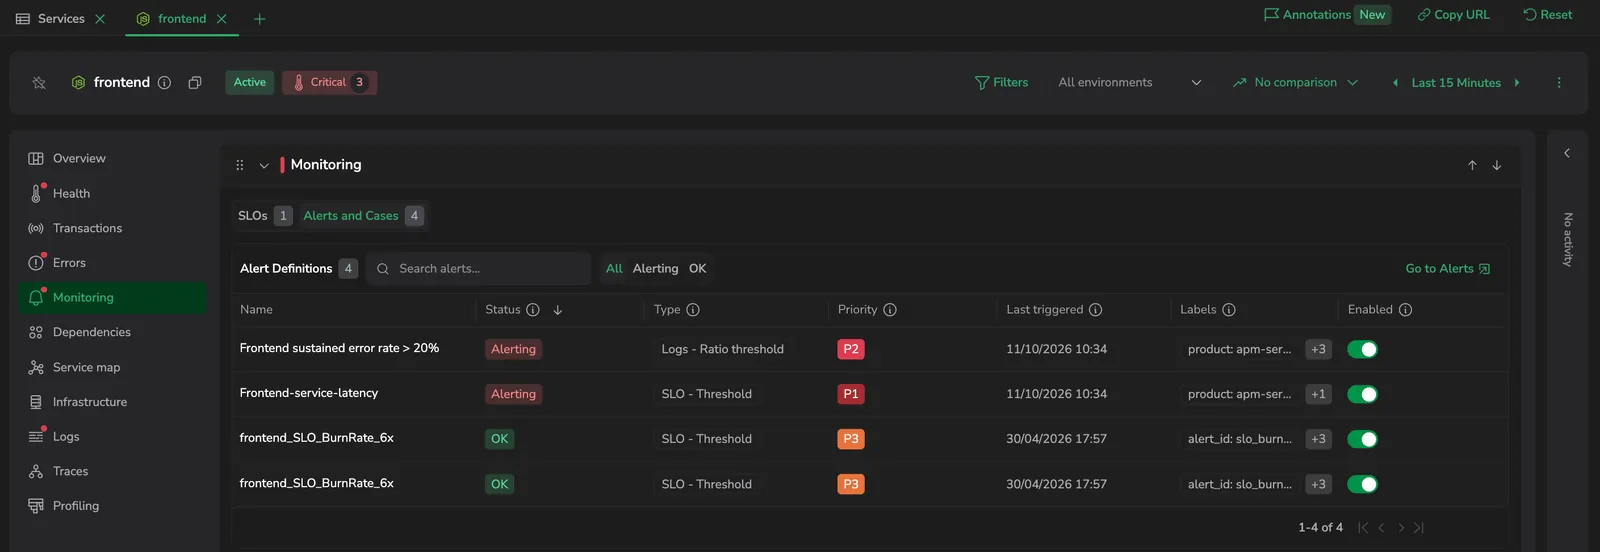
The table shows:
- Name: the alert's name.
- Status: whether the alert is firing right now: Alerting or OK.
- Type: the rule type the alert evaluates, such as Metric - Threshold, Logs - Anomaly, or Tracing - Threshold.
- Priority: the priority the alert notifies at.
- Last triggered: when the alert last fired, or Never triggered.
- Labels: the entity labels attached to the alert.
- Enabled: an inline toggle for whether the rule is currently evaluating. Flip it to enable or disable the alert without leaving the tab.
Use Search alerts… to find one by name and the All / Alerting / OK filter to narrow by status.
What a row opens depends on the alert's status:
- A firing alert (Alerting) offers a View cases action that opens the case feed for the service, filtered to its APM labels, where you can work the incident. The same View cases action is available from a row's action menu in the Health tab.
- Any other alert opens the alert's drilldown in a new tab.
To open the full Alerts screen, select Go to Alerts. To create an alert prefilled from a service's metrics, see APM monitoring with alerts.
If you don't have permission to view SLOs or alerts, the corresponding panel shows a message instead of the table. Enabling or disabling an alert also requires permission; without it, the Enabled toggle is disabled. The Cases table needs permission to read cases; without it, the table doesn't appear.
Next steps
Define a reliability target for the service in Service SLOs.