Operations
The Operations tab breaks a database down into its operations - each a class of query, such as a SELECT against a given table - so you can find the slowest or busiest and drill into its query spans. It is the database analog of a service's Transactions tab.
Use the Top N selector (Top 5, Top 20 by default, or Top 100) to set how many operations to return; they are ranked by total time spent. The selection applies to both the charts and the table.
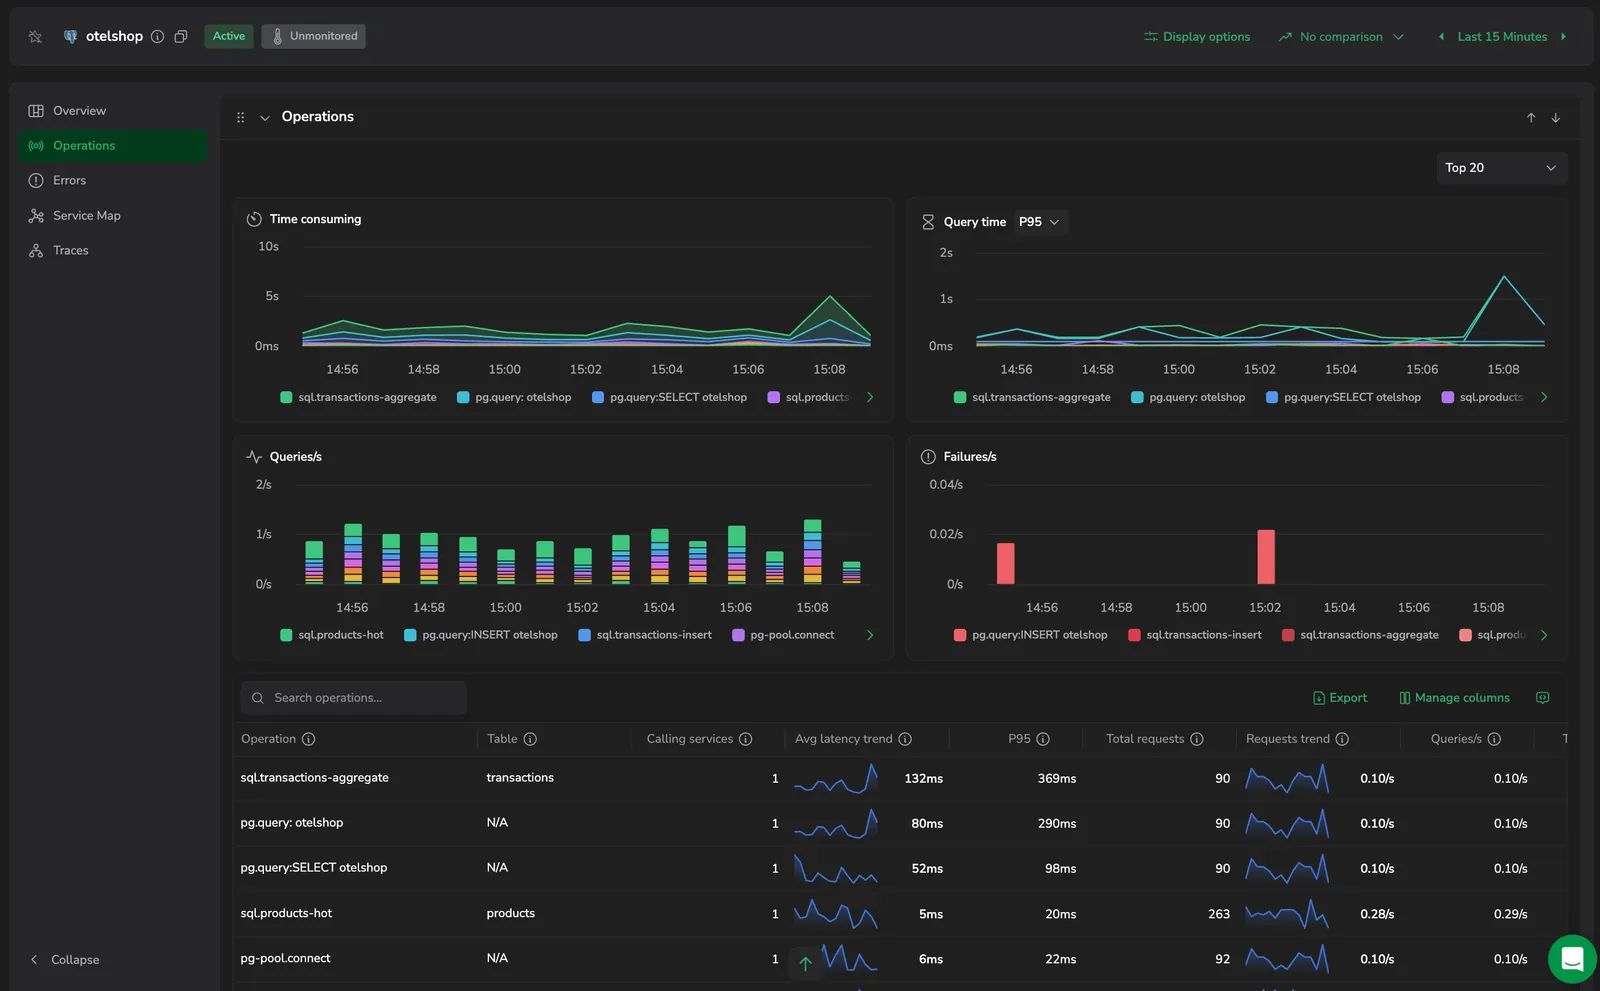
Charts
Four charts summarize the selected operations:
- Time consuming: cumulative time spent per operation. The tallest bands are the operations the database spends the most time on.
- Query time: query duration per operation at a selected percentile (Avg, P50, P75, P90, P95, or P99).
- Queries/s: query throughput per operation.
- Failures/s: failed queries per second, per operation.
Operations table
The table below the charts lists each operation with:
- Operation: the database operation or command that ran.
- Table: the table or collection the operation targeted.
- Calling services: how many services issued the operation.
- Avg and P50-P99: query response time, on average and by percentile.
- Total queries and Queries/s: query volume and throughput.
- Total failures, Failure rate, Failures/s, and Failures/min: failed-query counts and rates.
- Total time spent: the operation's share of total query time over the selected range.
Use Search operations to find one by name, Manage columns to choose which columns show, and Export to download the table.
Operation drilldown
Select an operation - by selecting its row, or with Enter or Space - to open a drawer scoped to that one operation.
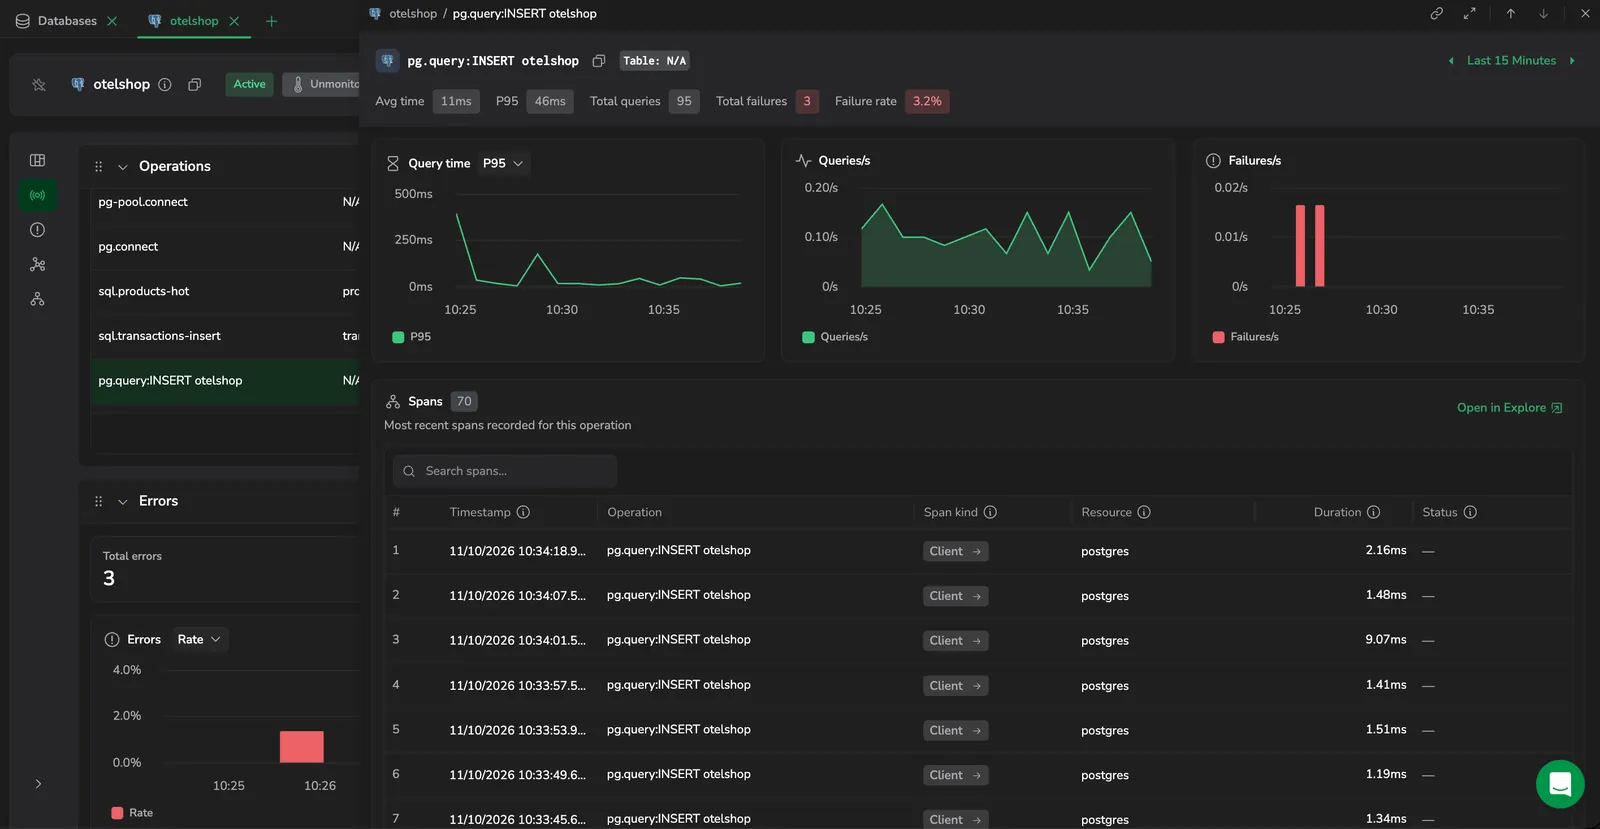
The drawer's header carries the operation and table names with their own time picker, and a toolbar with Copy operation name, Copy link, expand, Previous operation / Next operation, and close. Copy link produces a deep link that reopens the drawer.
The drawer then reports five metrics for the operation - Avg time, P95, Total queries, Total failures, and Failure rate - alongside three charts:
- Query time: response time at a percentile you select.
- Queries/s: query throughput for the operation.
- Failures/s: failed queries per second.
At the bottom, a spans table lists the most recent spans recorded for the operation, so you can inspect an individual query and open the trace it belongs to.
Next steps
Triage a database's failing queries in Errors.