Profile a service
The Profiling tab brings Continuous Profiling into the entity drilldown. It shows a service's CPU usage over time and a flame graph of exactly where that time is spent - down to the function and library frame - scoped to the service, environment, and time range you're already looking at, so you can move from a latency or CPU spike to the code behind it without leaving APM.
Use it to:
- Find what's burning CPU: read the flame graph to see which functions and libraries dominate the service's CPU time.
- Tie a spike to code: line up a rise in the CPU chart with a deployment or configuration change, then drill into the profile for that window.
- Separate your code from the runtime: filter to your own frames to skip runtime and library noise.
- Compare against a baseline: overlay an earlier period to see whether a profile shifted after a change.
What you need
- Coralogix Application Performance Monitoring (APM) installed and configured.
- Continuous Profiling set up for the service, so it reports profiles. Profiling is available for services.
Access the Profiling tab
- In your Coralogix toolbar, select APM.
- Select a service to open its drilldown, then select the Profiling tab.
If the service isn't sending profiles at all, the tab shows an onboarding card with a link to set up Continuous Profiling. If it reports profiles but none fall in the selected time range, it shows a No profiling data empty state instead.
Profile type
A toggle at the top of the tab selects which profile type to view. CPU profiling is the default; when the service collects memory profiles, switch to a memory type (such as allocated bytes) to profile allocations instead. The available types depend on what the service reports - see Supported languages.
CPU over time
The CPU over time chart plots the service's CPU usage, in cores, across the selected range. Annotations - deployments, alerts, and configuration changes - overlay the chart so you can align a shift in CPU with what caused it, and when you compare to an earlier period the comparison window is drawn as a dashed overlay.
Select a point or drag a range on the chart to focus the flame graph below on that window.
Profiles
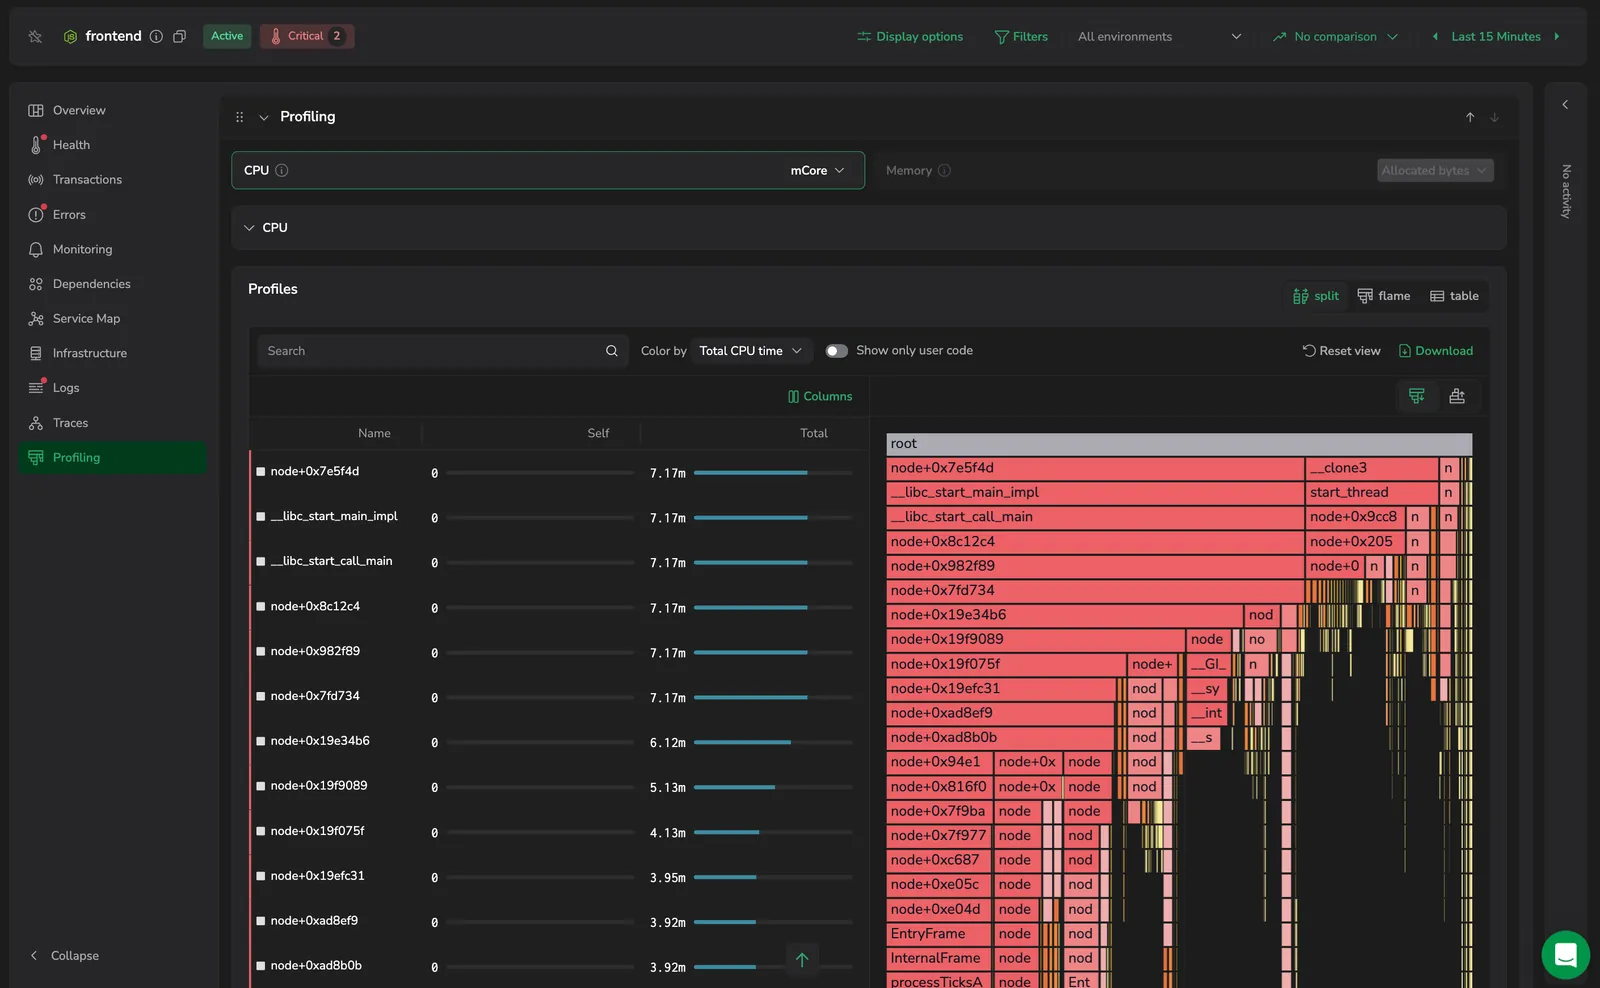
The Profiles section renders the profile as a flame graph and a frame table. Switch how they're arranged with the view toggle:
- Split: the frame table and the flame graph side by side.
- Flame: the flame graph only.
- Table: the frame table only.
The frame table lists each frame with its Self time (spent in the frame itself) and Total time (the frame plus everything it calls). The flame graph shows the call tree from root down, with each frame's width proportional to its time.
Controls above the profile:
- Search: highlight frames by name.
- Color by: choose the metric the flame graph is colored by, such as Total CPU time.
- Show only user code: hide runtime and library frames to focus on your own code.
- Reset view: return the flame graph to its default zoom.
- Download: export the profile.
- Analyze: open an Olly explanation of the current flame graph in a side panel. Olly reads the profile for the service, environment, and time range you're viewing and describes where the time goes; rate the explanation with thumbs up or down. The panel closes when you change the scope.
For the full flame graph reference, see Profiles catalog.
Next steps
Continue with Serverless monitoring to monitor functions and other serverless components in APM.