Go runtime metrics
The Runtime tab in the APM entity drilldown shows a Go service's runtime internals - live goroutines, memory by type, allocation rate, the garbage collector's heap goal, and scheduling latency - on the same screen as its traces and span metrics.
Go services tend to fail quietly: goroutines leak on a blocked channel or a context whose cancellation never propagates, the scheduler starves for CPU well before request latency moves, and memory grows in ways only the collector's own heap goal reveals. The Runtime tab brings those signals into APM.
Use it to:
- Catch a goroutine leak: watch Live goroutines climb with no plateau.
- See CPU starvation early: Scheduling latency rises before request latency does.
- Tell retention from churn: read the GC heap goal against the Allocation rate.
- Isolate one bad instance: use the instances filter and the per-instance heatmap.
What you need
- Coralogix APM installed, with a Go service reporting to it.
- Go runtime instrumentation: the OpenTelemetry
go.opentelemetry.io/contrib/instrumentation/runtimepackage, exporting over OTLP, withservice.nameandk8s.pod.nameon the metrics. For the full setup, see Send Go runtime metrics.
The section appears only for a service whose detected language is Go and that is reporting Go runtime metrics. A Go service not yet reporting shows a zero state with setup steps; databases never show it.
A few metrics in the OpenTelemetry Go specification - the GC cycle count, GC pause duration, and CPU time - are not emitted by the contrib instrumentation yet, so the panels that would use them do not appear.
Layout
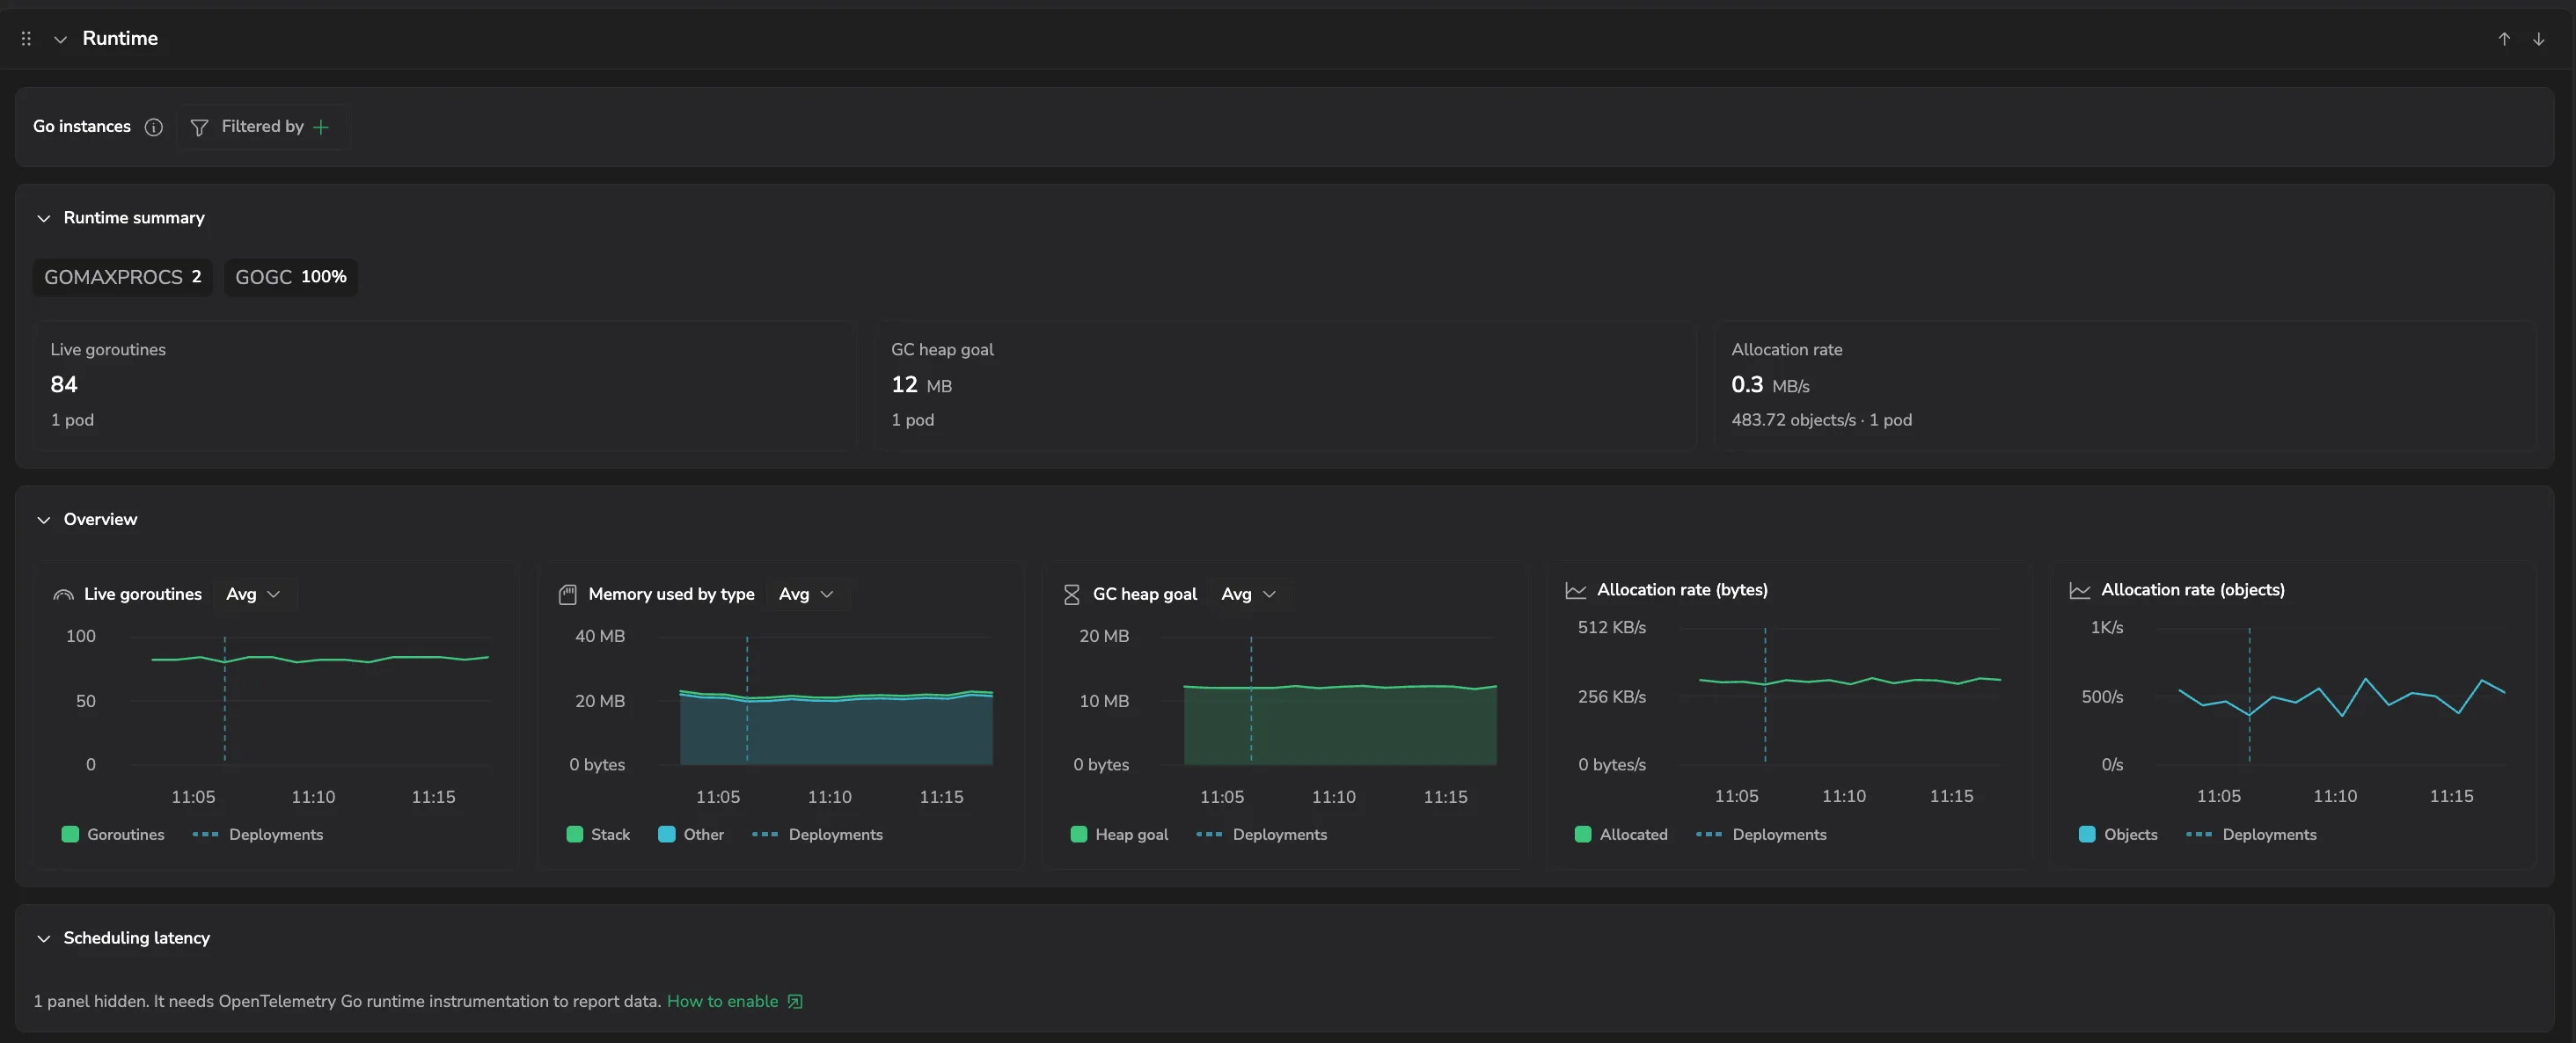
Open the Runtime tab for a Go service to load a Go instances filter at the top (it defaults to all instances, aggregated), above a set of collapsible sections: Instance heatmap, Runtime summary, Overview, and Scheduling latency. A panel or summary card with no data to plot is hidden rather than drawn empty.
Instance heatmap
Shown when more than one instance reports. Each row is one instance, color-coded by severity; select a row to filter every panel below to that instance. Columns: Goroutines, Scheduling latency P99, and GC heap goal.
Runtime summary
Starts with the process configuration as pills - GOMAXPROCS (the CPU limit in effect), GOGC (the GC target percentage), and GOMEMLIMIT (the soft memory limit, shown only when one is set) - followed by four at-a-glance cards: Live goroutines, Scheduling latency P99, GC heap goal, and Allocation rate (its subtitle also shows the object allocation rate).
Overview
| Panel | What it shows |
|---|---|
| Live goroutines | Goroutines currently running. A steady climb with no plateau is a leak; a sawtooth that tracks traffic is normal. |
| Memory used by type | Memory in use, split into goroutine stacks and everything else. A growing "other" share under flat traffic is retention, not churn. |
| GC heap goal | The heap size the collector is aiming for (derived from GOGC). Climbing under steady load means retained memory is growing. |
| Allocation rate (bytes) | Bytes allocated per second. Flat here while memory grows points to retention rather than allocation pressure. |
| Allocation rate (objects) | Objects allocated per second. High counts with low byte volume mean small-object churn, which costs GC CPU out of proportion to the memory. |
Scheduling latency
Scheduling latency charts how long a runnable goroutine waits for a processor - the earliest sign the service is starved of CPU, and it moves before request latency. Select which percentiles to plot (P50, P75, P90, P95, P99; P50, P90, and P99 by default). A rising P99 with a flat P50 is bursts of work exceeding GOMAXPROCS; both rising is sustained starvation.
Next steps
To start sending these metrics to the tab, see Send Go runtime metrics.