Node.js runtime metrics
The Runtime tab in the APM entity drilldown shows a Node.js service's runtime internals - event loop utilization and delay, V8 heap and memory, and garbage collection - on the same screen as its traces and span metrics.
A Node.js service is single-threaded where it counts: one event loop runs the application code, and V8 stops it periodically to collect garbage. Most "the service got slow and nothing in the traces explains it" stories come down to one of those two - the loop is saturated or blocked, or the heap has grown to the point where major collections dominate. The Runtime tab makes both visible.
Use it to:
- See if the process keeps up: Event loop utilization and delay answer whether the loop is saturated or blocked.
- Find a heap leap: a heap floor that keeps rising after each collection is a leak.
- Catch GC pressure: GC time share above roughly 5-10% is a red flag.
- Isolate one bad instance: use the instances filter and the per-instance heatmap.
What you need
- Coralogix APM installed, with a Node.js service reporting to it.
- Node.js runtime instrumentation: the OpenTelemetry
@opentelemetry/instrumentation-runtime-nodepackage, exporting over OTLP, withservice.nameandk8s.pod.nameon the metrics. For the full setup, see Send Node.js runtime metrics.
The section appears only for a service whose detected language is Node.js and that is reporting Node.js runtime metrics. A Node.js service not yet reporting shows a zero state with setup steps; databases never show it.
Layout
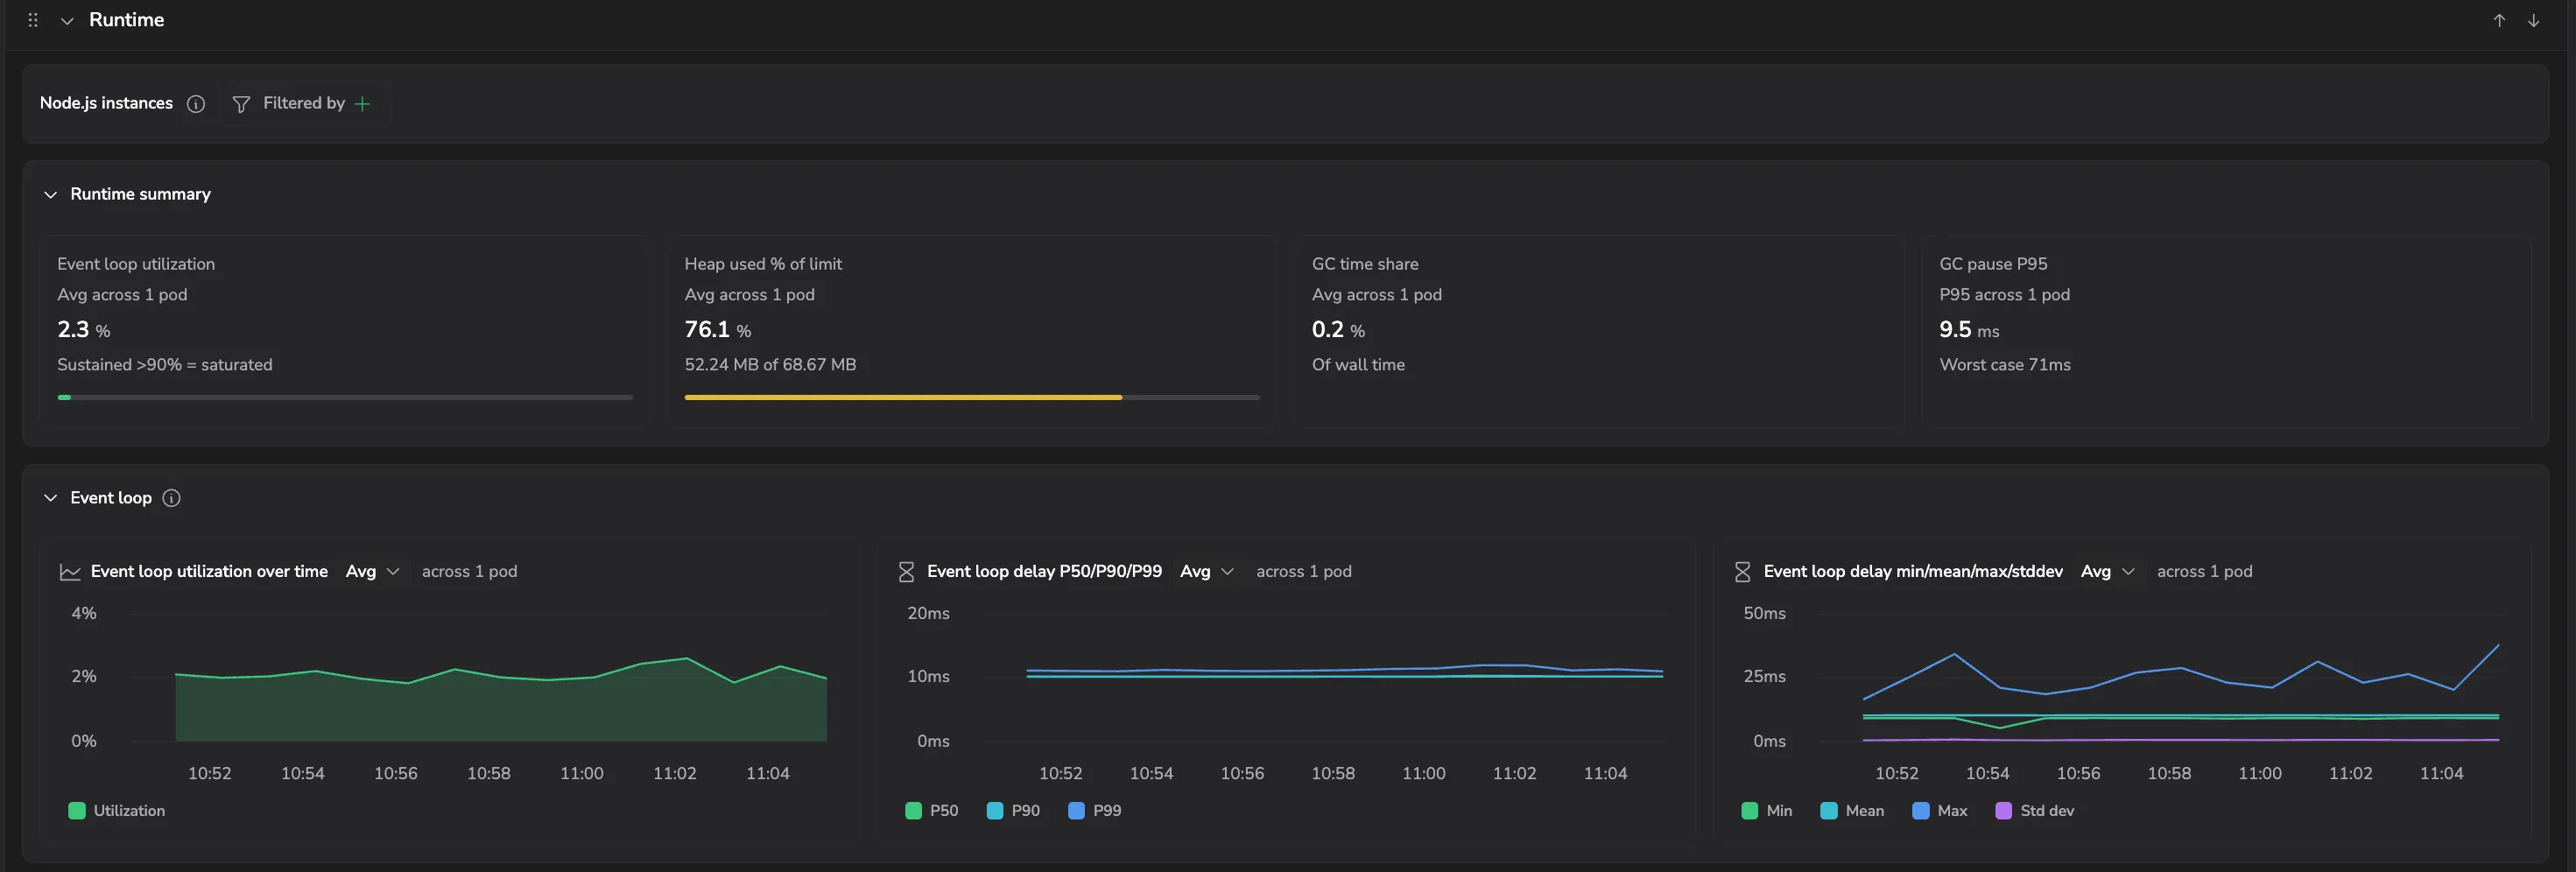
Open the Runtime tab for a Node.js service to load a Node.js instances filter at the top (it defaults to all instances, aggregated), above a set of collapsible sections: Instance heatmap, Runtime summary, Event loop, Heap and memory, and Garbage collection. A panel or summary card with no data to plot is hidden rather than drawn empty.
Instance heatmap
Shown when more than one instance reports. Each row is one instance, color-coded by severity; select a row to filter every panel below to that instance. Columns: Throughput, Latency P95, Event loop util %, Loop delay P99, Heap % of limit, and GC time %.
Runtime summary
Four at-a-glance cards: Event loop utilization, Heap used % of limit, GC time share, and GC pause P95.
Event loop
| Panel | What it shows |
|---|---|
| Event loop utilization over time | Share of time the loop is busy rather than idle. Sustained above 90-95% means the process can't keep up: scale out, move CPU-heavy work to worker threads, or optimize hot paths. |
| Event loop delay P50/P90/P99 | How long a scheduled callback waits before it runs. A low P50 with a spiky P99 is intermittent blocking (a slow synchronous call, a big parse, a crypto operation), not sustained overload. |
| Event loop delay min/mean/max/stddev | The baseline shape of the delay. A high max with a high standard deviation means occasional large blocking operations hidden inside an otherwise healthy average. |
Heap and memory
| Panel | What it shows |
|---|---|
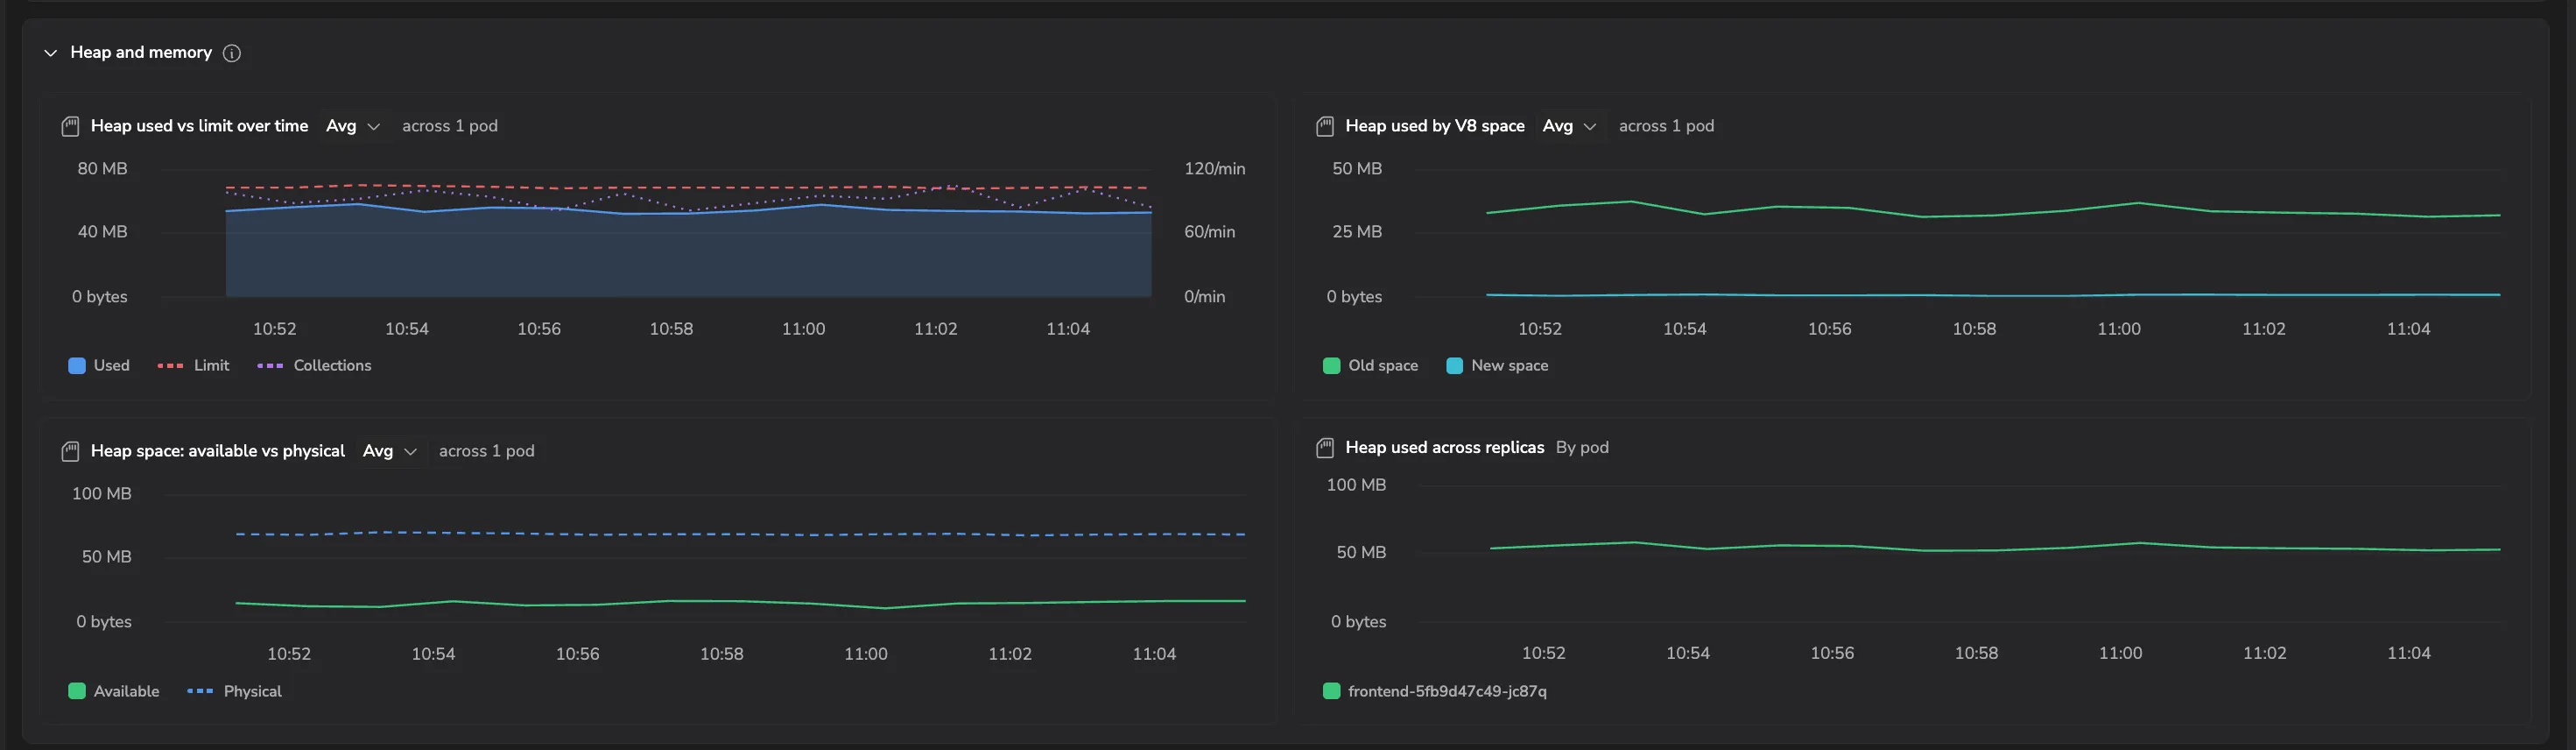
| Heap used vs limit over time | The classic leak chart. A sawtooth (climbs, then GC drops it) is healthy; a rising floor, where each GC recovers less than the last, is a leak. Collections are overlaid on the right axis. |
| Heap used by V8 space | Old space vs new space. New space churn is normal; old space that grows and doesn't shrink back is the real leak signal. |
| Heap space: available vs physical | Available trending to zero while physical keeps growing means V8 keeps expanding the heap - either the working set grew, or memory is leaking. |
| Heap used across replicas | Heap used by each replica. One line pulling away from the rest flags a single pod leaking or running hot while its siblings are healthy. |
Garbage collection
| Panel | What it shows |
|---|---|
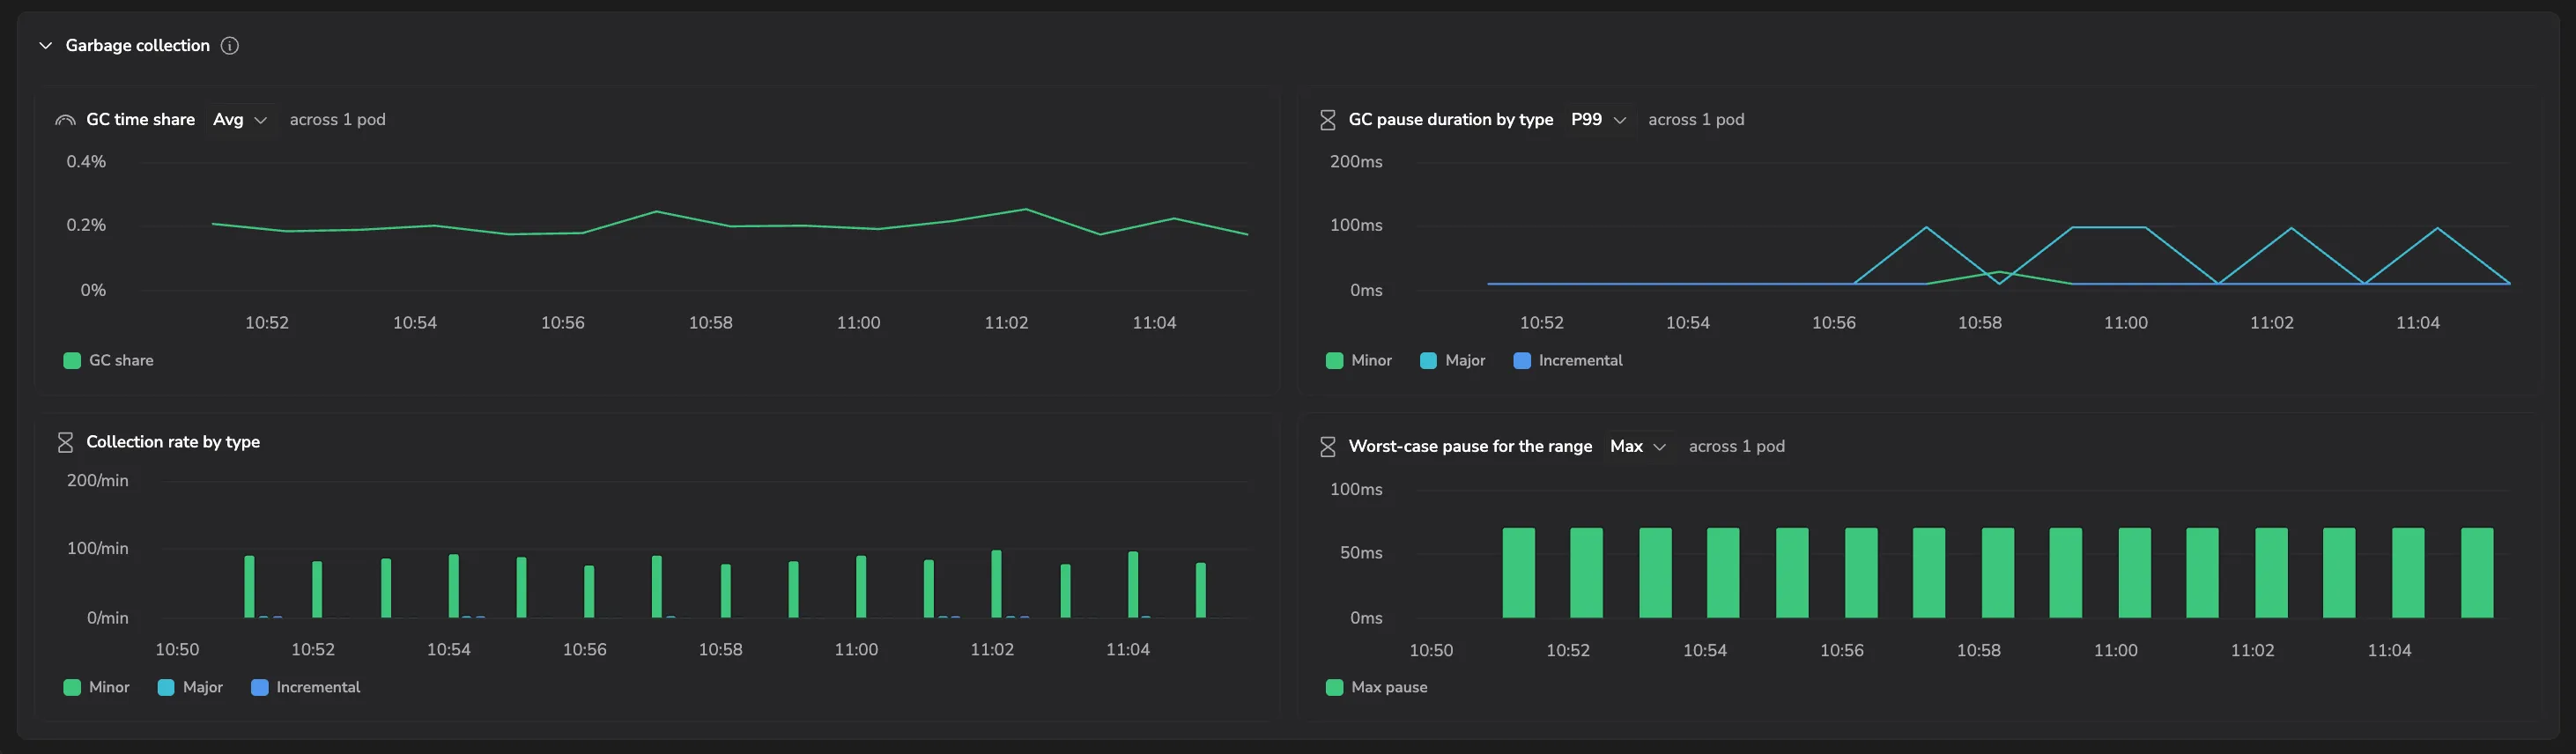
| GC time share | Share of wall-clock time spent collecting garbage instead of running application code. Sustained above 5-10% is a red flag, usually a leak or an allocation-heavy hot path. |
| GC pause duration by type | Long minor pauses mean a high allocation rate; long major pauses mean old space has grown large (the leak signature); a rising incremental rate is an early warning of major GC pressure. |
| Collection rate by type | Read alongside pause by type. A high minor count with short pauses is busy but healthy; a rising major count means the collector is working harder to reclaim space. |
| Worst-case pause for the range | The longest stop-the-world pause in each interval. A 200 ms GC pause shows up as a 200 ms latency bump for every request in flight at that moment. |
Next steps
To start sending these metrics to the tab, see Send Node.js runtime metrics.