Python runtime metrics
The Runtime tab in the APM entity drilldown shows a Python service's runtime internals - CPU, resident memory, thread count, garbage collection by generation, and CPU and memory detail - on the same screen as its traces and span metrics.
A Python service can degrade in ways the traces don't explain: memory climbing without coming back down, threads piling up, the interpreter spending its time in garbage collection, or the global interpreter lock (GIL) turning a busy process into a queue. The Runtime tab surfaces those signals.
Use it to:
- Tell a leak from churn: watch Resident memory against generation 2 collections.
- Catch thread buildup: a Thread count that only rises means threads never finish.
- Spot GIL and scheduling contention: rising involuntary context switches.
- Isolate one bad instance: use the instances filter and the per-instance heatmap.
What you need
- Coralogix APM installed, with a Python service reporting to it.
- Python runtime instrumentation: the OpenTelemetry
opentelemetry-instrumentation-system-metricspackage, exporting over OTLP, withservice.nameandk8s.pod.nameon the metrics. For the full setup, see Send Python runtime metrics.
The section appears only for a service whose detected language is Python and that is reporting Python runtime metrics. A Python service not yet reporting shows a zero state with setup steps; databases never show it.
Python runtime metrics do not yet have an official OpenTelemetry semantic-convention specification - they come from a contrib instrumentation package. CPython also reports no garbage-collection overhead metric, so the Runtime tab has no GC-overhead panel for Python (unlike Java).
Layout
Open the Runtime tab for a Python service to load a Python instances filter at the top (it defaults to all instances, aggregated), above a set of collapsible sections: Instance heatmap, Runtime summary, Overview, Garbage collection, and CPU and memory detail. A panel or summary card with no data to plot is hidden rather than drawn empty. Memory values are shown in MB (binary MiB under the hood).
Instance heatmap
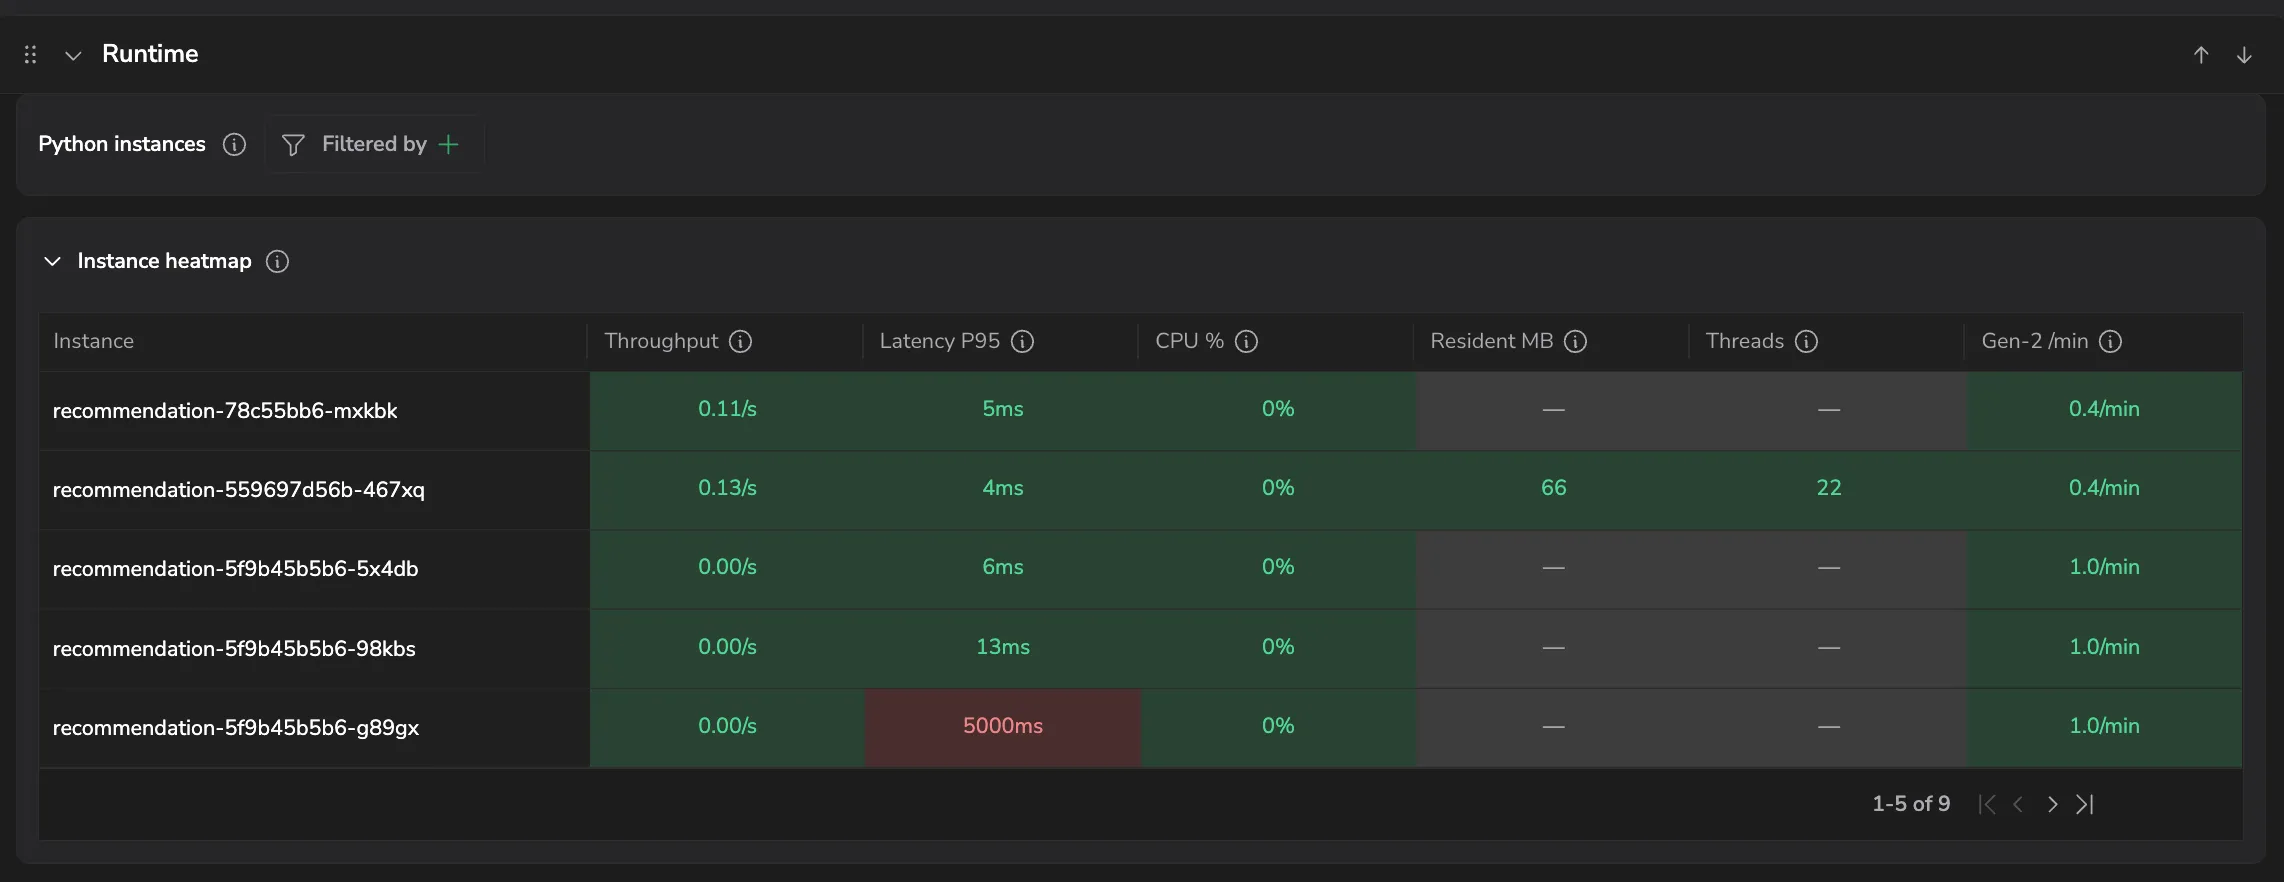
Shown when more than one instance reports. Each row is one instance, color-coded by severity; select a row to filter every panel below to that instance. Columns: Throughput, Latency P95, CPU %, Resident MB, Threads, and Gen-2 /min.
Runtime summary
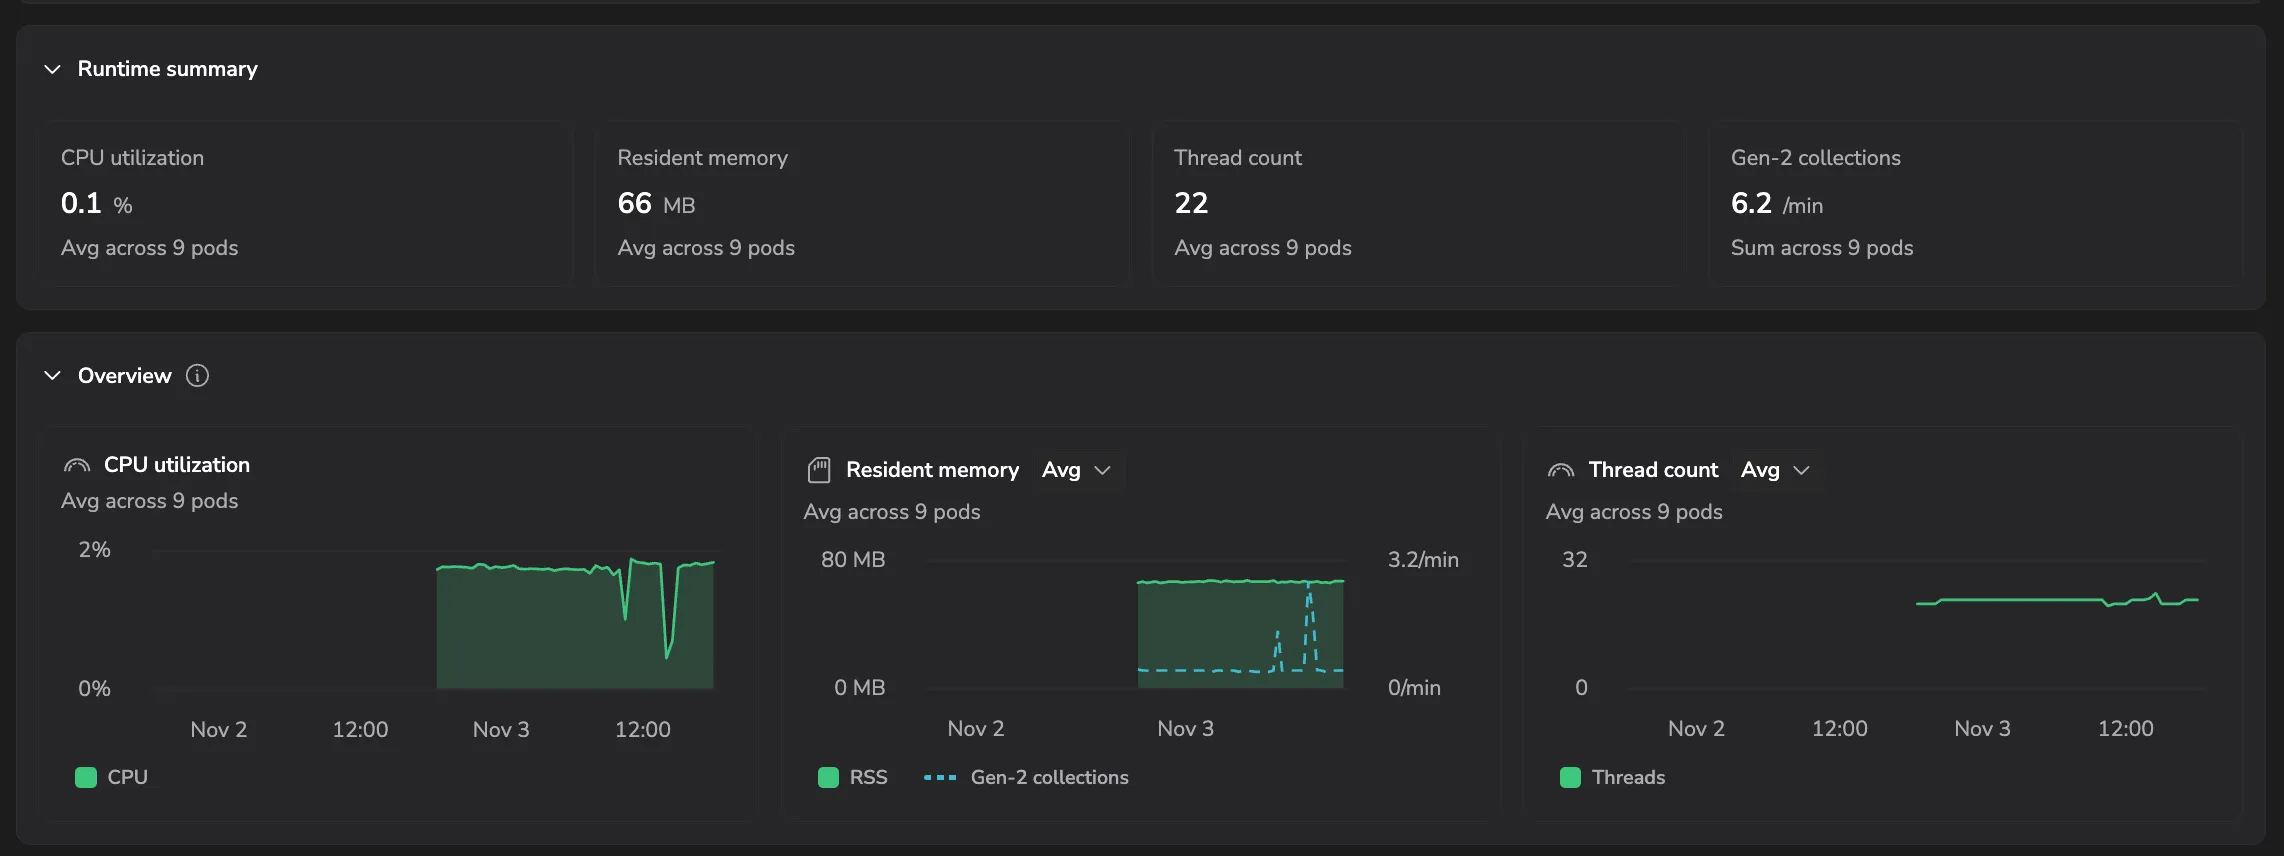
Four at-a-glance cards: CPU utilization (share of one core), Resident memory, Thread count, and Gen-2 collections (per minute across the service).
Overview
| Panel | What it shows |
|---|---|
| CPU utilization | Share of one CPU core the process used, averaged across instances. A process near 100% is saturating a core under the GIL, so adding threads won't help. |
| Resident memory | Memory the process holds in RAM, with generation 2 collections per minute on a second axis. RSS that keeps climbing while gen-2 collections run is objects being retained. |
| Thread count | Live threads in the process. A count that keeps rising means threads are started and never finish. |
Garbage collection
| Panel | What it shows |
|---|---|
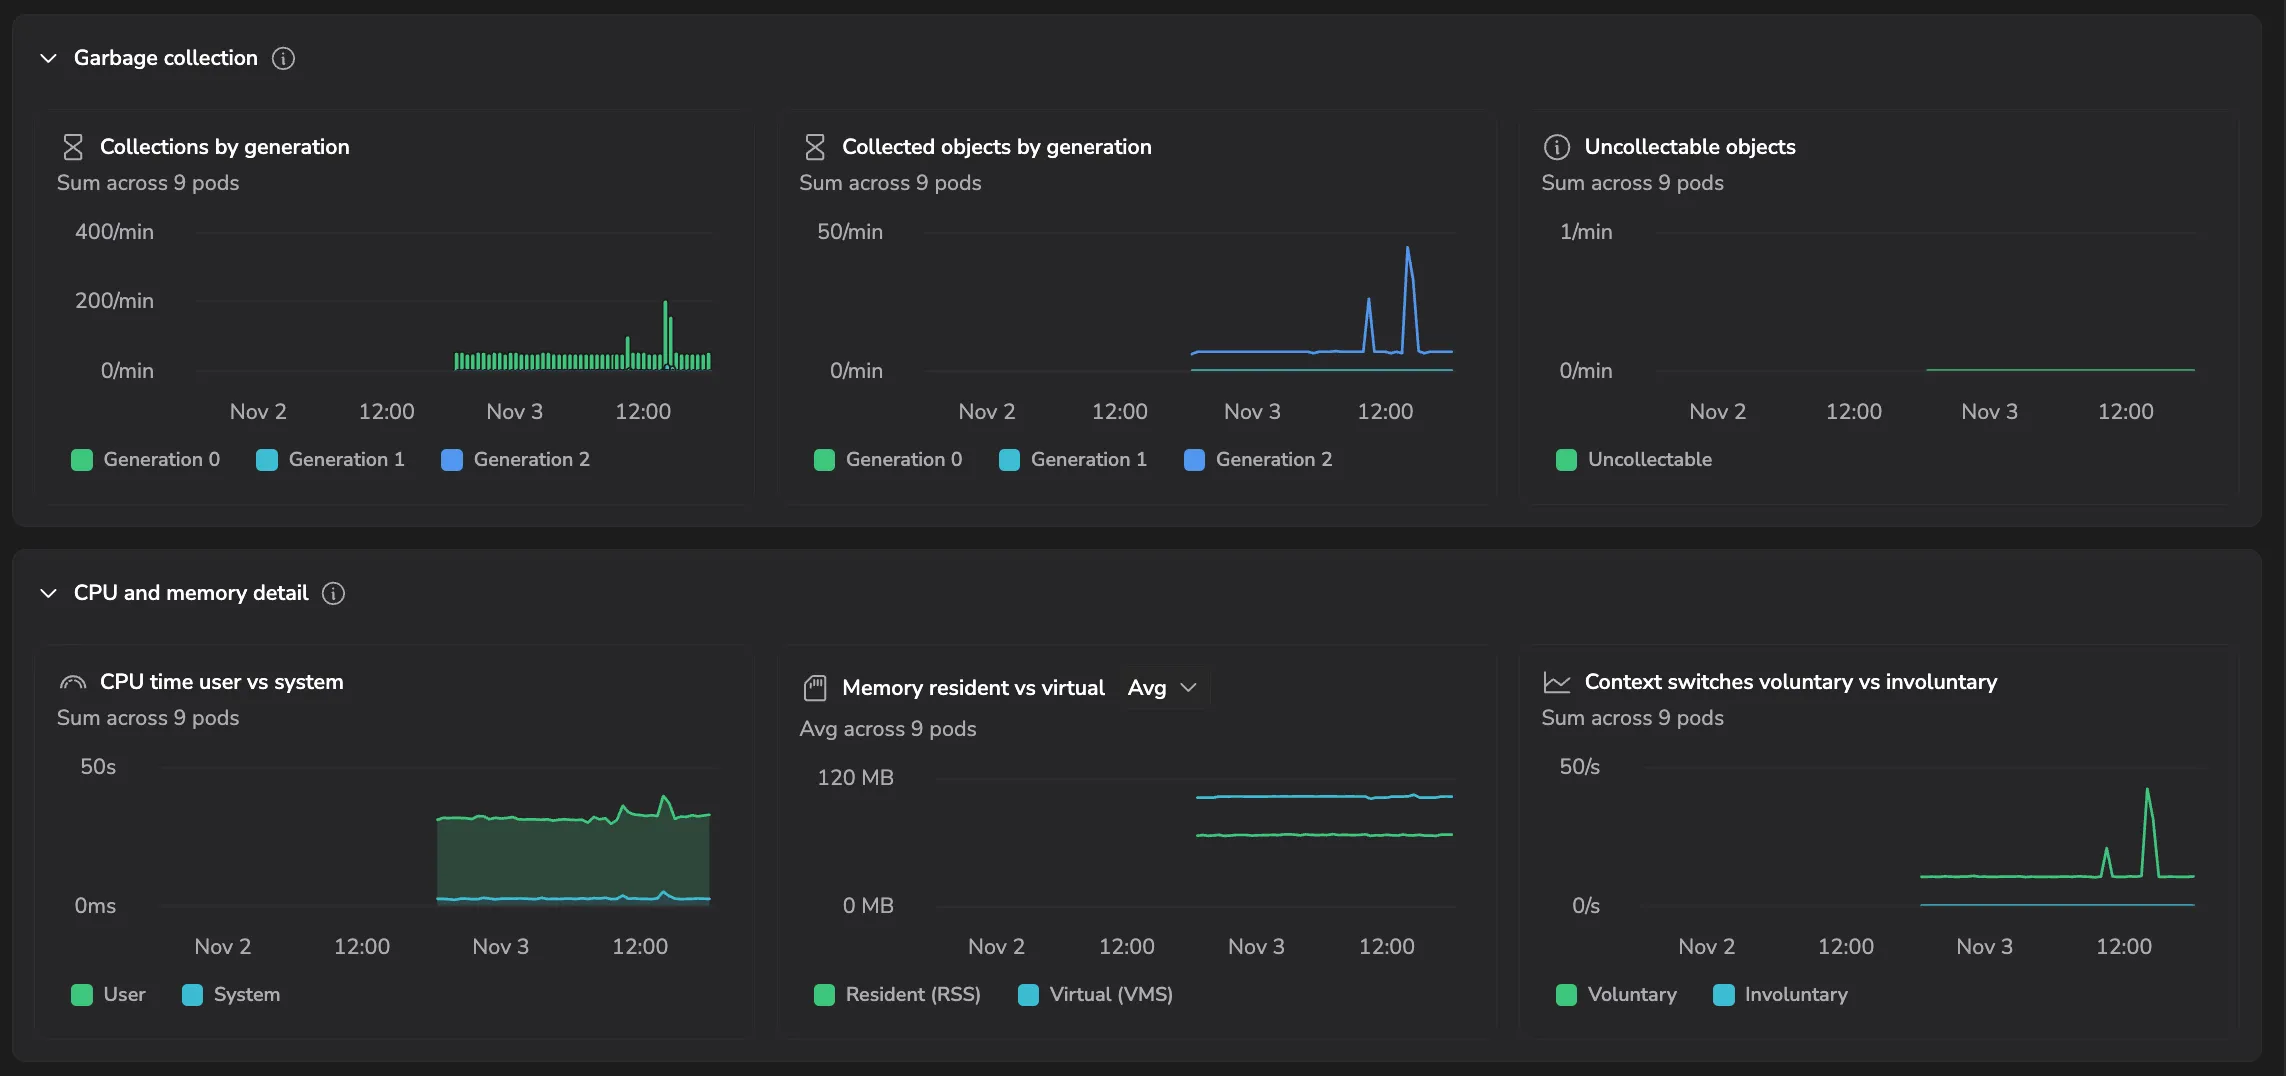
| Collections by generation | Collection runs per minute, by generation. Frequent generation 0 collections are normal churn; generation 2 climbing means objects survive to the oldest generation - how retention shows up. |
| Collected objects by generation | Objects freed per minute, by generation. Most should die young in generation 0; a generation 2 that collects little while memory grows means objects are retained. |
| Uncollectable objects | Objects per minute the collector found but couldn't free, usually reference cycles. This should stay at zero - any steady value is a leak that needs a code change. |
CPU and memory detail
| Panel | What it shows |
|---|---|
| CPU time user vs system | CPU seconds used per interval, split by where they were spent. System time growing faster than user time points at the kernel: heavy I/O, many small syscalls, or memory pressure. |
| Memory resident vs virtual | Resident (RSS) is what the process holds in RAM; virtual (VMS) includes everything it has mapped. RSS climbing without coming down is a leak; VMS growing alone is usually allocator reservations. |
| Context switches voluntary vs involuntary | Times per second the process gave up the CPU. Voluntary switches track I/O and lock waits; involuntary switches climbing is the readable sign of GIL and scheduling contention. |
Next steps
To start sending these metrics to the tab, see Send Python runtime metrics.