Monitor service health
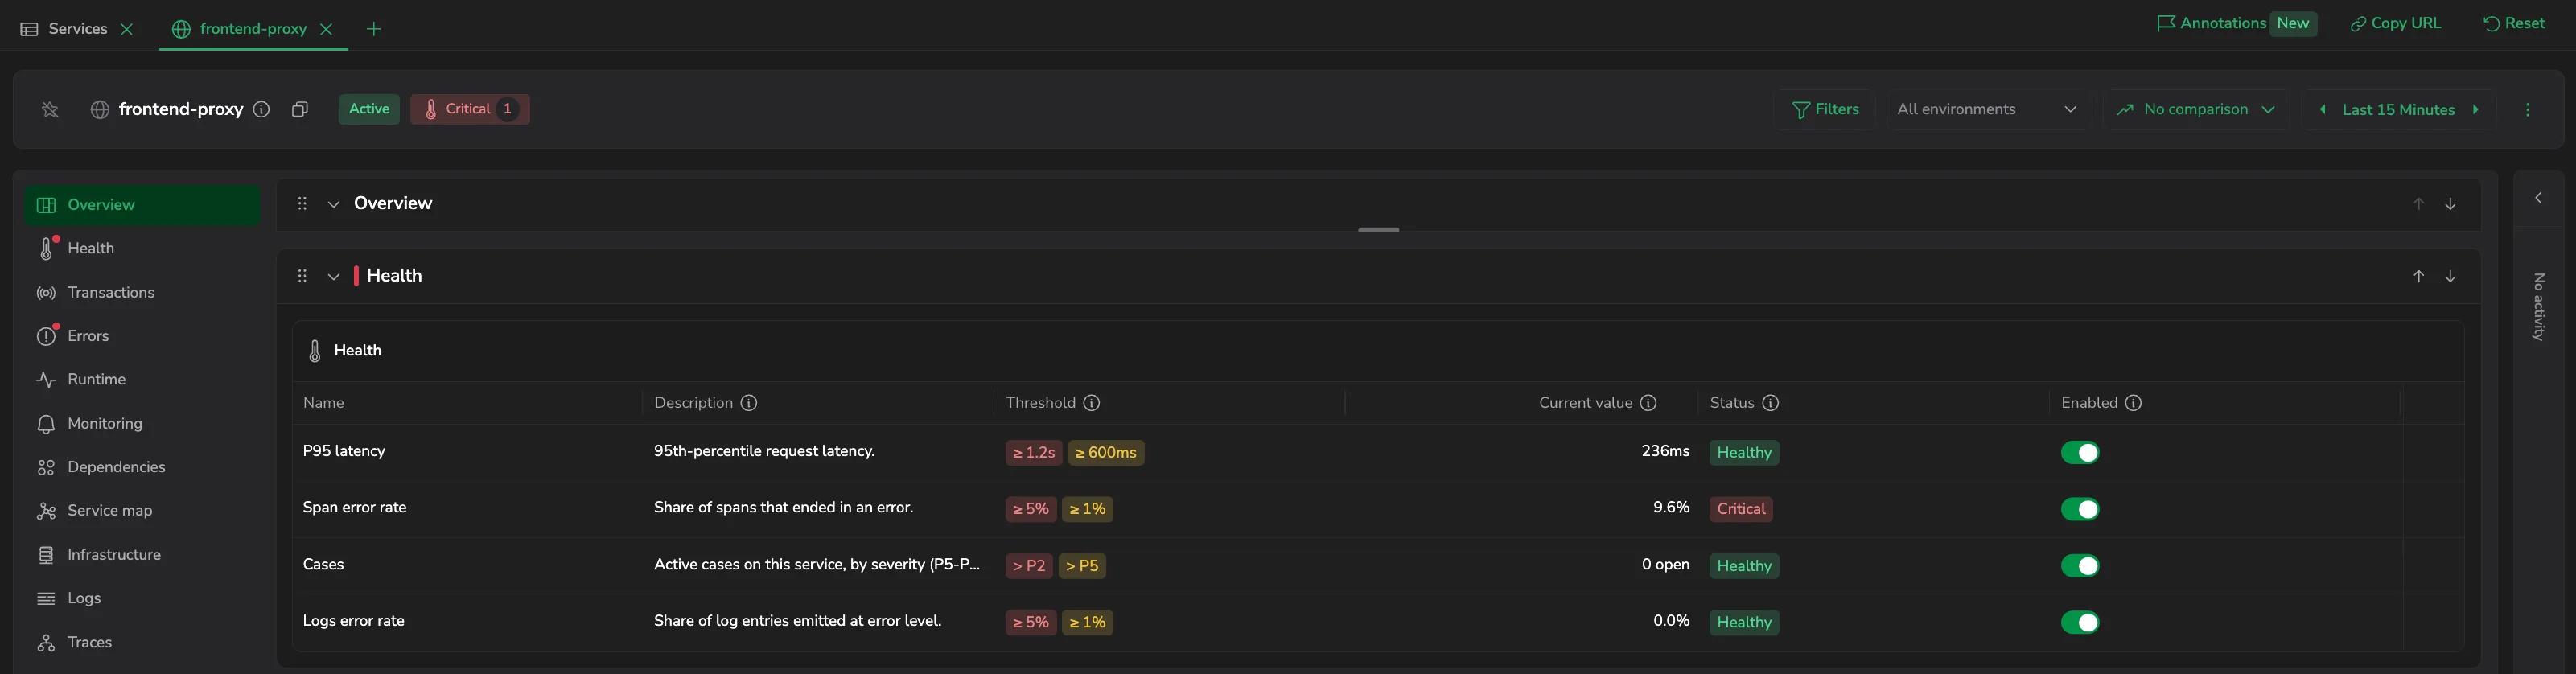
APM rolls every health signal for a service into a single state - shown in the service catalog and on the service itself - so you can tell at a glance which services need attention. The Health tab explains that state: it lists the monitoring policies behind it and lets you tune the thresholds that decide it. The Health tab is available for services.
Use it to:
- Triage fast: see whether a service is critical or warning, and which policy is driving the state.
- Tune health to your service: adjust the warning and critical thresholds so the state reflects real user impact.
- Set an account-wide baseline: save a policy for every service, then override it per service where it needs different thresholds.
- Act on a breach: jump from a policy straight to an alert, its query, the Metric Explorer, or the service's cases.
What you need
- Coralogix Application Performance Monitoring (APM) installed and configured.
- Span Metrics enabled for the service: the latency and error rate policies read span metrics.
- The logs error rate policy evaluates logs correlated to the service, and the cases policy evaluates cases open on it. A policy shows as Unavailable until its data is available.
Health states
- Critical: at least one policy is breached.
- Warning: at least one policy is at risk.
- Healthy: every policy is within range.
- Unavailable: no policy evaluates for the service yet: either none is enabled, or none has data to evaluate.
A service's overall state is the worst state across its policies: a single critical policy makes the whole service critical. In the drilldown, the Health policies section header summarizes the tab as a count of how many policies are critical, warning, healthy, and unavailable.
Access the Health tab
- In your Coralogix toolbar, select APM.
- Select a service to open its drilldown, then select the Health tab.
The Health tab is available for services. Databases don't have it.
Health policies
APM evaluates a set of predefined policies against each service. Each policy compares a metric to a warning and a critical threshold over a rolling time window. The Health tab lists four:
| Policy | What it measures |
|---|---|
| Latency | Request latency at the selected aggregation. The row is named for the aggregation in force, such as P95 latency. |
| Error rate | Share of spans that ended in an error. |
| Cases | Active cases on the service, by severity (P5-P1). |
| Logs error rate | Share of log entries emitted at error level. |
These are the four policies the Health tab tunes. A service's health badge in the catalog can also reflect its apdex score and SLO compliance - both configured elsewhere, and neither appears as a policy here.
The Health table
The Health tab lists every policy in a table with these columns:
- Name: the policy. The latency row is named for its aggregation: for example, P95 latency.
- Description: what the policy monitors.
- Threshold: the policy's warning and critical thresholds.
- Current value: the policy's live value over the selected time range. The Cases policy shows a count of open cases.
- Status: Healthy, Warning, Critical, or Unavailable.
- Enabled: a toggle that turns the policy on or off.
Enable or disable a policy
Use the Enabled toggle to turn a policy on or off in place. Turning one off opens a Disable policy? confirmation - This policy will no longer affect Service Health. You can re-enable it at any time. Select Disable policy to confirm, or Discard changes to leave it on. A disabled policy stops affecting health and shows as Unavailable until you re-enable it.
More actions
Each row's More actions menu offers:
- Edit policy: open the policy editor to change how the policy decides health. See Tune a policy.
- View query: show the query behind the policy.
- Create alert: create a metric alert from the policy's query.
- Open in Metric Explorer: open the policy's metric in the Metric Explorer.
- View cases: open the service's cases. This appears for the Cases policy only.
Which items appear also depends on your permissions - see Permissions.
Tune a policy
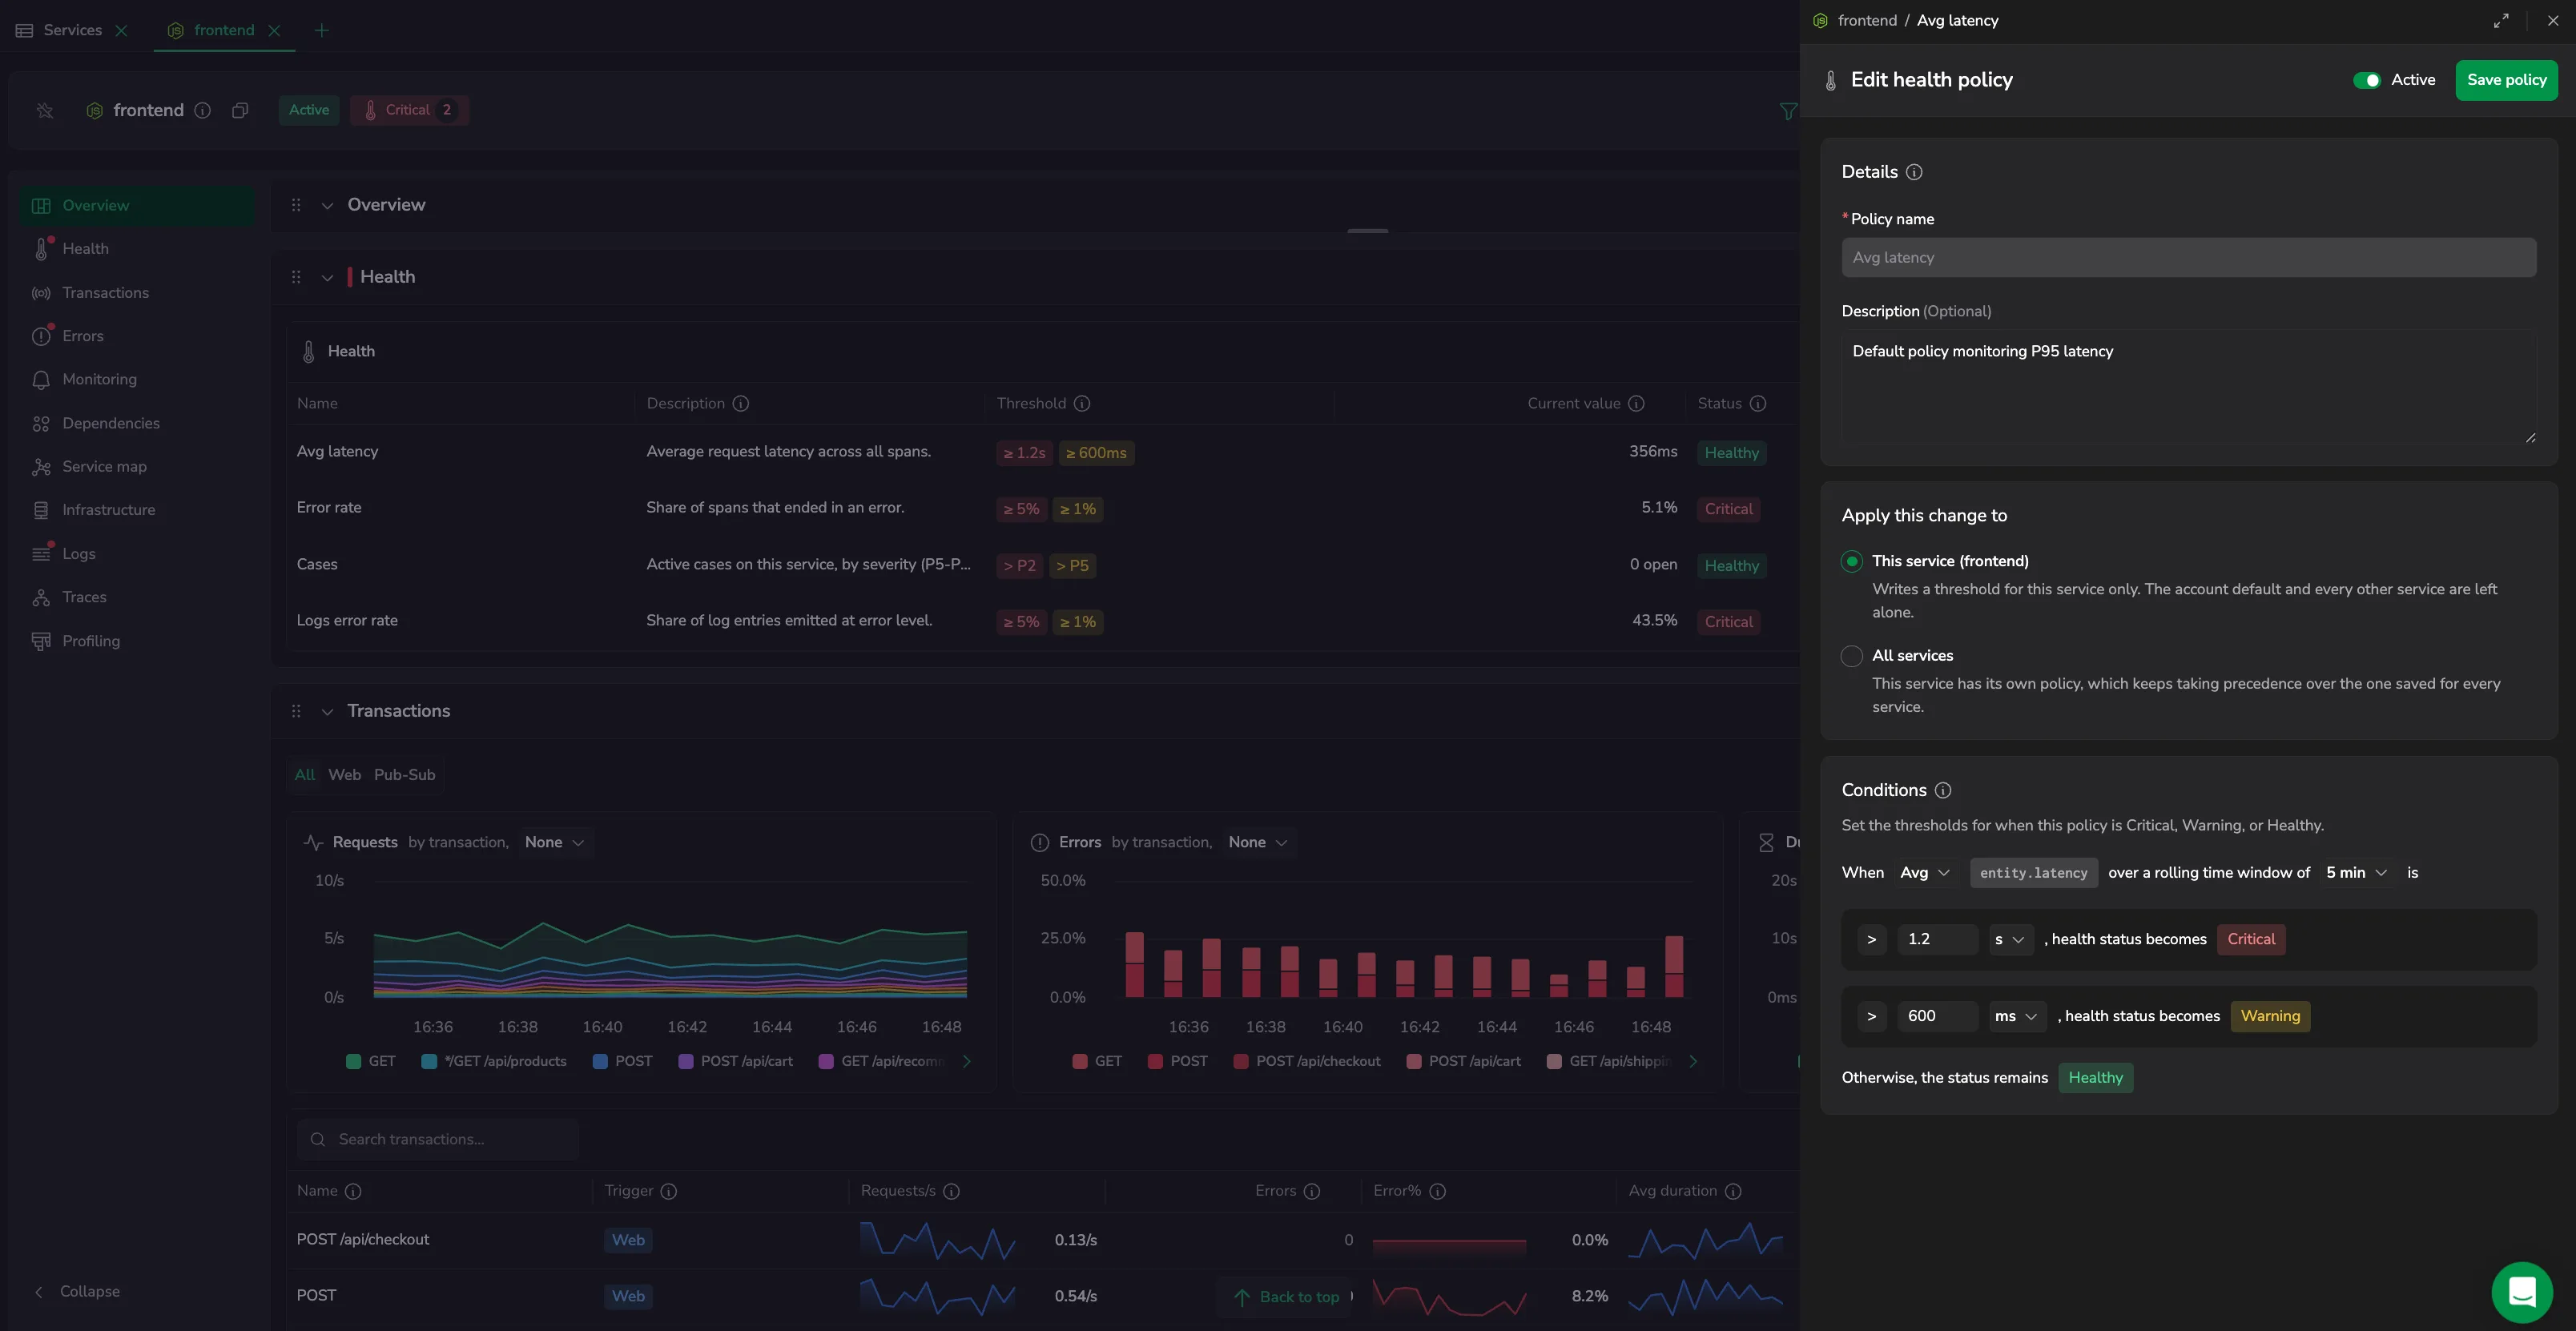
Select a policy row (or press Enter), or use More actions then Edit policy, to open Edit health policy - a drawer that changes how a policy decides the service's health. Its toolbar has a breadcrumb, Full screen (and Exit full screen) to expand the drawer, and Close. The editor sets:
- Details: the policy name (read-only) and an optional description.
- Apply this change to: choose This service (name) to write a threshold for this service only, leaving the account default and every other service untouched, or All services to save the policy as the account default used by every service that has no policy of its own. A service's own policy always takes precedence over the account default.
- Conditions: a condition reads When {aggregation} {metric} over a rolling time window of {window} is... For a latency policy, pick the aggregation (Avg, P90, P95, or P99) and the rolling time window (1 min, 5 min, 10 min, or 15 min), then set the value above which health status becomes Critical and the value above which it becomes Warning, each with a unit (μs, ms, or s); otherwise the status stays Healthy. The Cases policy sets a case priority (P1-P5) at each level and has no window. The warning threshold must be lower than the critical threshold.
- Active: a toggle that turns the policy on or off.
Select Save policy to apply your changes.
Permissions
Editing health policies requires permission to update the service catalog. Without it:
- Edit policy doesn't appear in the More actions menu.
- The Enabled toggle is disabled, with the tooltip You don't have permission to change health policies.
View cases, Create alert, and Open in Metric Explorer likewise appear only when you have the matching permission - to read cases, update metric alerts, or open the Metric Explorer.
Next steps
Break a service's performance down per transaction in Transactions.