Visualize your service dependencies
The Service map section in an entity's drilldown draws that entity's dependencies as a graph, built from your distributed traces - so you read how a service or database actually talks to the rest of your system, not from a diagram you maintain by hand. It focuses on one entity's upstream and downstream dependencies. For a system-wide map of every service at once, use the catalog's Map view.
Use it to:
- See your architecture as it really runs: read a dependency graph drawn from real traffic, not a hand-maintained diagram.
- Trace a problem's blast radius: follow the edges from a failing service to everything upstream and downstream of it.
- Spot a bottleneck: find the service, database, or dependency that the most traffic flows through.
- Jump straight to the evidence: open a service's overview, errors, or logs directly from the map.
What you need
- Coralogix Application Performance Monitoring (APM) installed and configured.
- Span (trace) data. The map is drawn from spans, so send spans, not only Span Metrics.
- Archived span data for the time range you view, because the section samples archived traces.
The Service map section in a drilldown
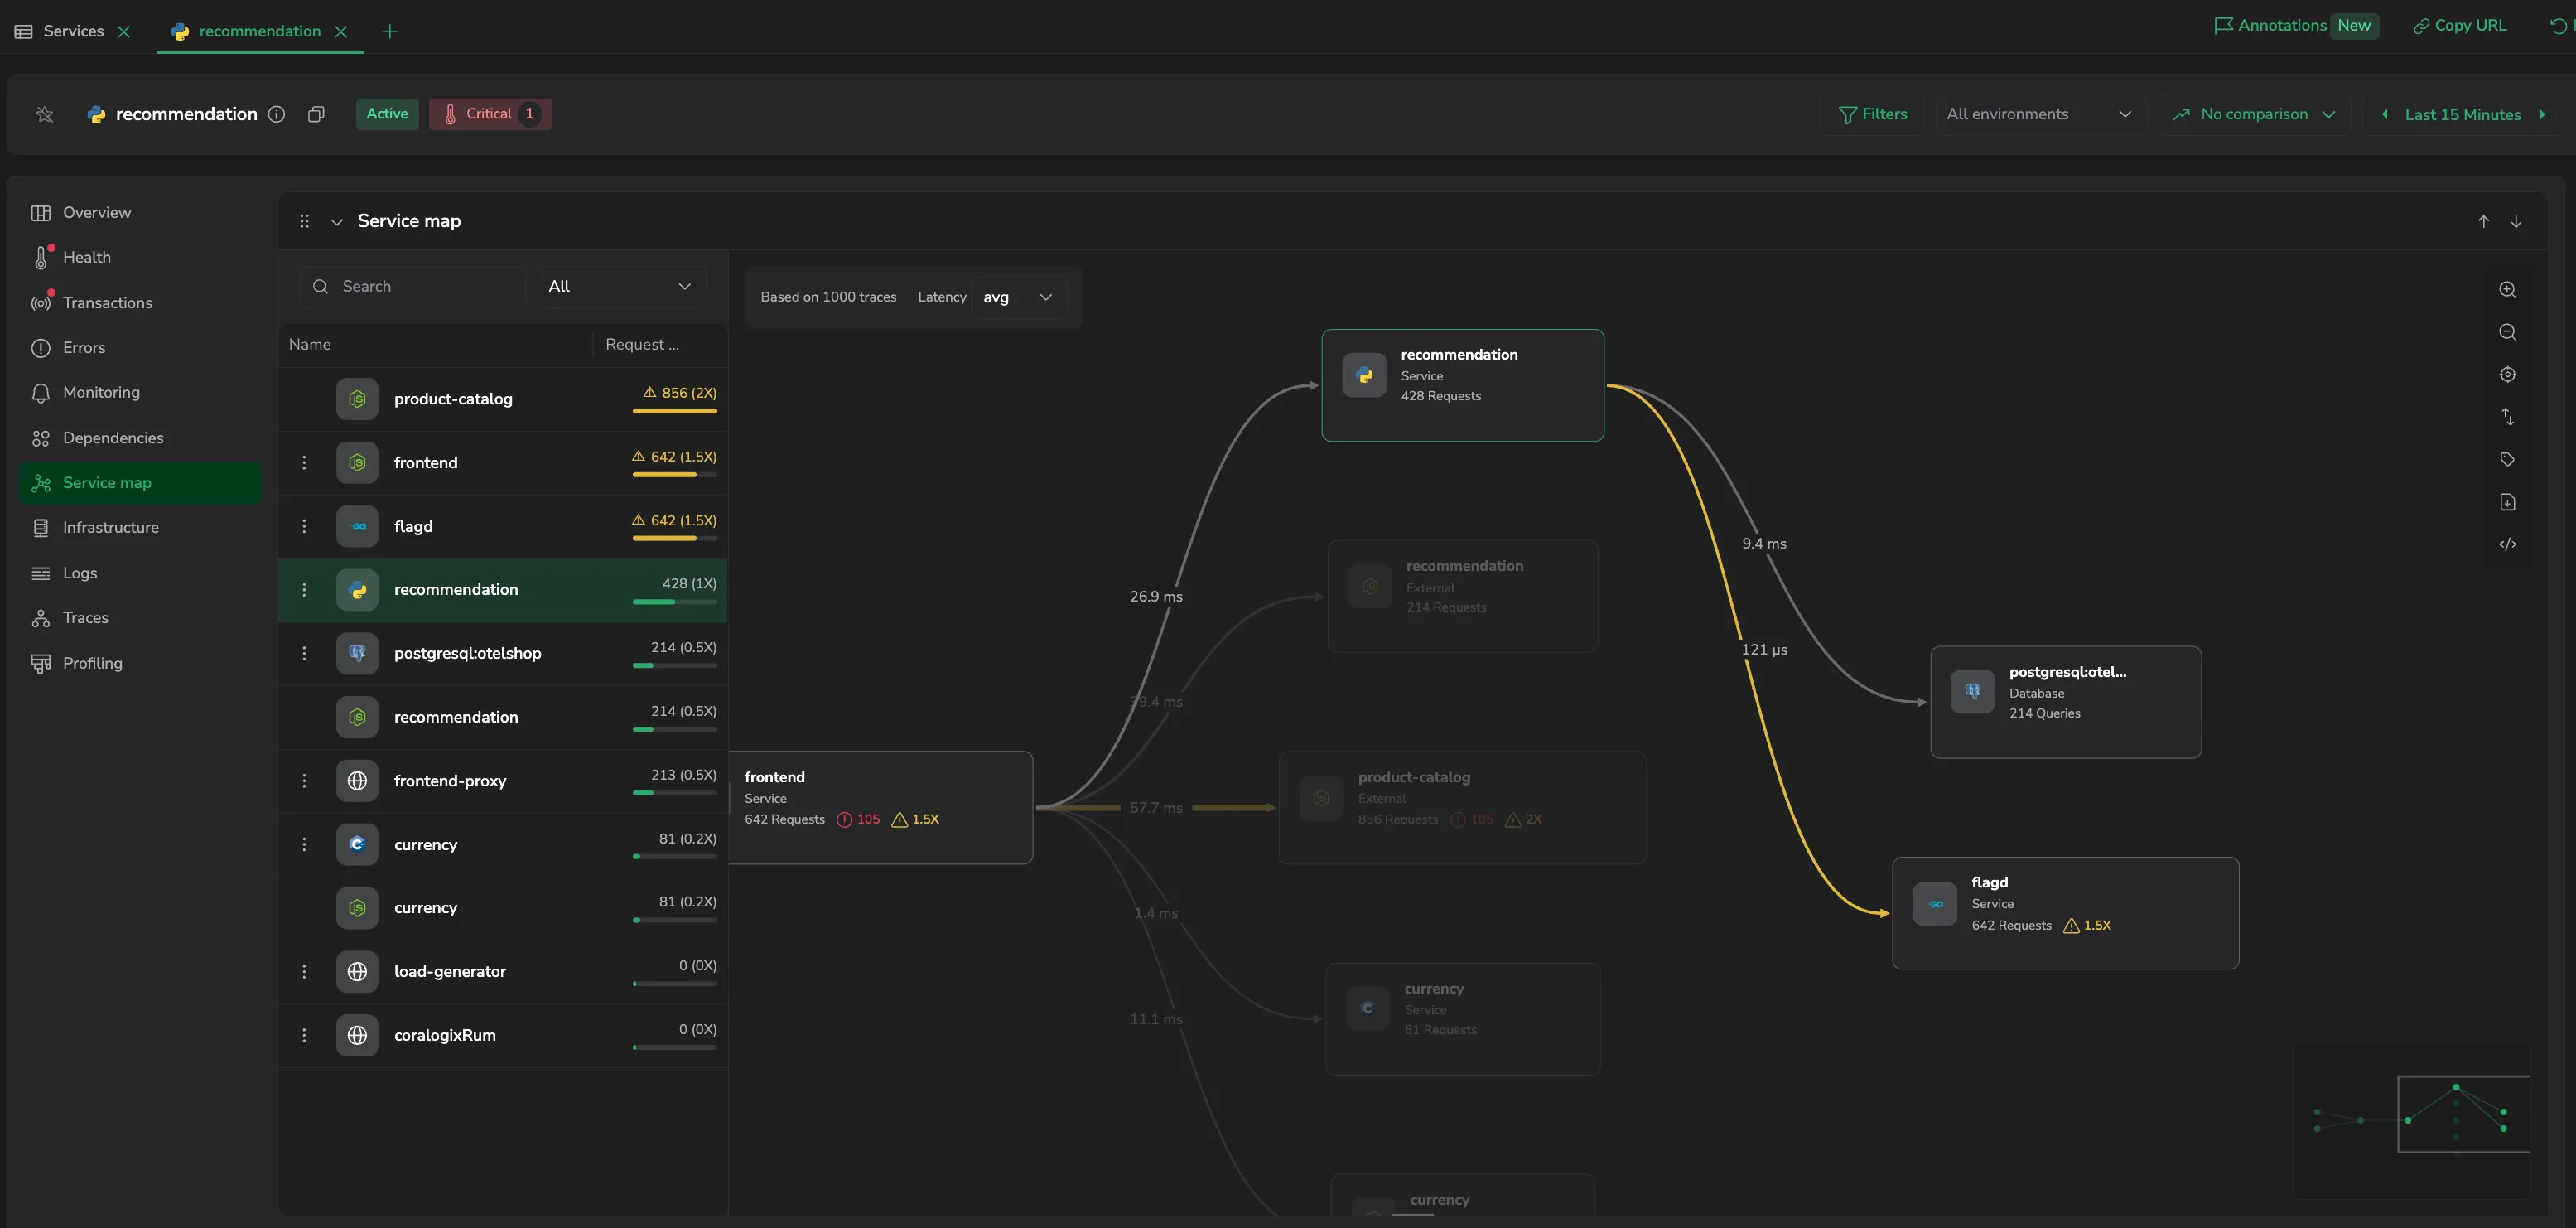
Open a service or database drilldown and go to the Service map section to focus on one entity's dependencies. It presents a trace-based dependency analysis scoped to the entity you drilled into. While the section is collapsed, its header shows the entity's Upstream and Downstream neighbor counts.
This section builds a directed dependency graph for the selected entity from a sample of up to 1,000 traces taken from your archived span data. The graph centers on the drilled-into entity, with the services that call it (upstream) on one side and the services and dependencies it calls (downstream) on the other. A progress indicator reports how much of the sample has been processed (for example, "820/1,000 traces") and reads "Based on 1,000 traces" once the sample finishes.
Service list
A panel on the left lists every node in the graph with two columns - Name and Request Volume - sorted by volume. Use it to:
- Search: filter the list by service name.
- All / Upstream / Downstream: scope the graph to the entity's callers, its dependencies, or both.
- Select a row to highlight and center its node in the graph.
Node types
Each node is labeled with its type:
- Service: an instrumented service.
- Database: a database dependency, labeled by system (for example,
postgresql). - Cache: a cache such as Redis, Memcached, or Valkey.
- Messaging: a messaging system, labeled by system and destination (for example,
kafka:orders). - External: an uninstrumented HTTP or RPC endpoint, identified by its peer service or server address.
A node shows its request or query count, any errors, and a high-load marker when its traffic is well above the graph's baseline.
Node actions
Open the menu on a node to jump to related views:
- On a service node: View service overview, View transactions (when the service has transaction data), View errors, and View related logs.
- On a database or cache node: View database overview.
View service overview opens the service in an APM tab alongside the one you're in, landing on its Overview section and inheriting the current time range, environment, and comparison. If that service is already open in a tab, APM reuses it. Hold Cmd/Ctrl or Shift while selecting to open it in a browser tab instead. The other actions open in a new browser tab.
Read a node or edge
Hover a node to expand it into a card showing the node's technology icon and per-connection metrics - Req/s (or Q/s for a database or cache), Errors, and Max latency - both for the node itself and for each of its connections. Hover an edge to see that call's Requests (or Queries to a database or cache), Errors (count and rate), Avg latency, and Max latency.
Use the Latency selector to choose which latency the graph reports: avg, min, max, or sum.
Graph controls
A toolbar in the upper-right corner provides zoom in, zoom out, fit view, toggle layout direction, toggle edge labels, export PNG, and export JSON, and a minimap tracks your position. Hold Cmd/Ctrl and scroll to zoom the canvas. The graph re-centers on the drilled-into entity until you move the viewport yourself.
The Service map section reads from archived span data. When the archive isn't enabled or has no data for the selected time range, the section shows No archived traces found, with the guidance: This view relies on archived span data. Ensure archive is enabled and contains data for the selected time range.
Next steps
See the resources a service runs on in Infrastructure.