Service Level Objectives (SLOs)
A Service Level Objective (SLO) is a measurable reliability target for a service - for example, 99% of requests served without error, or 95% of requests faster than a latency threshold, over a rolling window. In APM, the SLOs panel of a service's Monitoring tab tracks each objective's status, its compliance against target, and the error budget it has left, and links out to the SLO Center for the full definition. SLOs apply to services.
Use it to:
- Track reliability at a glance: see each SLO's status, compliance, and remaining error budget for the service in one table.
- Spot a budget running low: watch the remaining-budget bar shift from healthy to critical before an SLO breaches.
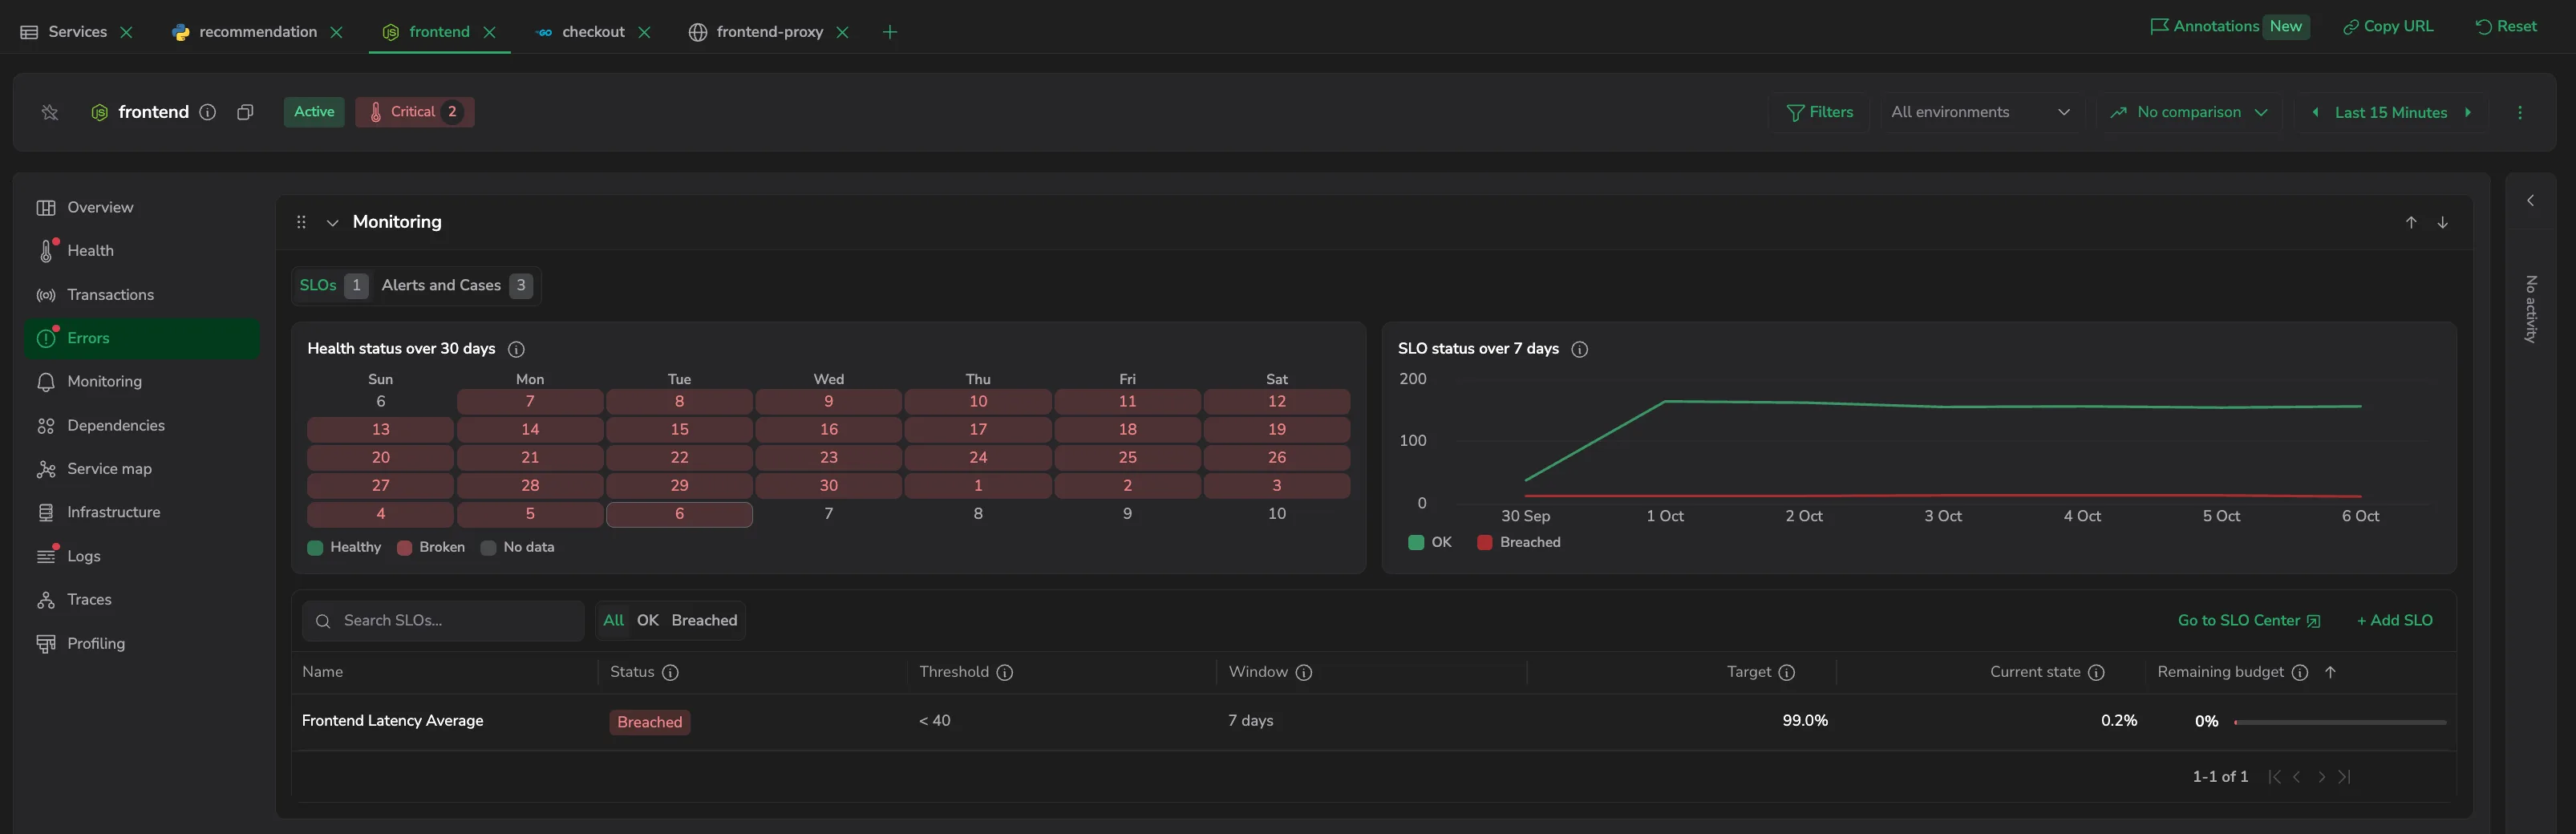
- See recent history: read the status-overview widget's health calendar and seven-day status chart above the table.
- Reach the full definition: open any SLO in the SLO Center to see its permutations, events, and configuration.
What you need
- Coralogix Application Performance Monitoring (APM) installed and configured.
- Span Metrics enabled for the service.
- SLOs apply to services.
- To add or edit SLOs, permission to edit SLOs. The + Add SLO action may not be available on all accounts.
Why SLOs matter for APM
SLOs help teams measure and prioritize service health in a user-focused way. They enable:
- Proactive issue management: highlight potential problems before they affect user experience.
- Data-driven decisions: focus engineering effort on what matters to users.
- Efficiency: balance reliability investment against business needs and cost, rather than over-investing.
- Accountability: give clear, measurable goals to monitor and improve service performance.
Access the SLOs panel
- In your Coralogix toolbar, select APM.
- Select a service to open its drilldown, then select the Monitoring tab.
- The tab opens on the SLOs panel. If you are on Alerts & Cases, select SLOs in the switcher.
Status-overview widget
When the service has at least one SLO, a status-overview widget sits above the table:
- a health calendar that colors each recent day by its worst SLO status, and
- a seven-day status chart that summarizes the last week.
Together they show how the service's SLOs have tracked over the recent period before you read the per-SLO detail below.
SLO table
Each row is one SLO defined for the service in the SLO Center. The columns are:
- Name: the SLO's name.
- Status: the worst status across the SLO's permutations: Healthy, Warning, Critical, Breached, or Pending.
- Threshold: the threshold a request must meet to count as good. Latency SLOs only; other SLOs show an em dash.
- Window: the rolling evaluation window, such as 7 days.
- Target: the compliance target for the SLO.
- Current state: current compliance for the SLO.
- Remaining budget: the error budget left before the SLO breaches, shown as a bar that fills to the remaining percentage: green at 75% or above, yellow between 25% and 75%, and red below 25%.
Use Search SLOs… to find an SLO by name, the All / OK / Breached filter to narrow by status, and any column header to sort.
Error budget
An SLO's error budget is the number of failures - errors, or latency-threshold violations - it can absorb over its window while still meeting target. The Remaining budget bar shows how much of that budget is left, so you can tell at a glance whether an SLO is comfortable or close to breaching.
For example, a 99% target over a 7-day window with 10,000 requests allows 100 violations (1% of requests). If 52 violations have occurred, 48 remain - a remaining budget of 48%, which the bar shows in yellow.
Add an SLO
If you have permission to edit SLOs, select + Add SLO in the SLOs panel toolbar - or Create SLO when the panel is empty. The SLO Center create drawer opens with the service pre-filled. Configure and save the SLO there; for the full field reference, see Create SLOs. This action may not be available on all accounts.
SLOs you add appear in the SLO Center and in this panel. An SLO needs a full evaluation window of data before it reports complete results; until then it may show a Pending status.
Open an SLO's drilldown
Select a row to open the SLO in a drilldown drawer - an SLO Overview showing compliance over time, remaining error budget over time, total and good events, and a per-minute snapshot you can inspect minute by minute. To open the full SLO Center instead, select Go to SLO Center.
Next steps
Get notified when a service degrades with APM monitoring with alerts.
Additional resources
| Coralogix Academy | SLO/SLI Management in Coralogix APM |
| API | SLO Management API |
| Terraform | Terraform registry |