Investigate traces and spans
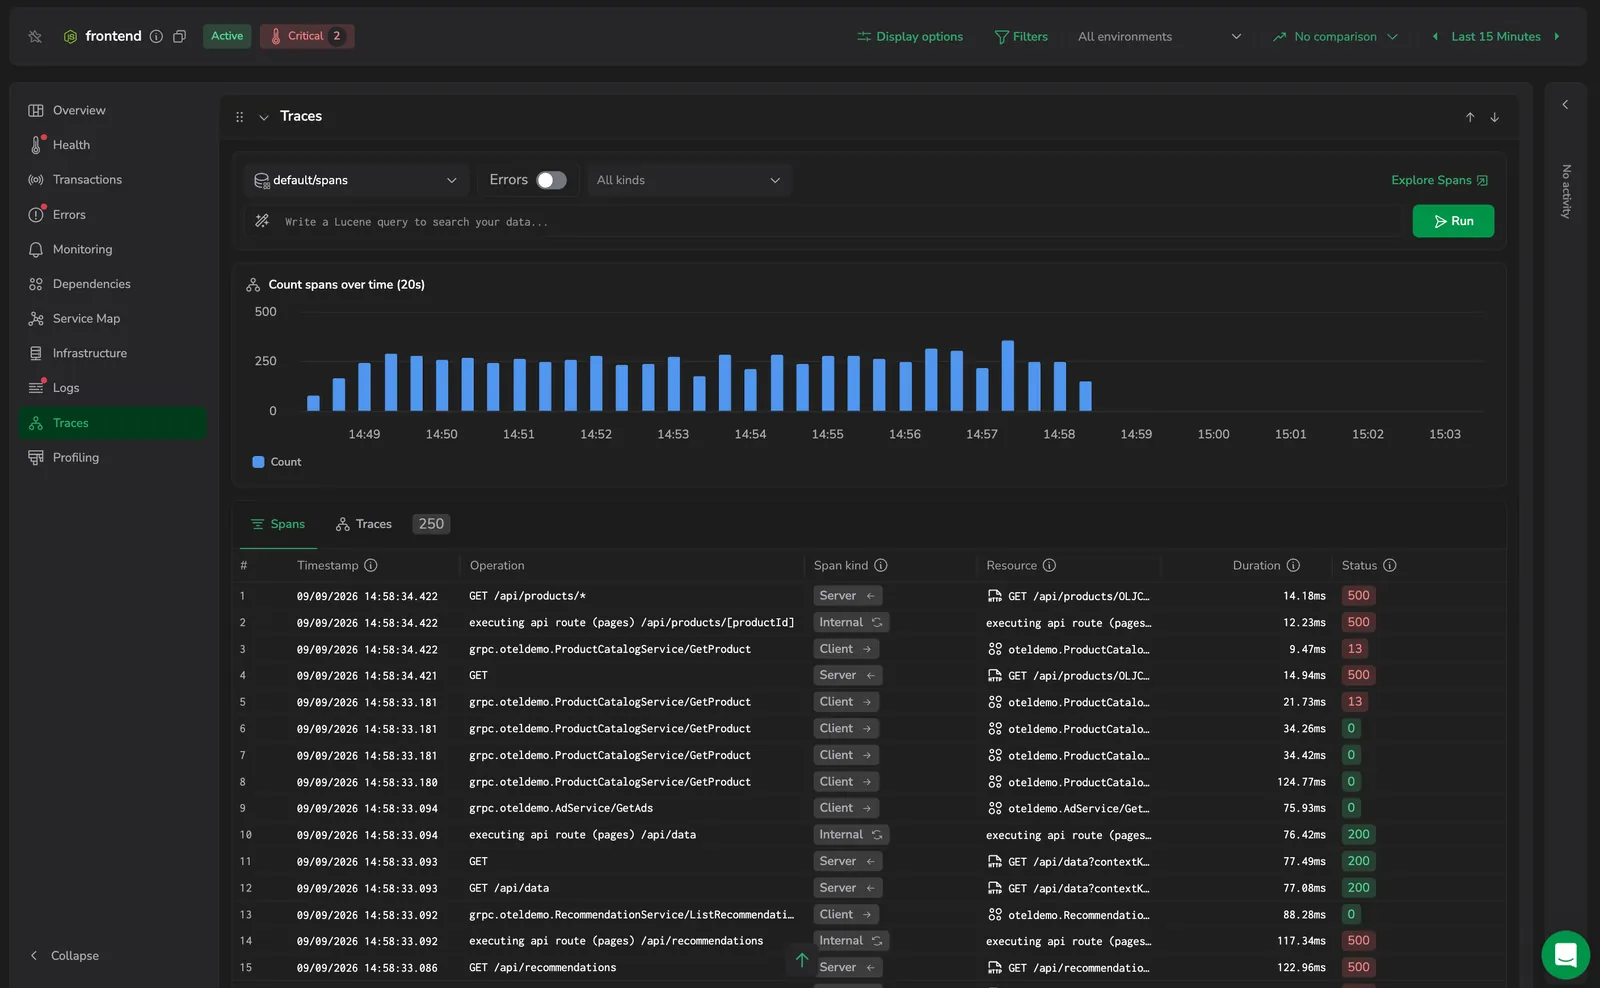
The Traces tab is the bridge from an aggregate metric - a latency spike or an error burst - to the individual requests behind it. It lists the entity's most recent spans and traces, with Highlights, Spans, and Traces views, a set of filters, and a chart of span volume over time. It is available for both services and databases.
Use it to:
- Find the request behind a spike: jump from an aggregate latency or error metric to the individual spans and traces that produced it.
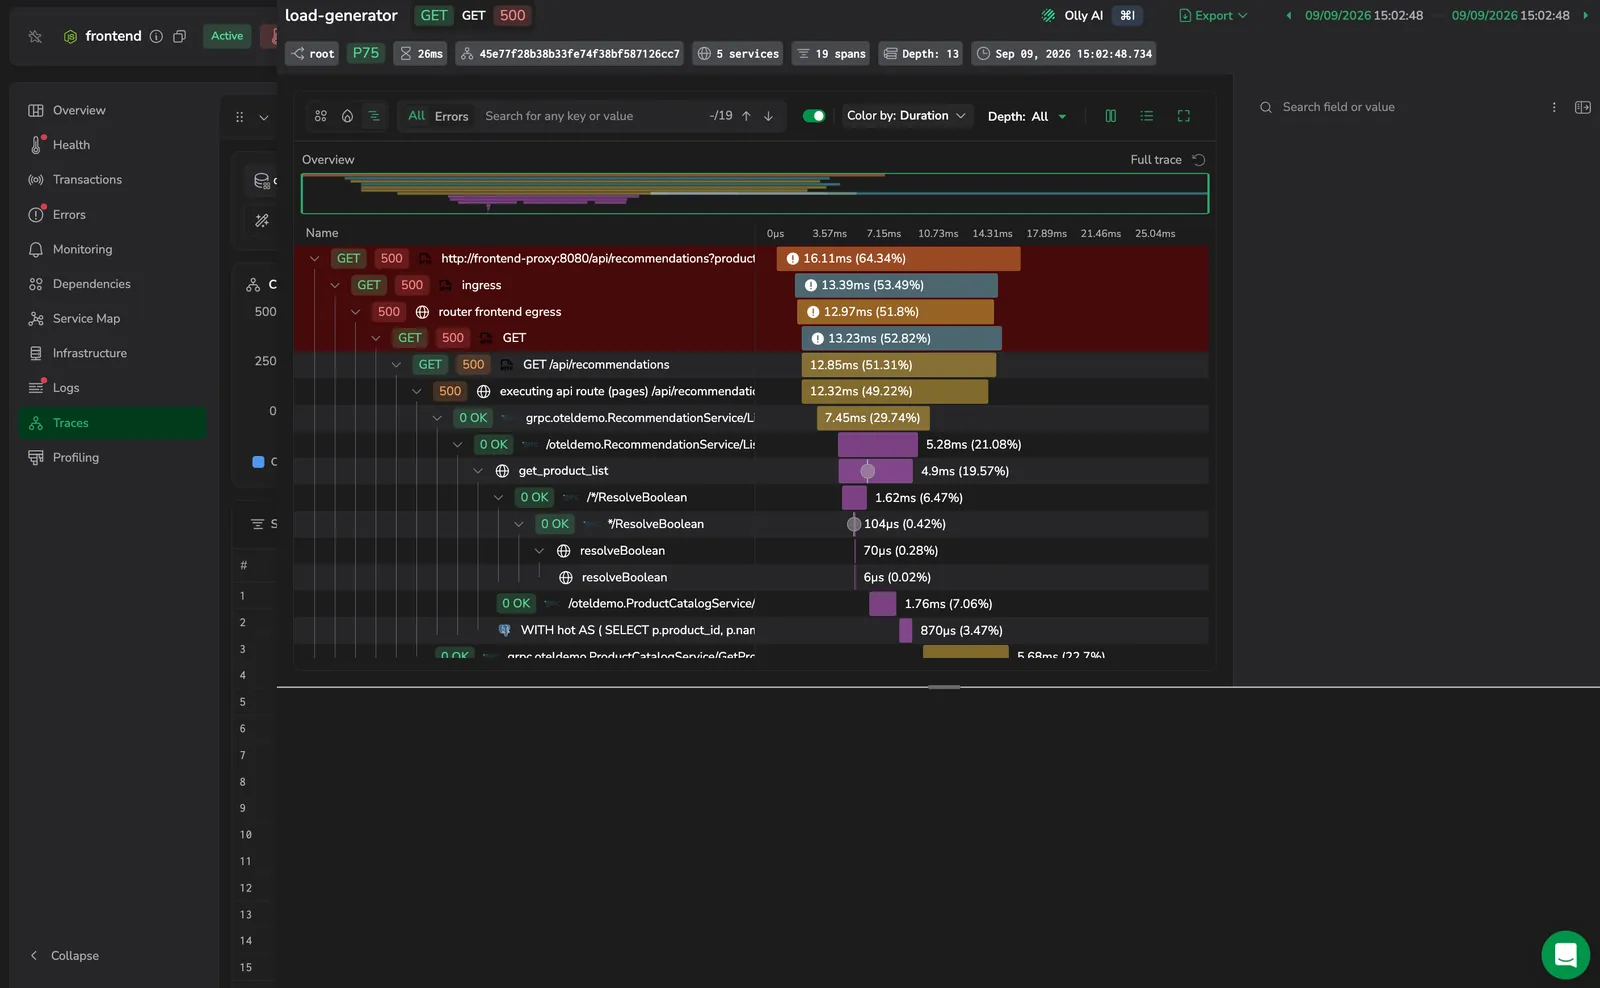
- Inspect one request end to end: open a trace to follow it across services and see where the time or the error occurred.
- Narrow to what matters: filter by dataset, errored spans only, span kind, or a Lucene query to isolate the spans you care about.
- Open the full set in Explore: send the current scope and filters to Explore when you need more than the most recent rows or the complete span body.
What you need
- Coralogix Application Performance Monitoring (APM) installed and configured.
- Spans reaching Coralogix for the entity you open. The tab reads spans directly, so it needs no additional processor or Span Metrics setup.
Access the Traces tab
- In your Coralogix toolbar, select APM.
- Select a service or database to open its drilldown, then select the Traces tab.
- The tab opens on the Spans view. Use the filters to scope what the chart and the views show, and the view toggle to switch between Highlights, Spans, and Traces.
When you collapse the Traces section, its header keeps a summary of two mini-metrics - Spans and Errors - with the totals for the selected range.
Filters
A filters card at the top of the tab scopes the chart and all views together:
- Dataset: the spans dataset to read. Defaults to the default spans dataset; select another to query a different one.
- Errors: a toggle that restricts every view to errored spans.
- Span kind: a multi-select, labelled All kinds when nothing is chosen. Filter to one or more of Server, Client, Internal, Producer, or Consumer. Selecting every kind is the same as selecting none.
- Lucene query and Run: write a query in the search box ("Write a Lucene query to search your data...") and select Run to apply it. The query is applied on Run, not as you type.
- Explore Spans: opens the current scope and filters in Explore in a new tab, without the row cap: use it for the full span body or for more than the most recent rows.
Count spans over time
A chart titled Count spans over time plots the entity's span volume across the selected range as a single series. Use its menu to change the chart type and scale, set the time bucket, or open View query. Select the full-view toggle in the chart header to double the chart's height; select it again to restore.
Over a wide range the chart can exceed the query scan limit, in which case a warning appears: "Counts are incomplete. This time range exceeded the query scan limit. Narrow the time range for exact numbers." Narrow the range for exact counts.
Spans and traces
The tab lists the entity's recent activity in views toggled at the top: Highlights, Spans (the default), and Traces. A badge next to the toggle shows how many rows are loaded, and each table view paginates at 25 rows per page. Switching views refetches for the current time range and filters.
Highlights
The Highlights view breaks the entity's traces down by field and tag value, so you can see which values dominate its latency or errors without opening individual spans. Switch the breakdown between latency and errors, choose the aggregation, and turn on a compare-to-period mode to see what changed. A chart accompanies the breakdown; toggle it with Show graph / Hide graph.
Each view shows the most recent rows only - up to 250 spans or 100 traces. When a view is capped, the row-count badge's tooltip reads, for example, "Showing the most recent 250 spans. Open Explore for the full set." Select Explore Spans to open the complete, uncapped set.
Spans
The Spans view lists individual spans, most recent first:
- #: the row number.
- Timestamp: when the span started.
- Operation: the span's operation name.
- Span kind: server, client, internal, producer, or consumer.
- Resource: the instrumented resource that produced the span.
- Duration: how long the span took.
- Status: the span's outcome: success or error.
Traces
The Traces view rolls spans up into whole traces, most recent first:
- #: the row number.
- Timestamp: when the trace started.
- Operation: the trace's entry-point operation.
- Resource: the root resource the trace entered through.
- Span count: total spans in the trace.
- Errors: errored spans in the trace.
- Duration: the trace's end-to-end duration.
- Breakdown: how the trace's span time splits across services: this entity's own share versus everything downstream.
Investigate a trace or span
Select a row to open the tracing drilldown, which shows the full trace waterfall and each span's attributes. Selecting a span focuses that span within its trace; selecting a trace opens it from the root. See Investigate with the tracing drilldown for the full reference.
Next steps
Profile a service's CPU and see where its time goes in Profiling.