Monitor transactions
The Transactions tab breaks a service down into its individual transactions - the requests it serves, each identified by its entry-point operation - so you can find the slowest, busiest, or most error-prone and drill into the segments and spans behind them. A transaction is what enters the service, so the tab covers incoming requests, split by trigger: Web (HTTP requests) and Pub-Sub (messaging consumers).
Use it to:
- Pinpoint the slowest transaction: find the transaction with the highest duration or error rate, and fix the request path that hurts users most.
- See where a transaction spends its time: break it into segments - a database call, an external API, or internal logic - and find the one that contributes the most latency or errors.
- Separate web from messaging traffic: scope the tab by trigger to compare HTTP endpoints against messaging consumers.
- Move from an aggregate to the evidence: jump from an aggregated transaction or segment straight to the exact spans and traces behind it.
What you need
- Coralogix Application Performance Monitoring (APM) installed and configured.
- Span Metrics enabled for the service.
- To break a transaction down into segments in its drilldown, the service must emit transaction data. This requires the Coralogix transactions processor: see Enable the transactions processor.
Key concepts
A user visits an e-commerce website and clicks on a product to view its details. This action initiates a transaction. The transaction begins when the user's request reaches a service and ends when the service sends back the product details as a response. During this transaction, several operations occur: the service might query a database to retrieve the product information, call external services for current pricing, and execute internal logic to prepare the content for display. Each of these operations represents a segment. The transaction breakdown shows how these segments collectively contribute to the request's overall response time and performance.
Transaction
A transaction denotes a singular logical unit of work in a software application. More precisely, it encompasses the function and method calls constituting that unit of work. Each transaction consists of a root span, an operation that serves as its entry point and triggers all other related operations.
Operation
Every transaction may contain hundreds, if not thousands, of spans, grouped per operation name. An operation is a logical entity consolidating all spans with the same action type.
Segment
A segment is an operation within a transaction that influences the overall performance of that transaction. Examples include external service calls and database calls. Each segment provides insights into its performance and how it affects the transaction over time.
Coralogix's APM captures and monitors the performance metrics associated with each segment that makes up the transaction. This information helps identify bottlenecks, optimize code, and ensure a smooth and efficient user experience during the entire purchase process.
Root transaction
A root transaction is the entry-point service operation that initiates subsequent actions within the service - such as database queries, internal operations, external API calls, or downstream service requests. It is the main request or operation that triggers a chain of dependent actions.
Transactions vs. spans
Transactions and the Explore spans feature serve different analysis contexts and depths. Transactions examine the entire sequence of events over time within a service. This method explains how different parts of the transaction interact and evolve, providing deep insights into the internal dynamics of service requests.
While Explore spans captures snapshots of individual operations at specific moments, it does not effectively identify long-term bottlenecks within the overall flow. Transactions deliver a detailed analysis that helps pinpoint the underlying causes of performance issues across the entire flow of the service.
In essence, transactions complement span analysis by examining the collective impact of operations within a service, offering a more comprehensive view of their influence on performance over time.
Access the Transactions tab
- In your Coralogix toolbar, select APM.
- Select a service to open its drilldown, then select the Transactions tab.
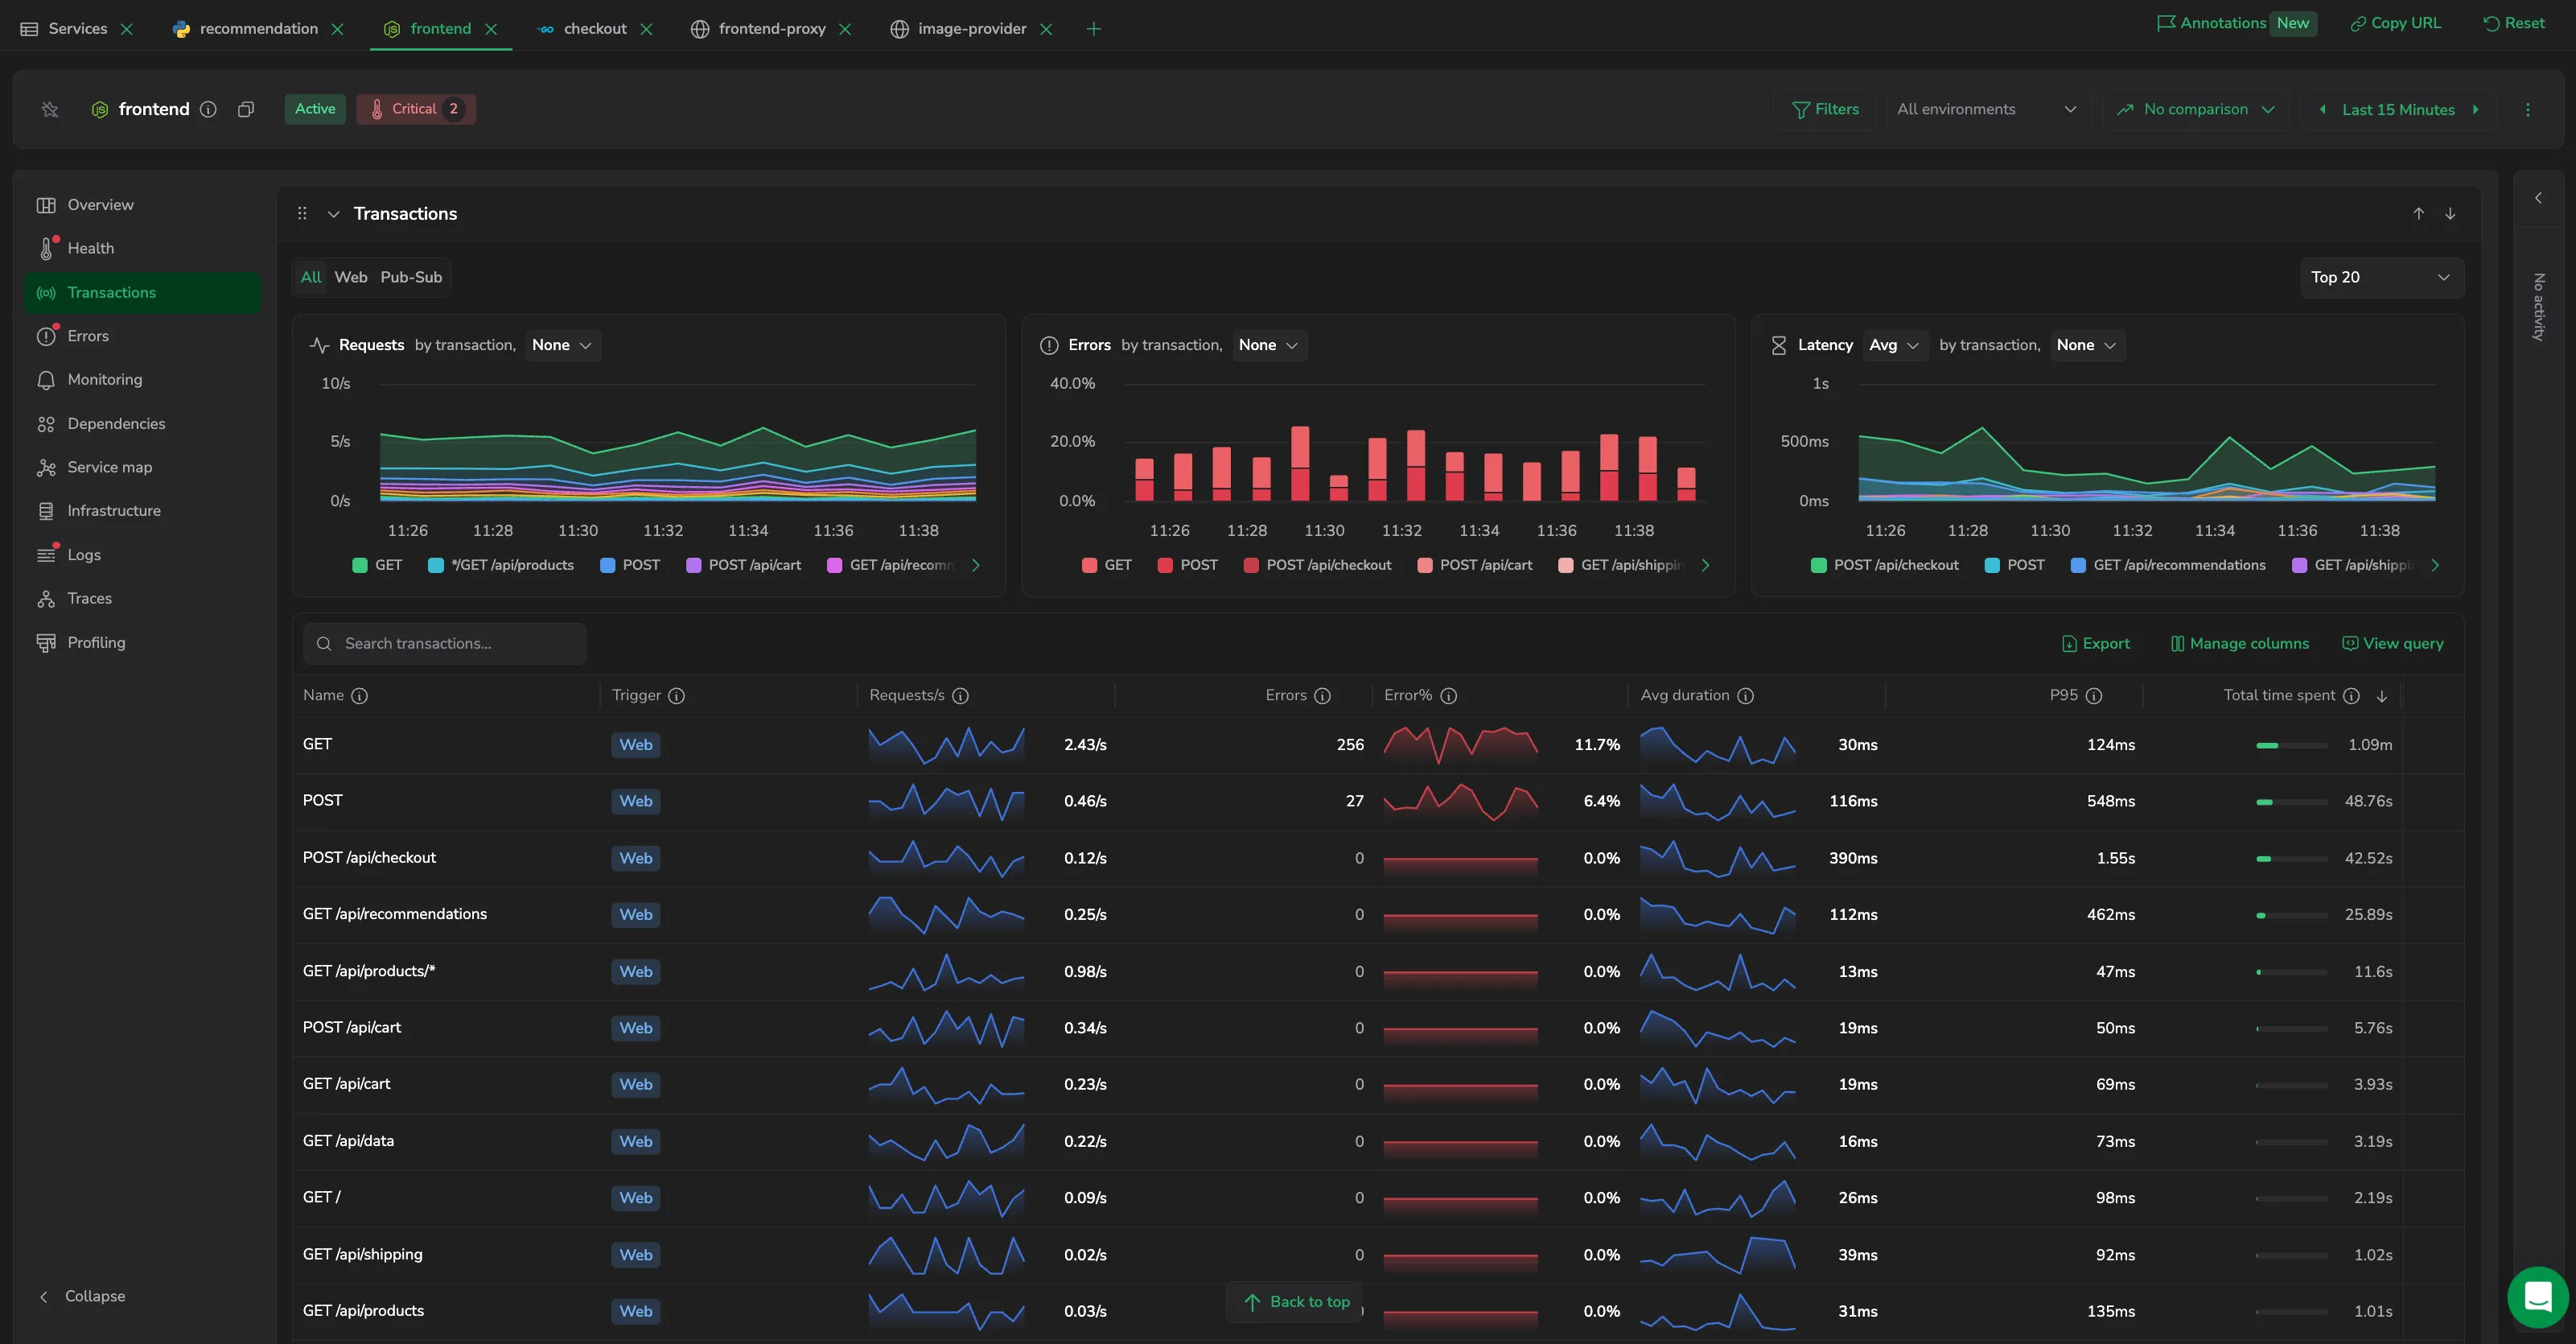
- Use the Trigger toggle to scope the tab to All, Web, or Pub-Sub traffic, and the Top N selector to set how many transactions to return (Top 5, Top 20 by default, or Top 100).
The trigger and Top N selections apply to both the summary charts and the transactions table. The environment filter and any drilldown dimensions scope the transactions shown.
The Transactions tab is available for services. Databases expose an Operations tab instead.
Trigger
A transaction is a request that enters the service, so every transaction has a trigger that reflects how its entry point was invoked:
- Web: HTTP requests, taken from server spans.
- Pub-Sub: messaging consumers, taken from consumer spans.
Select All to view both. Trigger is also available as a column in the transactions table.
Summary charts
Three charts at the top of the tab summarize the selected traffic, each plotting the top transactions:
- Requests: request throughput per transaction, plotted per second.
- Errors: the share of requests that failed, per transaction.
- Duration: response time per transaction, with a percentile selector (Avg, P50, P75, P90, P95, P99) that opens on Avg.
Every chart is split by transaction; add a second dimension - None, Environment, Version, or Status code - to break each transaction's series down further. Use each chart's menu to change its chart type and scale, open it in Full view, open View query, or open the chart in the Metric Explorer.
Transactions table
The Transactions table below the charts lists every transaction matching the selected trigger. It opens with a narrow default set of columns, where each metric is shown as a single column that pairs its value with a trend sparkline:
- Name: the transaction (endpoint or operation) name.
- Trigger: how the entry point was invoked: Web or Pub-Sub.
- Requests/s: requests per second over the range, with a trend sparkline.
- Errors: total failed requests.
- Error%: the error rate over the range, with a trend sparkline.
- Avg duration: average response time over the range, with a trend sparkline.
- P95: 95th-percentile response time.
- Total time spent: the transaction's cumulative processing time and its share of the transactions shown.
The table returns the Top N transactions ranked by Total time spent. Selecting a column header re-sorts the returned rows in place; it does not change which transactions are returned. Select Manage columns to add other columns - including the value-only variants (Requests, Error% (value only), Avg duration (value only)), Apdex impact, Method, Errors/s, and the other latency percentiles (P50, P75, P90, P99). Use Search transactions to find one by name, Export to download the table, and the comparison control to compare each transaction's metrics against an earlier period.
Each row has an actions menu (the icon) with View details (open its drilldown), View traces (open the transaction's traces), Add to filter (scope the tab to that transaction), and Copy transaction name. The same actions menu is available from a transaction's series in the summary charts above.
Investigate a transaction
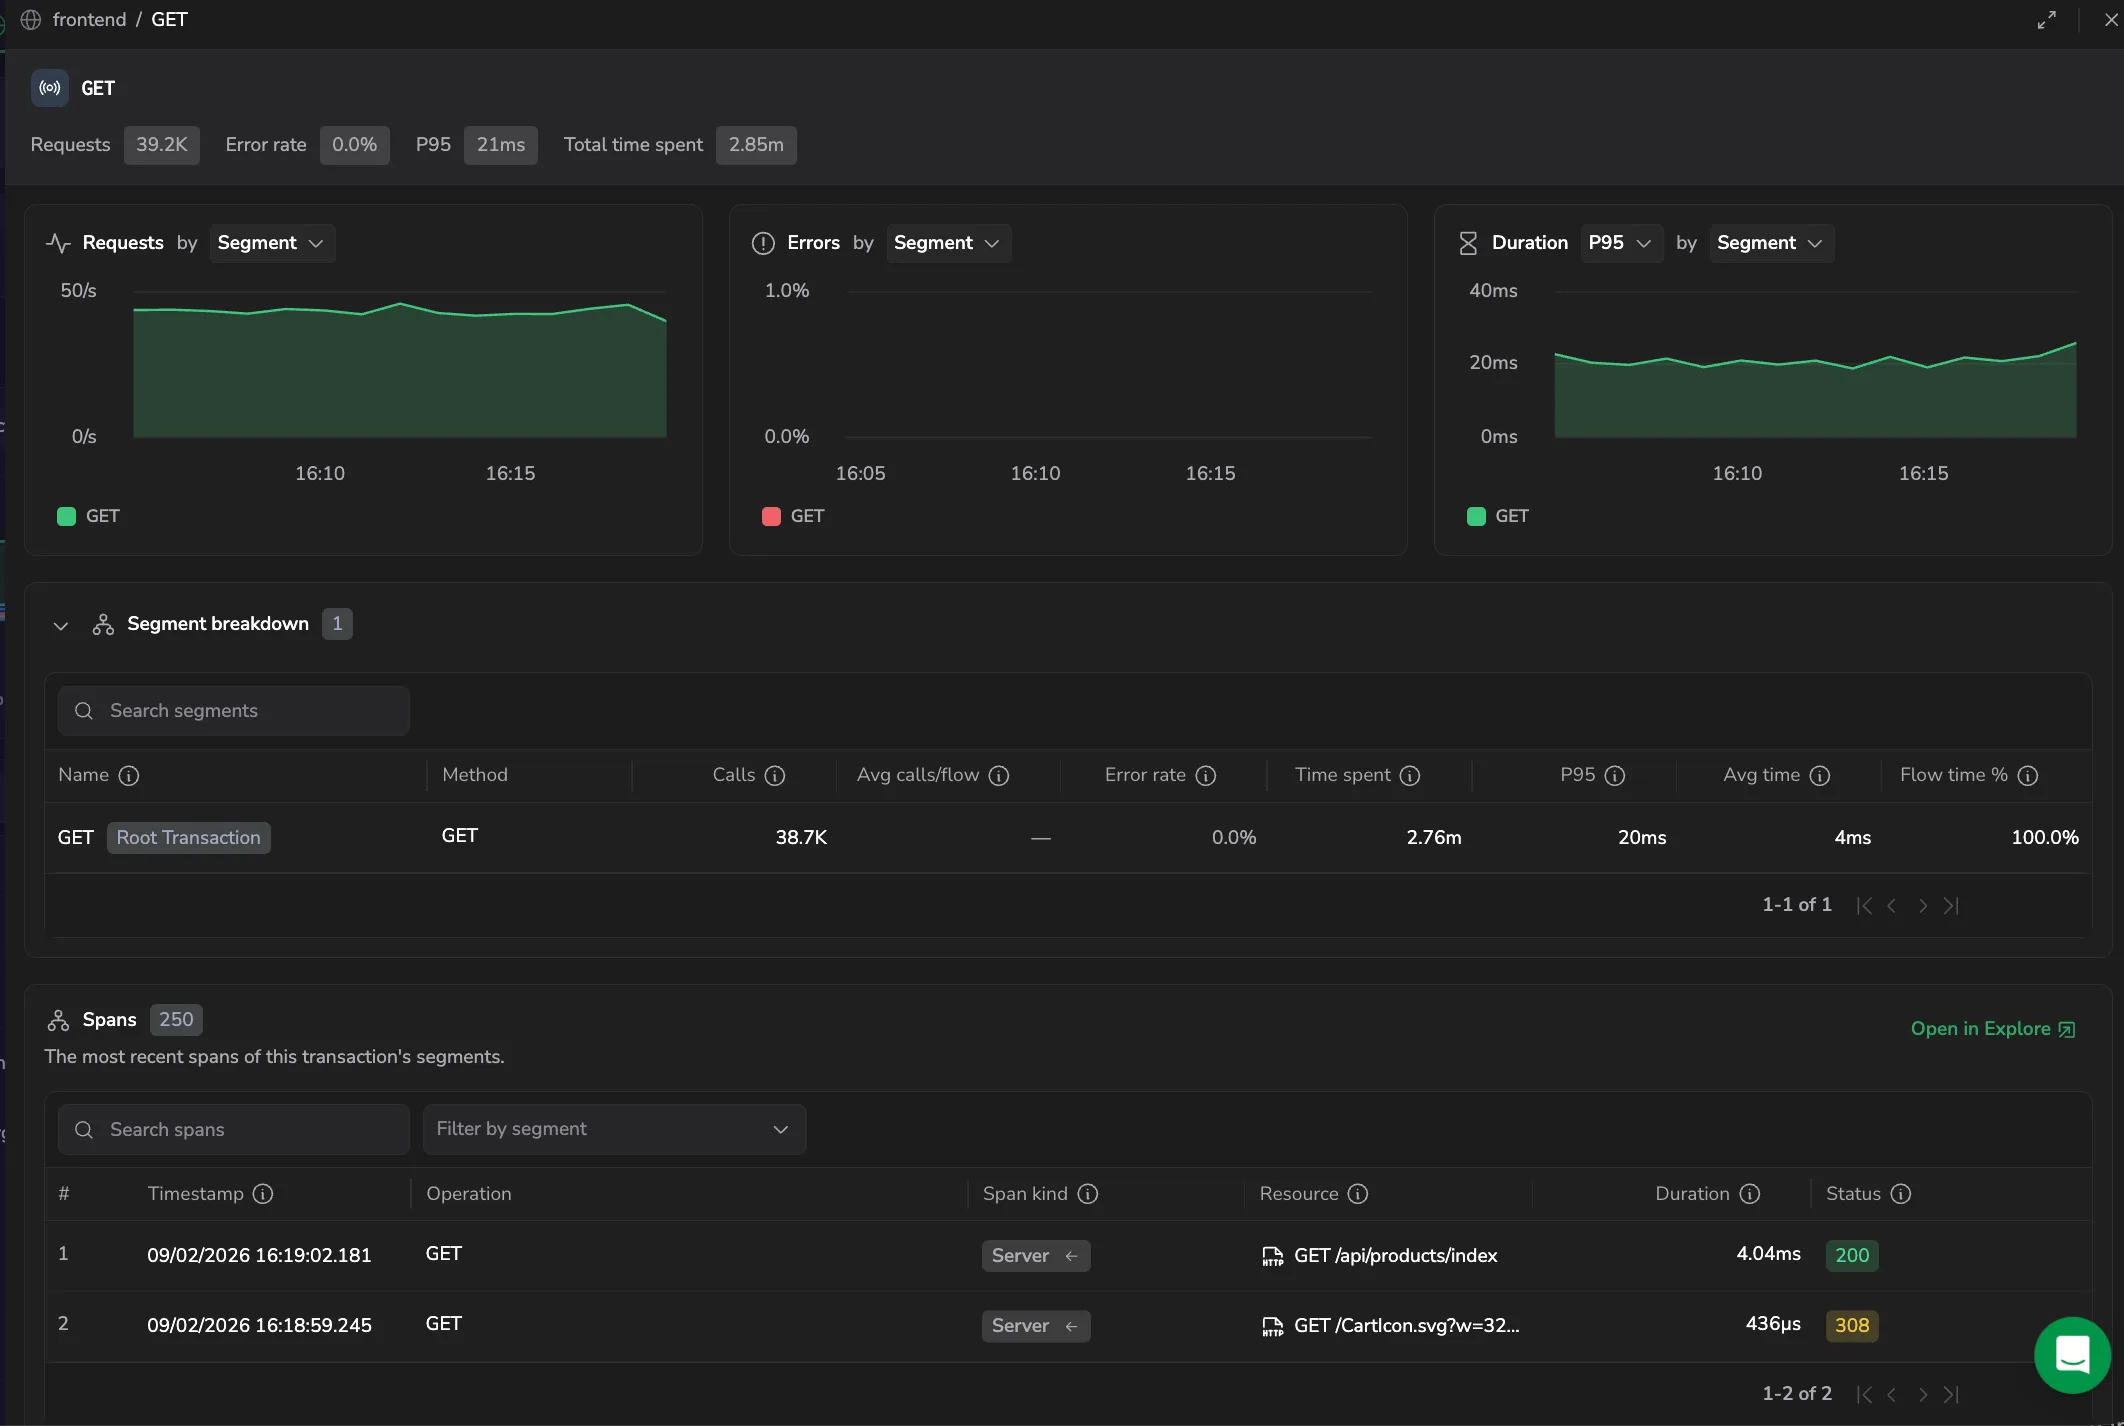
Select a transaction row - or its series in the summary charts above - to open its drilldown drawer, which summarizes the transaction over the selected timeframe. The header shows the service and transaction name, and a row of key metrics - Requests, P95, Error rate, and Total time spent. From the header you can Copy transaction name or Copy link (a deep link back to the open drawer), change the drawer's range with the time picker, and step through the table with Previous transaction / Next transaction without closing the drawer. The open transaction's row stays highlighted in the table behind it.
The drawer contains:
- Charts: Requests, Errors, and Duration over time for this transaction. Group them by None, Segment, Environment, or Version: the Segment grouping fans the transaction out into the segments that make it up.
- Segment breakdown: for services that emit transaction data, a table of the segments that run as part of the transaction. See Segment breakdown.
- Spans: the most recent spans of the transaction's segments. See Spans.
Segment breakdown
For services that emit transaction data, the drawer shows a Segment breakdown table between the charts and the spans list. It breaks the transaction into the segments that run as part of it - the downstream calls and internal steps that make up its work - so you can see where the transaction spends its time before you reach the raw spans. A transaction with no further breakdown shows only its spans.
The segment breakdown requires the Coralogix transactions processor. See Enable the transactions processor.
The Segment breakdown table lists each segment with:
- Name: the operation this segment represents. The transaction's own root segment heads the table, tagged Root Transaction, followed by the segments it contains.
- Method: request method, where applicable.
- Calls: total calls to this segment in the selected time range.
- Avg calls/flow: average calls to this segment per transaction.
- Error rate: share of this segment's calls that failed.
- Time spent: total time spent in this segment across all calls.
- P95: 95th-percentile duration of a single call.
- Avg time: average duration of a single call.
- Flow time %: share of the transaction's total time spent in this segment.
Use Search segments to narrow the list, select a segment row to add it to the spans filter below, or sort by any column to surface slow or error-prone segments. Each row also offers Explore spans and Filter traces by this segment.
Spans
The Spans section lists the most recent spans of this transaction's segments, scoped to the transaction you drilled into. Each span shows its timestamp, operation, span kind, resource, duration, and status. Use Search spans to filter the list, Filter by segment to scope it to one segment, and Open in Explore to open the spans in Explore.
Select a span to open the Tracing drilldown, where you can switch between Dependencies, Flame, and Gantt views and pivot to correlated logs, infrastructure, profiles, or AI insights. See Investigate with the tracing drilldown for the full reference.
Next steps
To break transactions into segments, enable the Coralogix transactions processor.