APM onboarding
Coralogix Application Performance Monitoring (APM) gives you a live catalog of your services and databases, RED metrics (requests, errors, duration), a service map, and distributed traces - with no separate APM agent to run. This guide takes you from nothing to services reporting in APM - most teams in about 15 minutes - then points you to the optional tuning that makes the data production-ready.
APM v2 reads compact Span Metrics - standard Span Metrics aren't enough. Compact metrics for your services populate the Services catalog, and compact database metrics populate the Databases catalog. The first time you open APM v2, a welcome check lists these requirements with their status (Sending or Missing) and links to the migration guide and to legacy APM; select Go to new APM to continue. You don't need database metrics to use the new APM for your services: without them, Services work as usual and Databases are unavailable, with legacy APM still available for databases. Enable compact Span Metrics first: Using compact Span Metrics.
The fastest path is Kubernetes with the Coralogix Helm chart and eBPF auto-instrumentation. Start with Step 1: Deploy the OpenTelemetry Collector.
How APM works
APM is built on OpenTelemetry: your instrumented services emit spans, the OpenTelemetry Collector forwards them to Coralogix, and Coralogix derives the Span Metrics that power APM.
Three things produce everything you see:
- Deploy the OpenTelemetry Collector to receive telemetry from your services and forward it to Coralogix.
- Instrument your services so they emit spans (traces).
- Coralogix derives Span Metrics from those spans - the RED metrics that power the catalog, health, and charts.
You set up the first two; Coralogix handles the third. To customize what Span Metrics generates, see Span Metrics.
What you need
- A Coralogix account, with your Send-Your-Data API key and your region's OpenTelemetry endpoint.
- A running service you want to monitor.
- For Kubernetes: a cluster that meets the Helm chart prerequisites (minimum Kubernetes and Helm versions, secrets).
- Compact Span Metrics for your services - the new APM reads these for the Services catalog (see the note above). Compact database metrics are needed only for the Databases catalog; without them, Services work and Databases are unavailable. Enable them with Using compact Span Metrics.
Step 1: Deploy the OpenTelemetry Collector
The Collector receives spans from your services and forwards them to Coralogix. Span Metrics is enabled by default in the latest Coralogix distributions, so APM works as soon as spans arrive. Choose your platform:
- Kubernetes (Helm)
- Docker
- EC2
- ECS
Recommended. Use the Coralogix Kubernetes Complete Observability integration:
-
Download the
values.yaml. -
Meet the prerequisites (minimum Kubernetes and Helm versions, secrets).
-
Confirm the
spanMetricspreset is enabled (it is by default):spanMetrics:enabled: true -
Install with the Helm commands.
Follow OpenTelemetry using Docker.
Follow ECS-Fargate or ECS-EC2.
Span Metrics is on by default. To customize the metrics, dimensions, and histogram buckets it generates, see Recommended configurations.
Step 2: Instrument your services
Your services need to emit spans. Choose an approach:
- eBPF (Kubernetes)
- OpenTelemetry SDKs
Auto-instrument without code changes using eBPF auto-instrumentation. This is the fastest path on Kubernetes.
Instrument per language with the OpenTelemetry SDKs - auto-instrumentation needs no code changes, or use manual instrumentation for full control. Point the exporter at your Collector.
Step 3: Verify data is flowing
Generate some traffic to your service, then, within a few minutes:
- In the Coralogix toolbar, select APM.
- Confirm your service appears in the catalog, and open it to see its RED metrics.
- Open the Traces section to see recent spans.
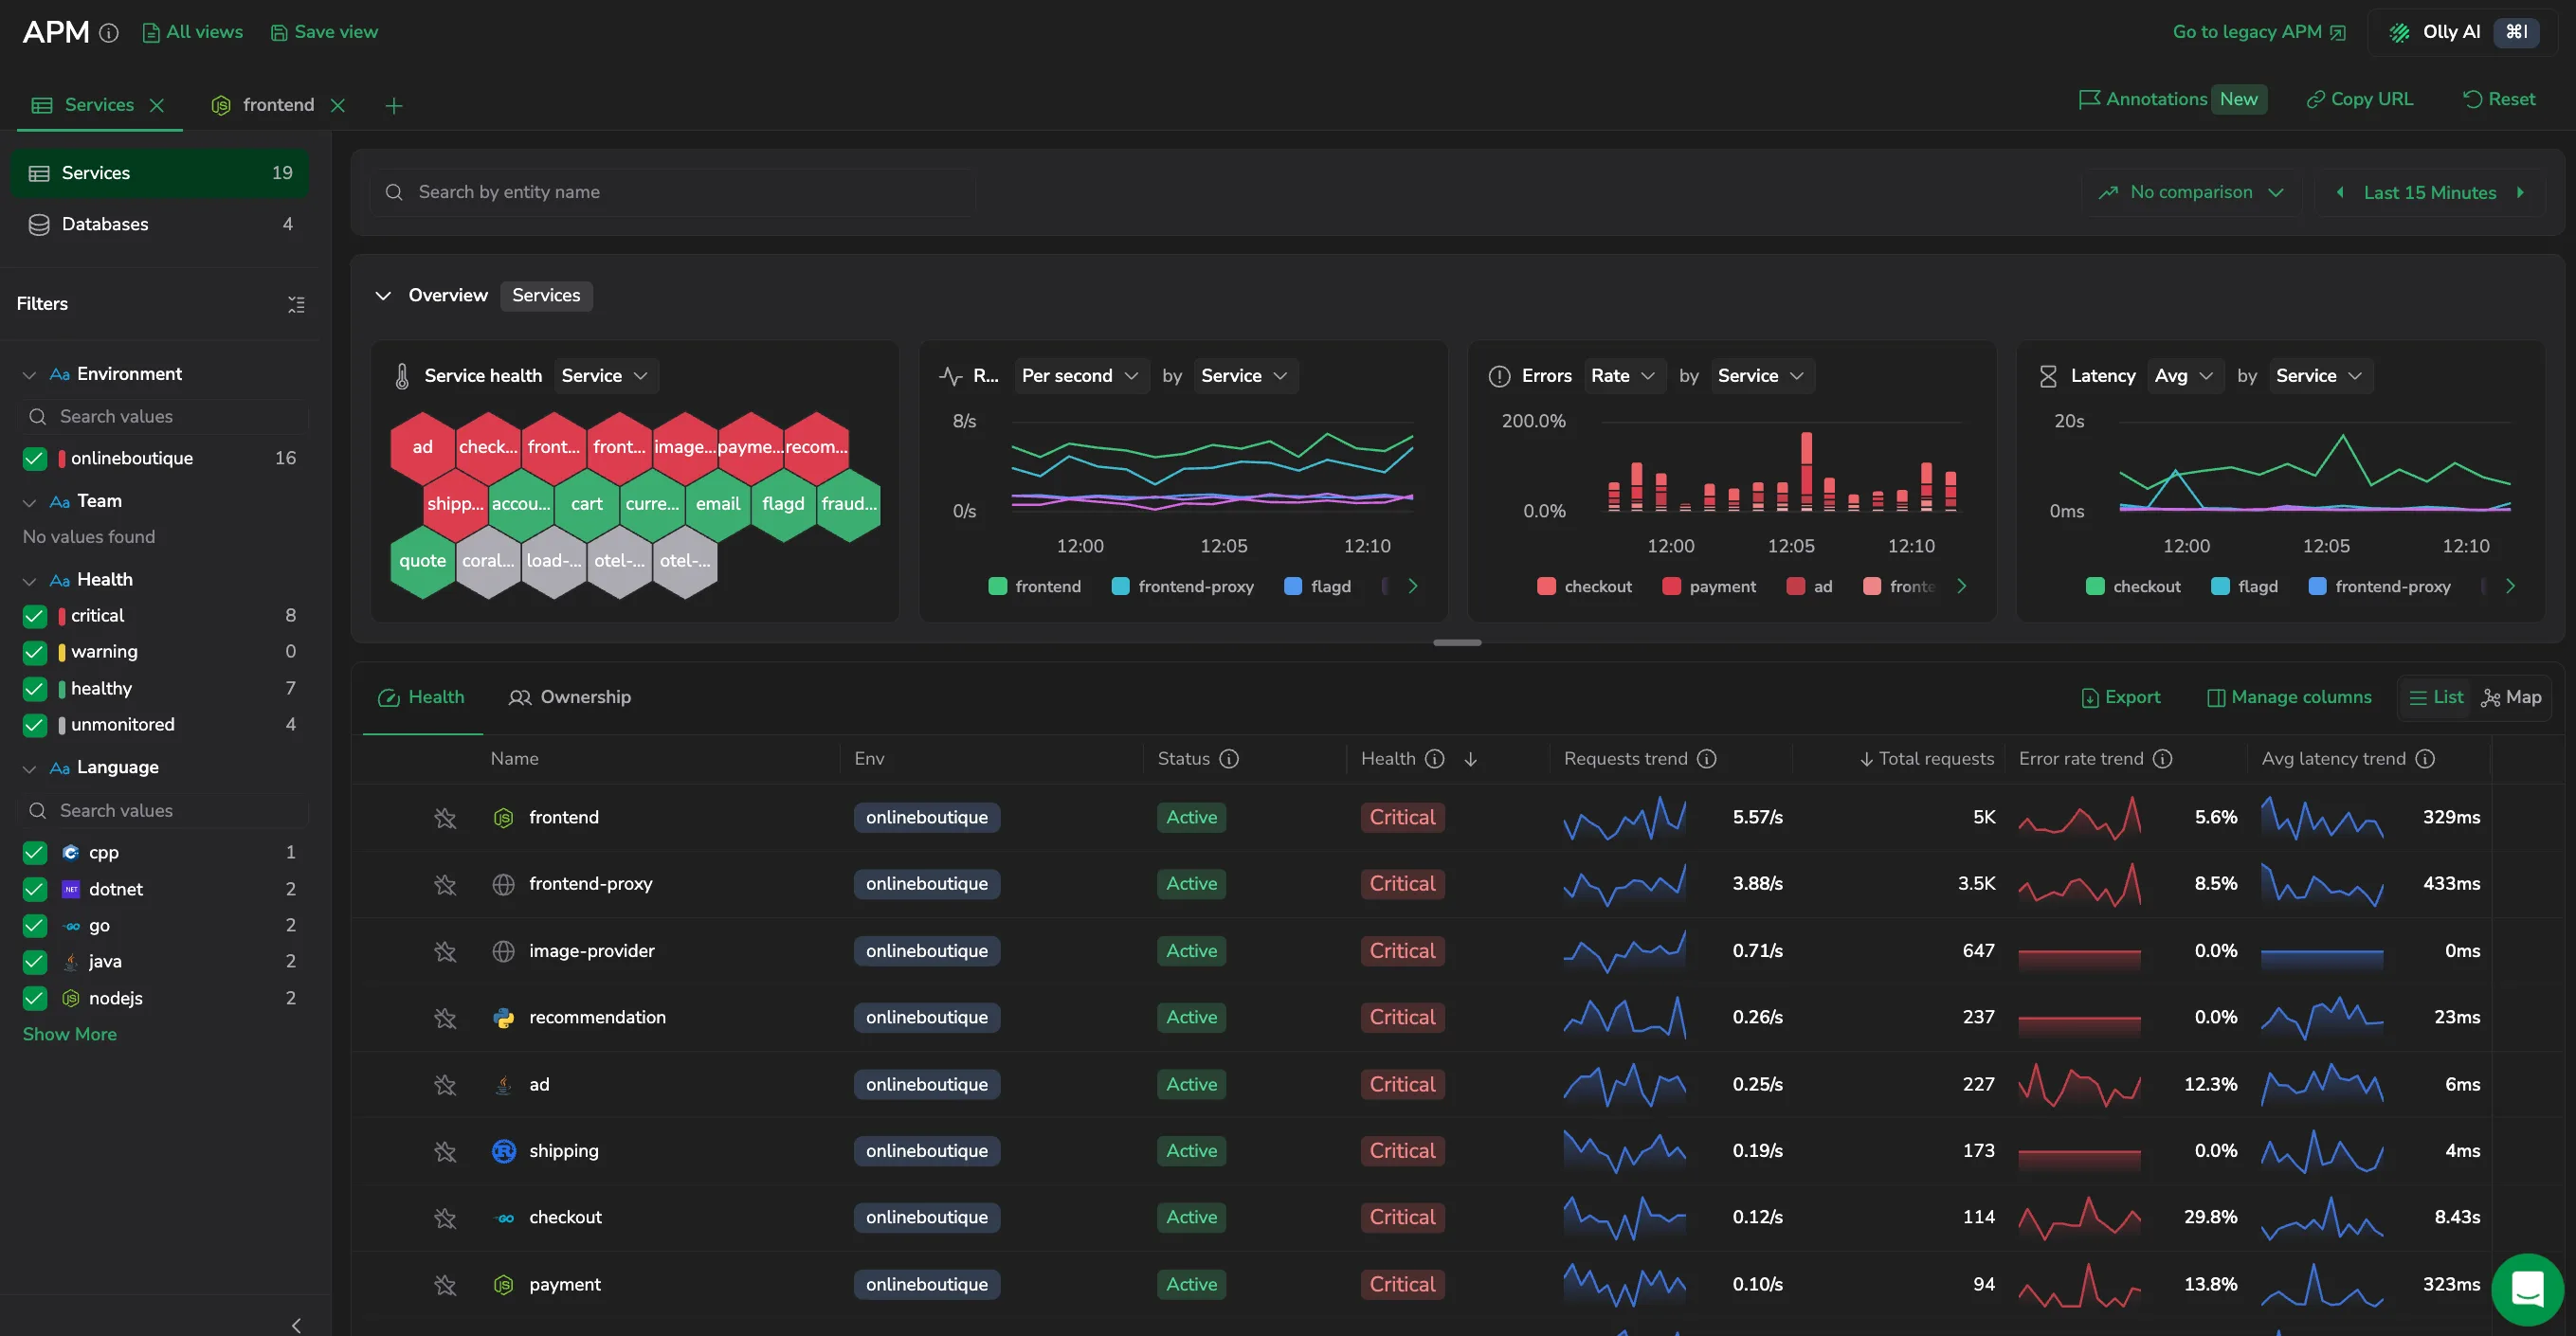
If a service, database, or metric is missing, see APM v2 isn't showing my data.
Optional: tune and extend
Once data is flowing, harden and enrich it:
- Sampling: the Helm chart uses head sampling by default. For error- and latency-aware sampling, move to tail sampling - Kubernetes or Docker Compose.
- Correlate logs: with OpenTelemetry, Coralogix correlates logs to a service automatically when the logs carry standard trace and span IDs (
trace_id/span_id) and service context (such as a subsystem name that matches the service). Correlated logs then appear on the entity's Logs section. If your logs don't carry those fields, set up log correlation. - Correlate infrastructure: send infrastructure telemetry so the Infrastructure section links a service to the hosts, pods, and containers it runs on. The Coralogix Helm chart labels spans and metrics consistently, which is what lets Coralogix match them.
- Serverless (AWS Lambda): auto-instrument AWS Lambda with the OpenTelemetry Lambda auto-instrumentation.
- Align attribute names: when you upgrade OpenTelemetry versions, use the transform processor to keep attribute names stable - see Aligning Coralogix and OpenTelemetry naming conventions.
Configure Span Metrics
Coralogix derives Span Metrics from your spans. To customize what it generates and keep cardinality in check, see:
- Span Metrics: overview and concepts.
- Recommended configurations: generated metrics, dimensions, sampling, and histogram buckets.
- Cardinality limiting: control high-cardinality metrics.
Next steps
Once your services are sending spans, learn how Coralogix turns them into long-term metrics in the Span Metrics overview.
Additional resources
| GitHub documentation | Coralogix OTel integration for K8s |
| Tutorial | OpenTelemetry and Coralogix introduction |
| Tutorial | OpenTelemetry Lambda function integration |
| Tutorial | ECS to Coralogix using OpenTelemetry |
| Documentation | APM permissions |