API error tracking
Overview
Consistent monitoring of collected errors is crucial for maintaining the health and performance of your system. When there are many individual error events, it becomes hard to prioritize errors for troubleshooting. API Error Tracking simplifies debugging of backend services by assembling thousands of similar API errors into a single group, enabling you to:
Follow, grade, and resolve fatal errors.
Categorize similar errors into error groups. For example, organize all errors with HTTP status
502 Bad Gatewayinto one group or collect all errors with gRPC status5 - NOT_FOUNDinto another. These groupings help you identify and prioritize API errors that are most impactful, reduce noise, and minimize service downtimes.Track issues over time to determine when they started, whether they are ongoing, and how frequently they occur
Data sources
Service error data is extracted from spans within the time interval selected in the time picker, based on HTTP or gRPC status codes. To enable API error tracking using span metrics, follow the instructions here.
Monitor and resolve service errors
- Navigate to APM, then Service Catalog. Select a service of interest.
- On the service page, go to the API Errors tab.
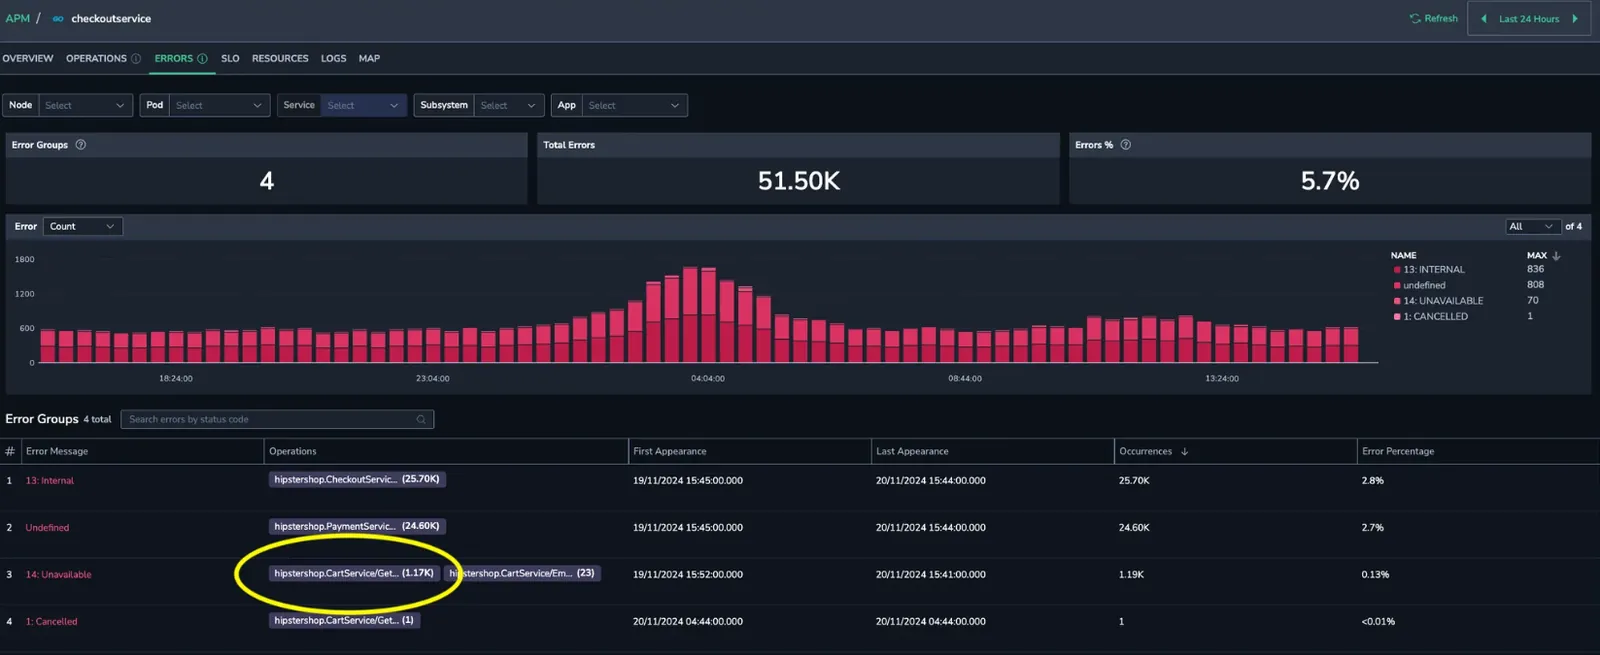
- View aggregated information related to service errors:
- Number of error groups.
- Total number of API errors.
- Percentage of API errors in relation to the total number of service requests.
- Select the Errors chart to display a modal with a detailed view of the error occurrences. The chart presents errors over time (count and percentage) for the top error groups that affect most of your service operations. Use this information for:
- Better understanding of error dynamics in the service.
- Identifying error spikes.
Scroll down to the detailed Error Groups summary to study the following:
- Error messages and related operations for each group.
- The first and last appearances of this error within the selected time range.
- Total number of occurrences and error percentage.
Use this information to cut down on noise and improve the visibility of the error data. Easily locate a specific error group using the Search field above the Error Groups tables.
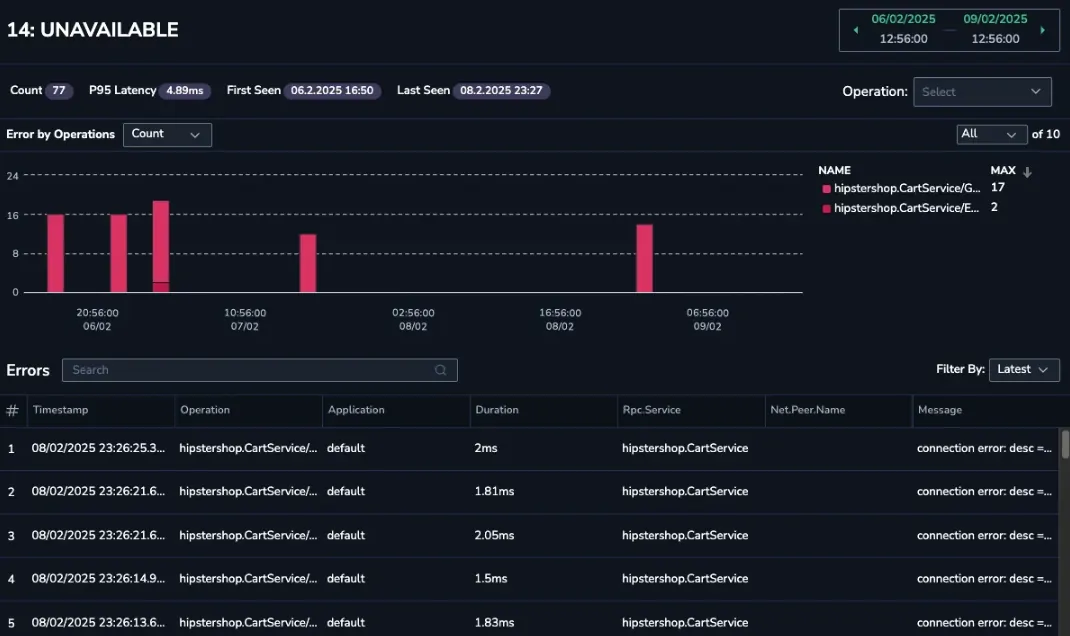
Select an error group to open a side panel displaying a graph that illustrates the error distribution across services. This will help you identify which operations have been most impacted by the error over time.
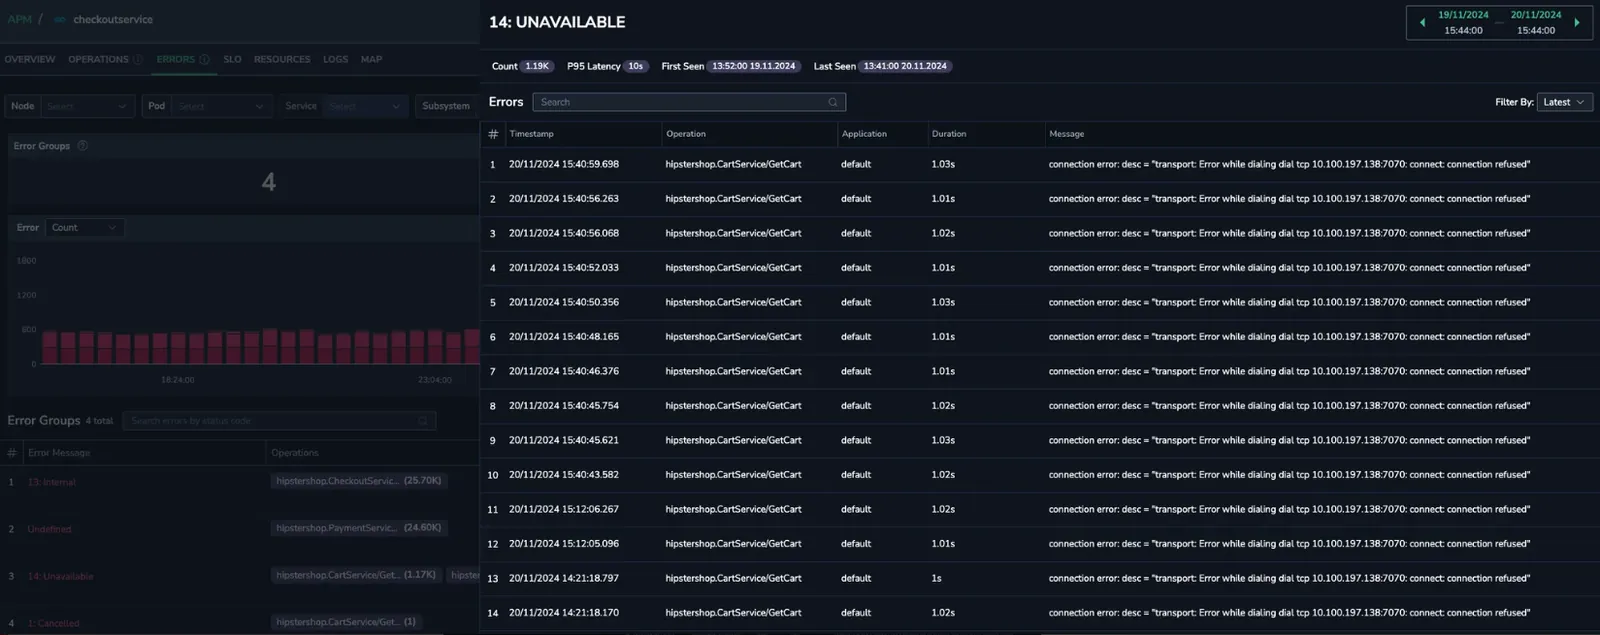
Group the errors:
- For gRPC errors, group errors by operation.
- For HTTP errors, group errors by operation or method.
Display errors related to a specific operation or all operations.
- Search for a particular error.
- Filter by latest, P95 or P99 percentile.
- View the error details.
- Select a specific error to open the errored service span.
Typical use cases
The API Errors tab focuses on profiling errors to uncover their specific impact on service operations. Its time-based analysis provides valuable insights, enabling you to break down the data across various dimensions, such as the frequency of different error groups and the specific components of the affected service. The use cases below focus on understanding error patterns, prioritizing their resolution, and minimizing their operational impact.
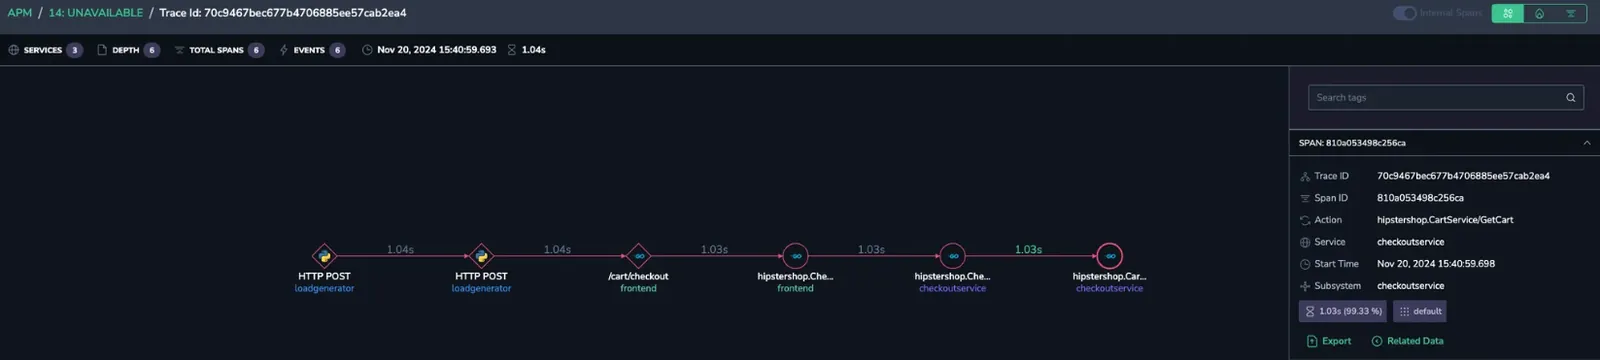
Isolating errors by component
Identify the specific endpoint or outgoing call causing particular error types, enabling you to take precise, targeted actions to resolve the issue efficiently.
Scenario
You notice 14 Unavailable errors associated with a specific service endpoint, hipstershop.CartService/GetCar.
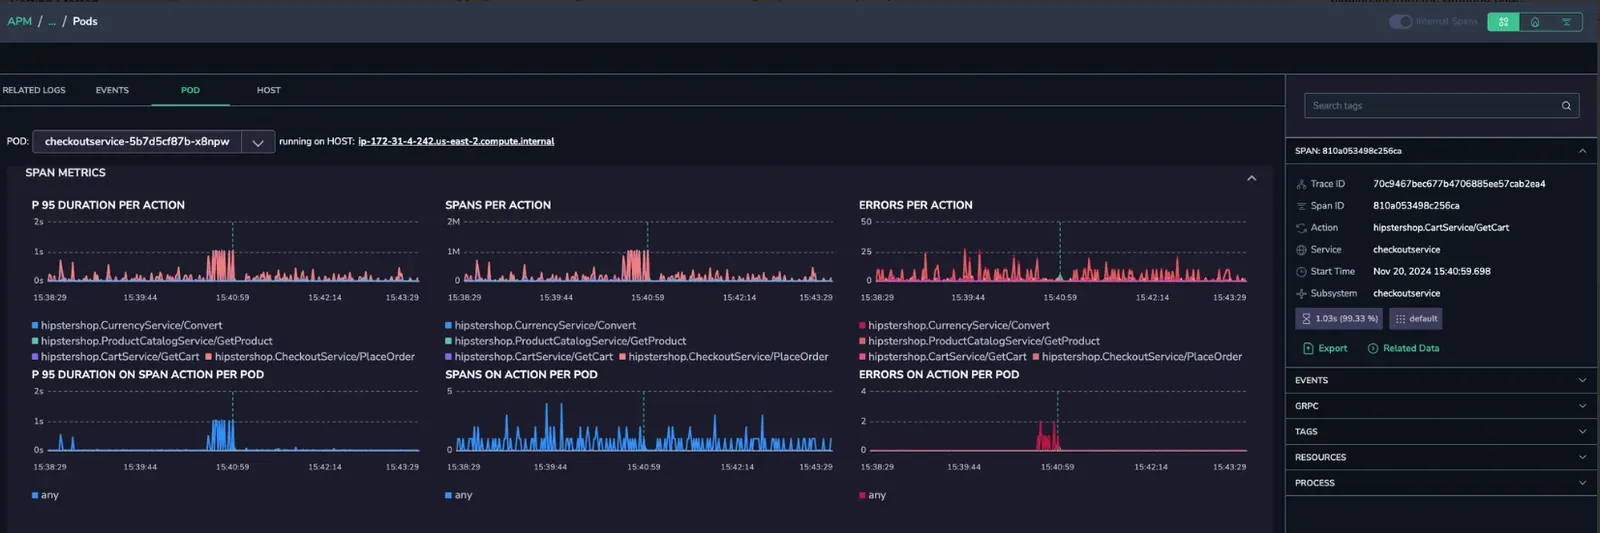
Root cause identification
Track the errors to pinpoint their root cause. Then, debug to uncover any configuration issues within the region, which can be swiftly identified and resolved.
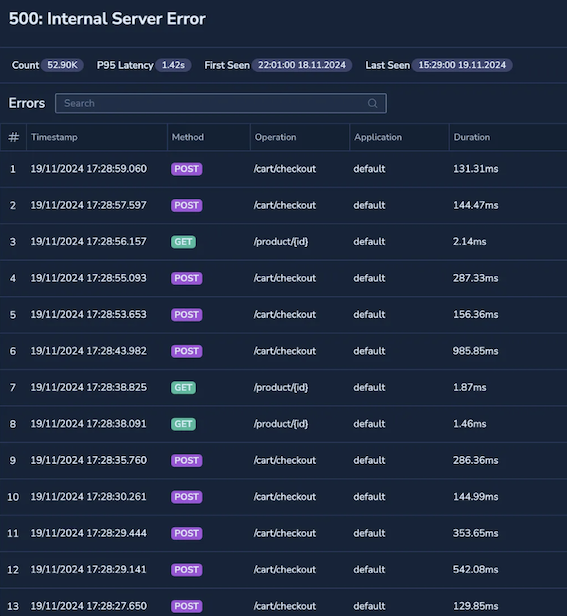
Error classification
Understand error categories, such as HTTP 500, gRPC UNIMPLEMENTED, to pinpoint specific issues and their operational impact.
Scenario
Frequent HTTP 500 Internal Server Errors are observed in checkout API.
Root cause identification
Error classification reveals the issue stems from a misconfigured database operation. This insight enables swift optimization and resolution of the issue.
Time-based analysis
Use error trends to identify recurring patterns, such as spikes triggered by deployments or traffic surges.
Scenario
Spikes in HTTP 503 Service Unavailable errors are detected every morning between 9 and 10am.
Root cause identification
Through time analysis, you can correlate the issue with an automated backup process that is overloading the API. This insight helps pinpoint the root cause, enabling you to address the overload effectively.
Prioritize error resolution based on their impact and urgency
Prioritize resolving errors that have the greatest operational impact to minimize service disruptions and maintain optimal performance.
Scenario
An authentication service is reporting frequent HTTP 401 Unauthorized errors, while fewer HTTP 500 Internal Server Errors are having a notable impact on user logins.
Root cause identification
Prioritizing the resolution of HTTP 500 errors is crucial, as fixing them first restores critical functionality and ensures uninterrupted user logins.
Next steps
Trace errors back to the user-facing flows that triggered them by exploring Transactions.
Additional resources
| Documentation | Application Performance Monitoring: Components, Metrics, and Practices |
| Tutorial | Introduction to APM |
Support
Need help?
Our world-class customer support team is available 24/7 to walk you through your setup and answer any questions that may come up.
Feel free to reach out to us via our in-app chat or by sending us an email to [email protected].