Comparison mode
Overview
Comparison mode is designed to provide context to your APM metrics data. It allows you to compare the current application performance (requests, errors, or latency) with data from 1, 2, 4, 7 days ago, previous consecutive period or a custom timeframe. This comparison not only gives you a snapshot of the current performance but also helps you understand the evolution of each metric. Using this mode, you can effectively contextualize your metric data, gaining valuable insights to troubleshoot your application performance. Moreover, it allows you detecting service anomalies within a specific timeframe by introducing a trend indicator and turning your service and database catalogs into powerful continuous improvement tools.
Configuration
Select the Comparison Mode button, which is available on the following APM pages:
- Service Catalog and the Operations tab in a service drilldown.
- Databases Catalog and the Operations tabs in a database drilldown.
From the Compare To menu, select the time period that the current performance data will be compared to:
- 1 day ago: Performance data collected 1 day ago.
- 2 days ago: Performance data collected 2 days ago.
- 4 days ago: Performance data collected 4 days ago.
- 7 days ago: Performance data collected 7 days ago.
- Previous consecutive period: Performance data collected during a previous preset timeframe relative to the present time. For example, if your currently-selected timeframe is Last 15 minutes, the performance is compared to the previous 15-minute period, based on the same clock time.
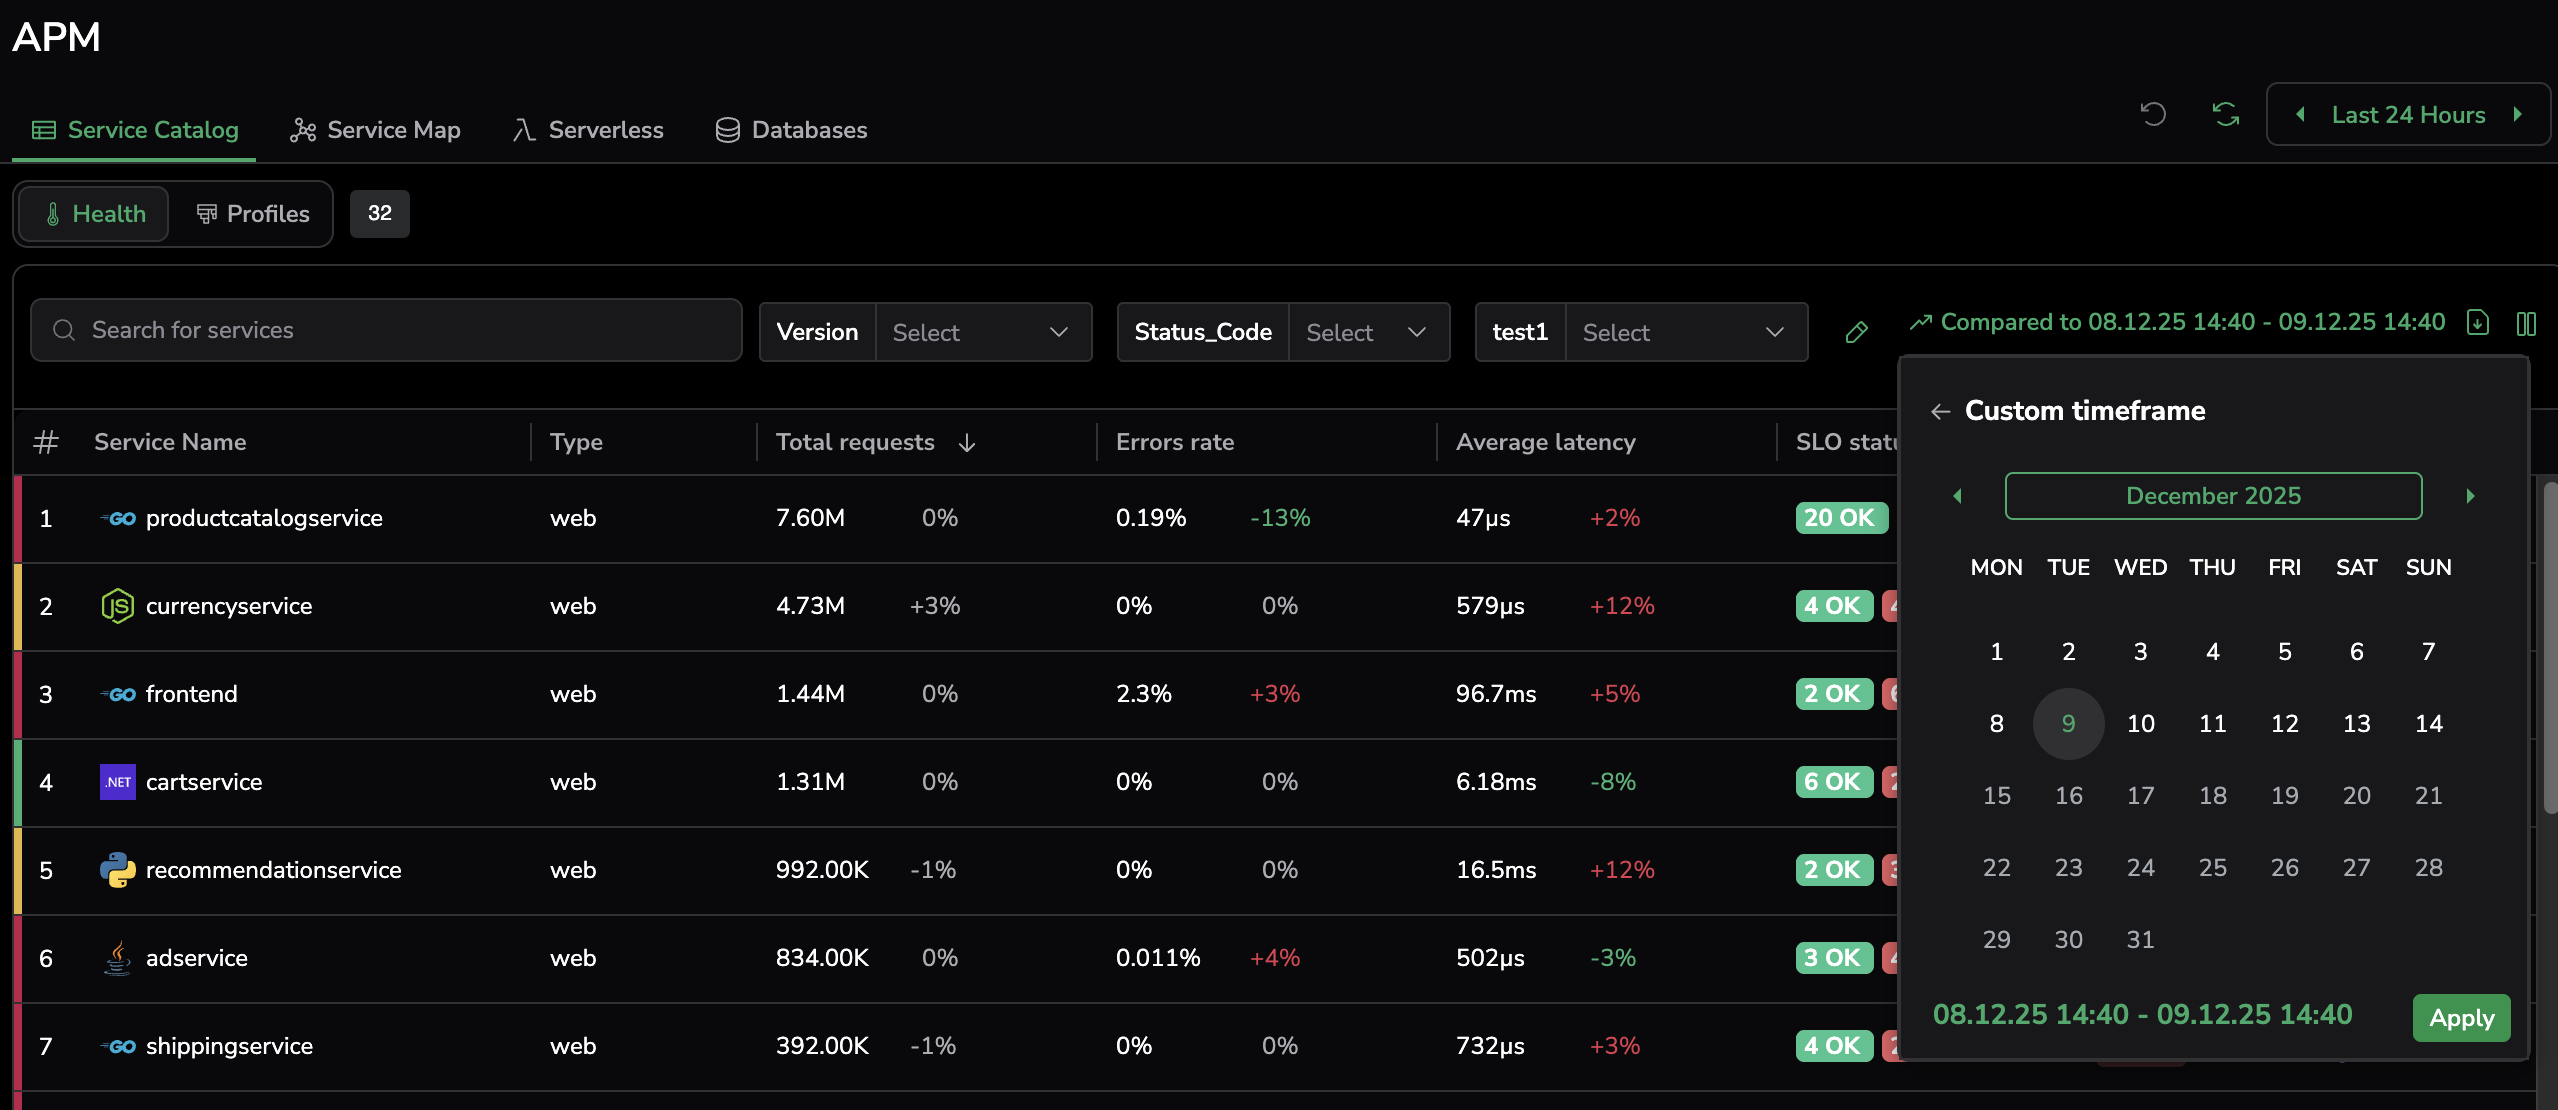
- Custom timeframe: Performance data collected during a user-specified period of time. When you choose this option, you must select a date from the calendar view. The timeframe for comparison is calculated according to: - A day selected from the calendar view - Current time - Interval selected in the time picker
For example, the current date and time are December 15th, 14:40:00, and the time picker is set to Last 24 hours. When selecting December 9th, the current data is compared with metrics from December 8rd, 14:40:00 to December 9th, 14:40:00, based on the same clock time.
Your selection is displayed next to the Compared To button. The Service Catalog page displays changes, reflecting improvement (green) or deterioration (red) of the services during selected timeframe.
