Database monitoring
Part of Application Performance Monitoring, Coralogix’s Databases monitoring offers comprehensive insights into databases and service-database interactions across your host environment, enabling efficient and rapid troubleshooting of issues as they emerge.
Getting started
Instrumentation
To get started with Databases, set up APM. This includes instrumenting your service to generate spans and installing the OTel Collector.
TCO optimizer
The span kind Client, which includes the database queries, must be sent to the TCO pipeline, priority level: Medium.
Semantic conventions for database client calls
Follow these instructions to add connection-level attributes to your spans. The labels below allow us to identify your system's service-database interactions. All labels are required.
| Attribute | Type | Description | Examples |
|---|---|---|---|
db.system | string | An identifier for the database management system (DBMS) product being used. | elasticsearch, dynamodb, mysql, postgresql |
db.name | string | This attribute is used to report the name of the database being accessed. | customers, main, ws-alerts, ops |
db.operation | string | The name of the operation being executed. For example, the MongoDB command name findAndModify or the SQL keyword | Select, Upsert, Update, Bulkdelete |
db.statement | string | The database statement being executed | SELECT * FROM wuser_table; SET mykey "WuValue" |
net.peer.name | string | Identifies the host name or IP address of the peer (remote host) involved in the communication | net.peer.name="example.com" or net.peer.name="192.0.2.1" |
Explore Coralogix Databases
Through service instrumentation, Coralogix identifies interactions between your services and databases. The Databases tab presents all identified databases that interact with your instrumented services.
Navigate to APM, then Databases in your Coralogix toolbar.
Master your database landscape: a complete overview
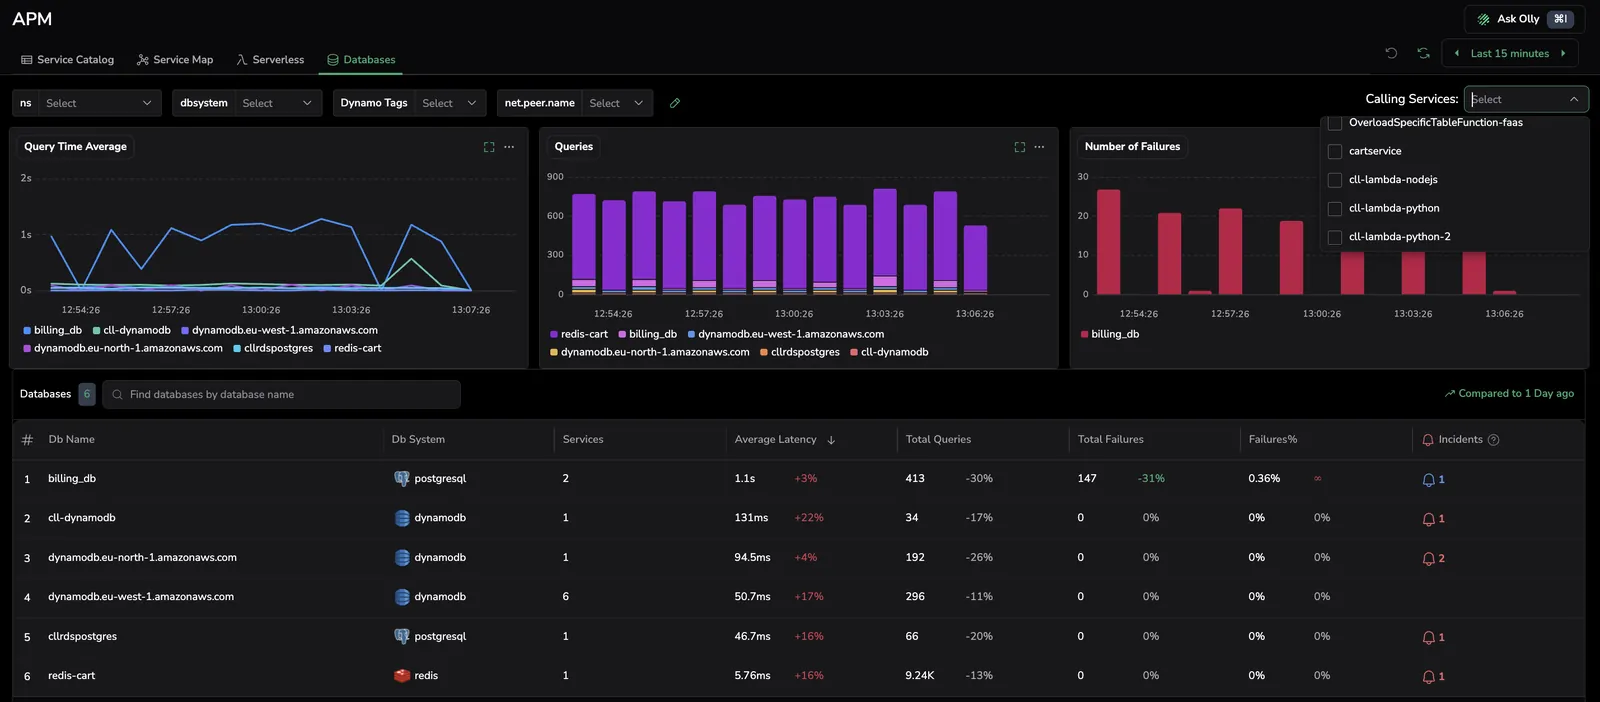
The APM Databases tab provides a panoramic snapshot of all databases interacting with instrumented services within your system during a specified time frame.
-
Visualize query times, query failures, and failure rates across all queries, with easy filtering based on span attributes such as
db.nameordb.user. -
Dive into database usage patterns using the Databases table, which aggregates data by database name. Each row shows total queries, total failures, and failure rate. Add Queries/s and Failures/s from the column picker to see the per-second rates alongside the totals.
-
For detailed investigation, filter the Databases table by calling service to analyze service operations per specific database. Refine your analysis by filtering data based on any tag or process tag associated with the calling service.
Select any row in the Databases table to investigate a specific DB host.
Deep-dive into database performance metrics
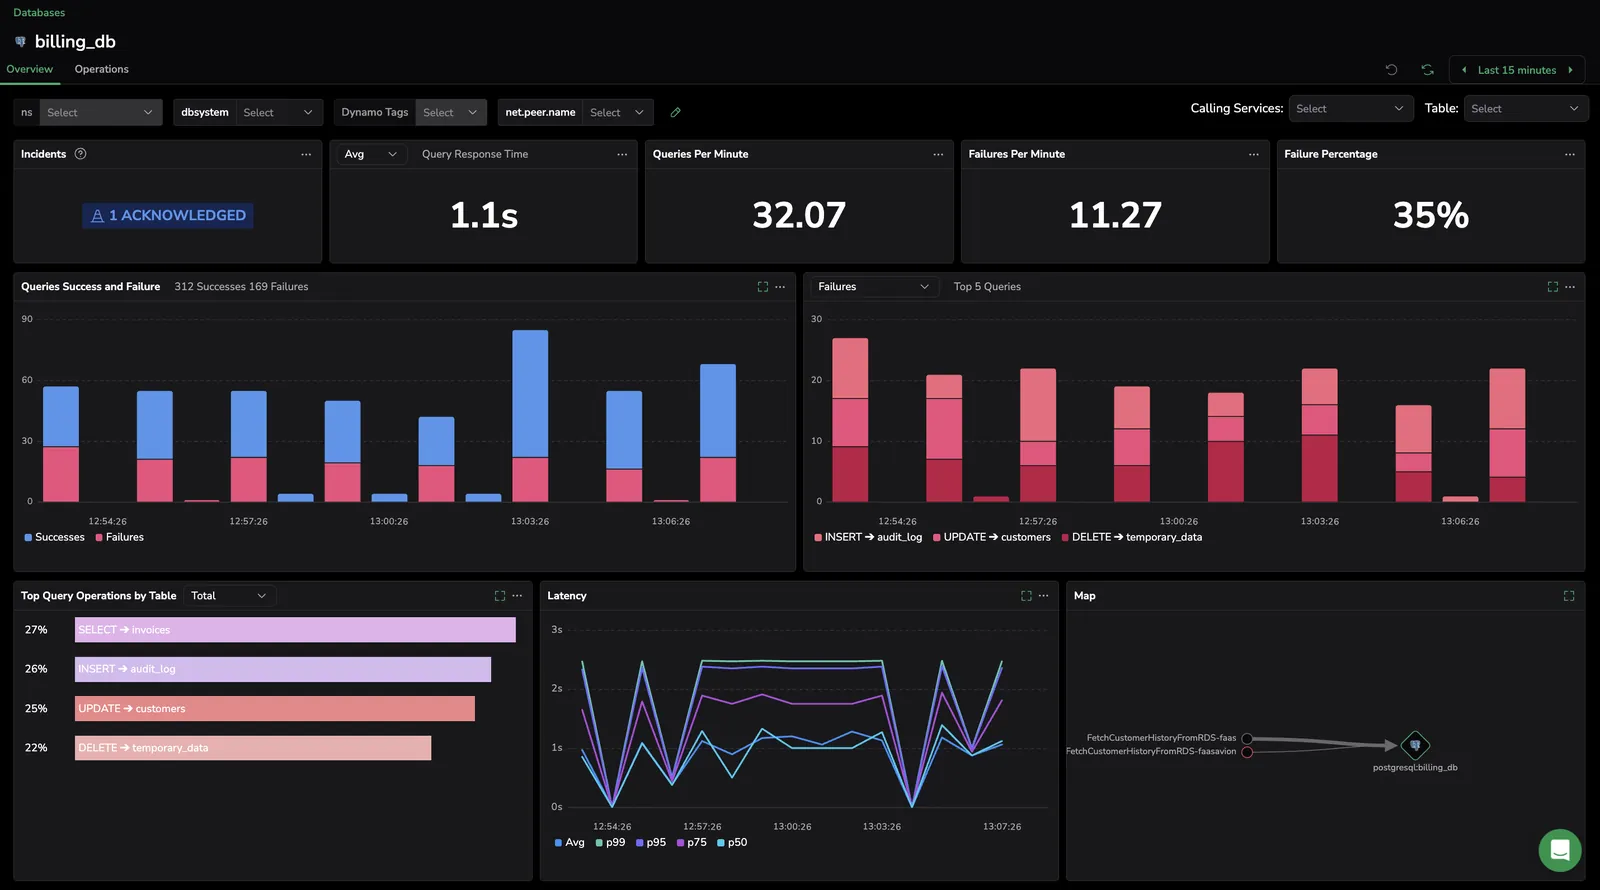
The Overview tab presents database performance metrics. View a database’s performance over time, interactions with each calling operation, and queries.
-
Visualize database performance metrics to rapidly identify queries and operations grouped by DB tables requiring troubleshooting.
-
Identify slow queries and which queries are consuming the most time.
-
Incorporate service-based filters to observe specific database-service interactions.
Investigate operations
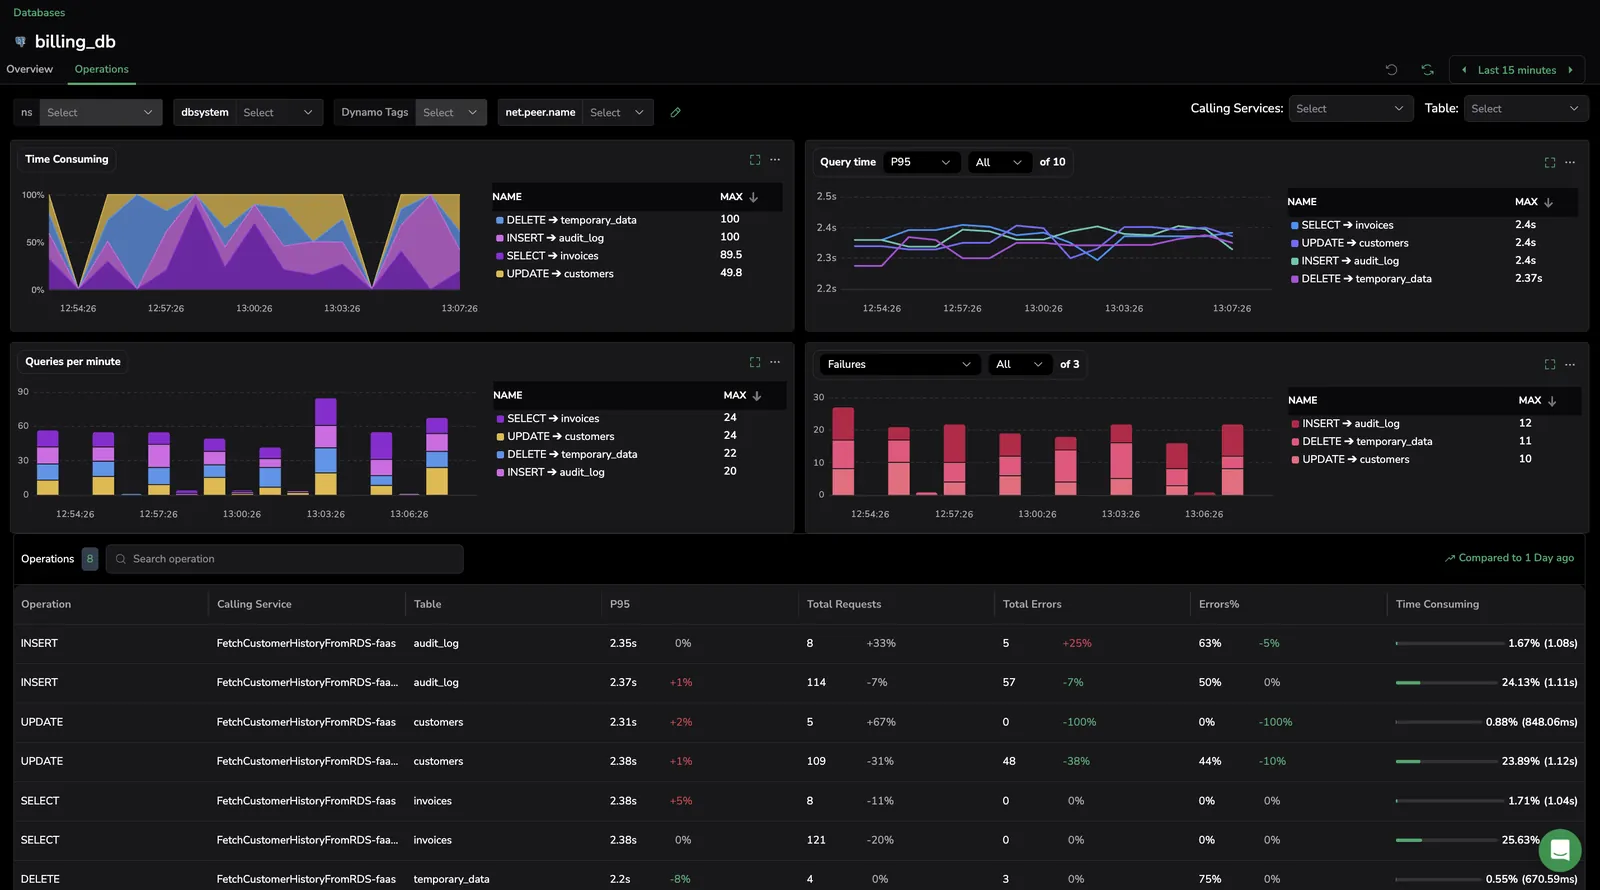
The Operations tab shows query performance metrics categorized by operation and table, showcasing their evolution over time within the selected time frame.
-
Visualize database performance metrics to quickly pinpoint queries and operations associated with DB tables that may require troubleshooting.
-
Examine individual service call operations in the Operations table to identify specific interactions between services and database tables.
-
Filter based on the services initiating calls to the database.
-
On the query-time chart, select the latency aggregation to display — avg, P50, P75, P90, P95, or P99.
-
Add Requests/s and Errors/s to the Operations table from the column picker to see the per-second rates for each operation alongside the totals.
Per-second columns in the Databases and Operations tables (Queries/s, Failures/s, Requests/s, Errors/s) require Span Metrics as the APM source. They are hidden for accounts sourced from Events2Metrics. Hover the help icon next to each per-second column header to see the metric name in full.
Examine database queries
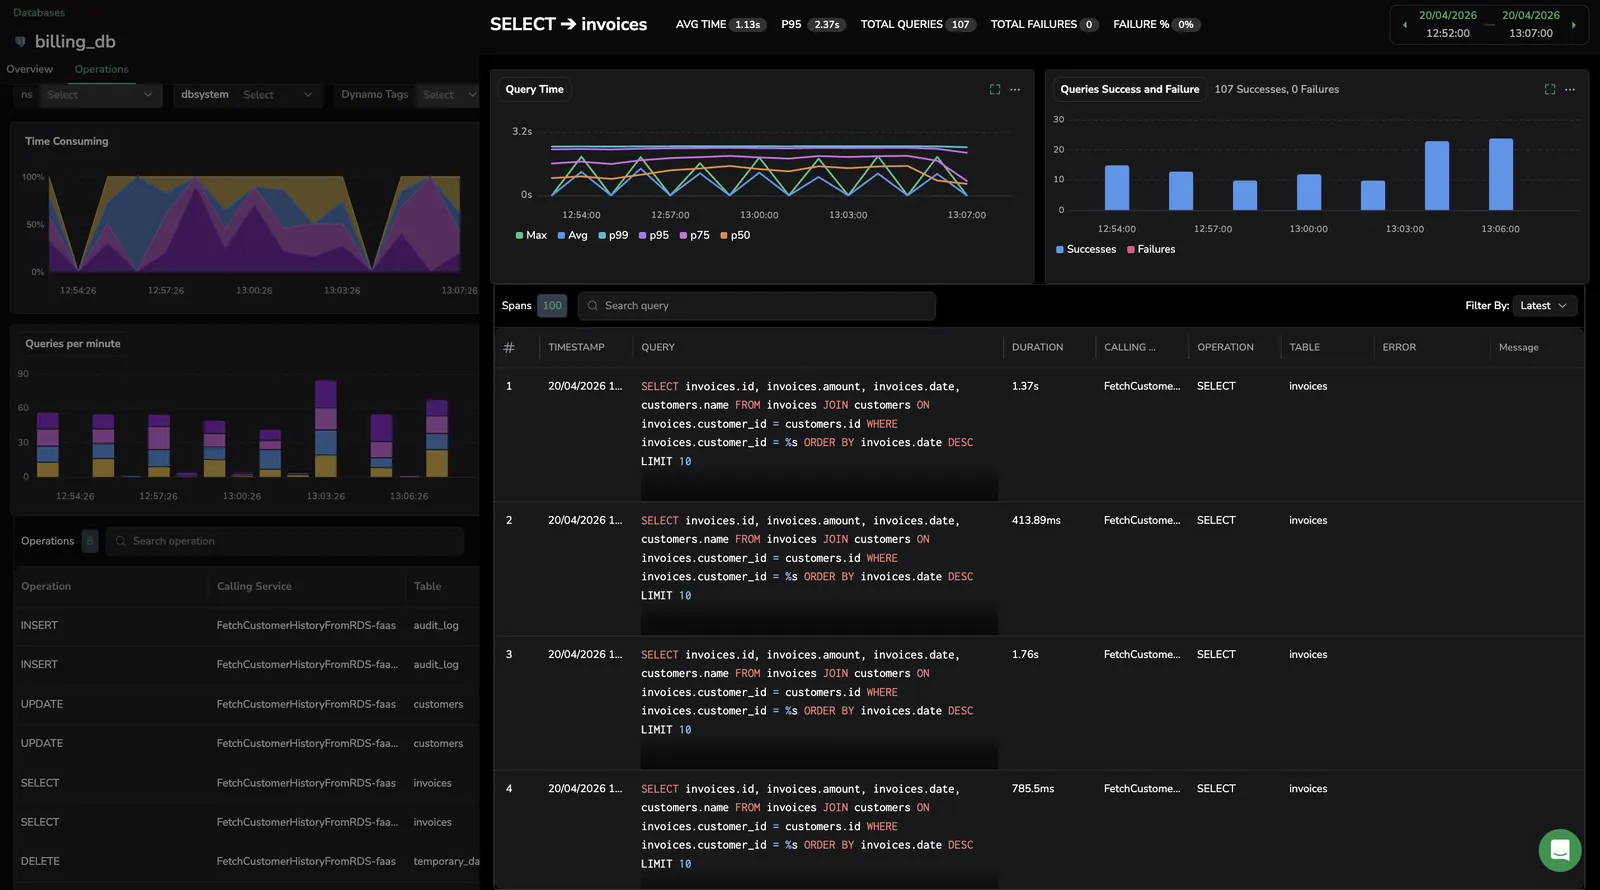
Deep-dive into database queries by clicking on any operation or widget across Databases. This will open a detailed side modal showcasing related spans, allowing users to examine specific database queries and their impact.
-
Visualize query time metrics and compare total failed responses against total success per DB operation grouped by DB table. Graphs update automatically to the selected time frame.
-
Investigate queries associated with a chosen operation in the Queries Grid. Columns are sortable and adjustable.
-
Enjoy a detailed view of all call attributes specific to the queried database.
-
Examine specific database queries and their impact within the broader context of Coralogix’s Application Performance Monitoring. You can easily navigate to a span’s Trace ID page, view raw span data, and copy and share links to specific traces for collaborative troubleshooting.
Database retention
If a database has no service interactions for 30 days, the database is removed from the Database Catalog. This practice ensures the Catalog remains current and uncluttered, simplifying user navigation. To adjust the 30-day retention period, use our Service Retention gRPC API. If service interaction resumes after a database's removal, the database will reappear in the Database Catalog.
Next steps
Scope these views to a single deployment with the Environment filter so production and staging don't blur together.
Additional resources
| Documentation | APM Onboarding Tutorial Service Retention gRPC API |