Environment filter
Overview
The Environment filter in APM provides an easy and consistent way to query, filter, and group APM telemetry data by environment (for example, dev, staging, or prod). It is enabled for Span Metrics users in both compact and full modes, and its usage is optional.
The following image shows the Environment filter enabled in APM.
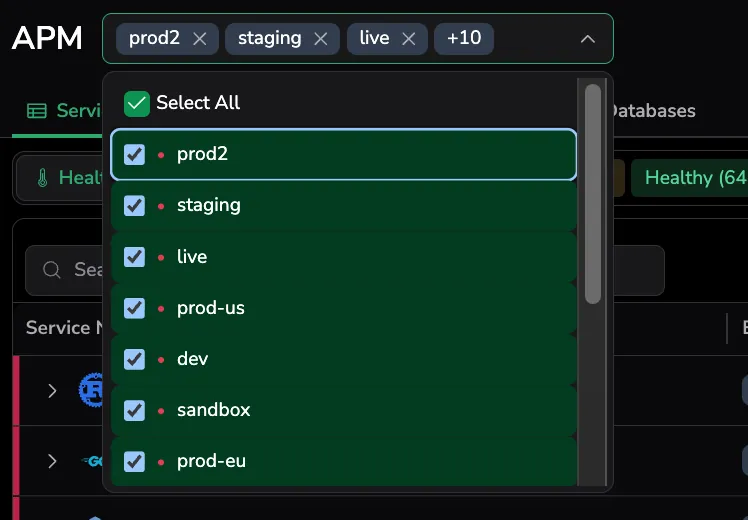
Selected environments appear as removable chips in the APM toolbar — select the × on a chip to drop that environment from the selection. When the selection exceeds the visible width, an overflow indicator (for example, +11) shows the remaining count. Use the chevron to open the dropdown and edit the full selection.
Filter scope across APM views
Once configured, the Environment filter applies across APM. Its behavior differs on the main catalog pages and inside a service drilldown.
On main catalog pages
On the Service Catalog, Database Catalog, and Profiles pages, the Environment filter is the top-level filter. It controls which services appear in the list and scopes the metrics shown in each row. Selection here persists as you navigate between catalog pages and into a service drilldown.
In the service drilldown
Inside a service drilldown, a separate Environment filter appears that is scoped to the current service. It behaves as follows:
- Available options: only environments that the current service has reported spans in. Environments that belong to other services are excluded. The filter shows the service's environment count (for example,
out of 10) rather than the catalog's total environment count. - Default selection when opened from a service row: your current catalog-page selection carries over, intersected with the service's available environments. If you had a subset selected in the catalog, that subset is preserved in the drilldown.
- Default selection when opened from an environment row: only that environment is pre-selected. Expand a service in the Service Catalog with the chevron and select an environment row to use this entry point.
- Switching services: selections that are not valid for the new service are dropped. If no valid selection remains, all of the new service's environments are selected.
- Additional filters: any dynamic filters you apply inside the drilldown are scoped to the selected environments.
- Returning to the catalog: your original catalog-page selection is preserved, and the count returns to the catalog's total environment count. Drilldown-only changes are not propagated back.
Why use environment filter?
The Environment filter helps to organize and analyze telemetry data according to where code is running. This prevents signal overlap between environments and keeps dashboards, alerts, and investigations scoped to the correct context.
User benefits
- Faster triage and on-call: Focus on a specific environment (for example,
production) without noise from test or staging data. - Release validation: Compare latency and error rates between staging and production during rollouts.
- Cost and optimization: Attribute ingest volume, error hotspots, or heavy endpoints to particular environments for better resource management.
Configuration
Coralogix Helm deployments (Kubernetes)
Set the deploymentEnvironmentName once in Helm, and enable resourceDetection:
# values.yaml
global:
  deploymentEnvironmentName: "<dev|staging|prod>"

presets:
  resourceDetection:
    enabled: true
    # Uses the value above to populate OTEL resource attributes
    deploymentEnvironmentName: "<dev|staging|prod>"
How it works:
global.deploymentEnvironmentName: The single value you define in Helm.presets.resourceDetection.deploymentEnvironmentName: Applies that value as the OpenTelemetry resource attributedeployment.environment.namein the Collector configuration.
This setup ensures consistent Environment values across all rendered templates and avoids duplication.
Note
When using the k8s.cluster.name label, its value is automatically populated into deploymentEnvironmentName.
Non-Helm deployments (non-Kubernetes or custom)
For non-Kubernetes or custom installations, define the deployment.environment.name value directly in the Collector configuration:
processors:
  resourcedetection:
    detectors: [env, system]
    override: false

  resource:
    attributes:
      - key: deployment.environment.name
        value: "staging"      # or ${env:DEPLOY_ENV}
        action: upsert

service:
  pipelines:
    traces:
      processors: [resourcedetection, resource]
    metrics:
      processors: [resourcedetection, resource]
    logs:
      processors: [resourcedetection, resource]
How it works
- The
deployment.environment.nameresource attribute is added at the OpenTelemetry Collector or agent layer and automatically included in all signals (traces, metrics, and logs). - You can set this as a fixed string (for example,
"staging") or use an environment variable (for example,${env:DEPLOY_ENV}) for flexibility across deployments.
Next steps
Get notified when an environment's metrics deteriorate by setting up Monitoring with alerts.