Monitor operations
The Operations tab breaks a service down into its individual operations (the incoming, outgoing, and internal requests it handles) so you can find the slowest, busiest, or most error-prone endpoints and drill into their spans.
Use the Operations tab to:
- Compare response time, throughput, and error rate across a service's operations.
- Separate incoming, outgoing, and internal traffic to isolate where latency or errors originate.
- Drill into a single operation to inspect its latency percentiles, success and error counts, and individual spans.
What you need
Coralogix Application Performance Monitoring (APM) installed and configured.
Access the Operations tab
-
In your Coralogix toolbar, navigate to APM, then select the Service Catalog tab.
-
Select a service to open its drilldown, then select the Operations tab.
-
Use the Operations Type toggle to choose which traffic to view: Incoming, Outgoing, or Internal.
The environment filter and any drilldown dimensions scope the operations shown.
Operation types
The Operations Type toggle scopes the whole tab to one class of traffic:
- Incoming: requests the service receives, taken from server and consumer spans.
- Outgoing: requests the service sends to other services, taken from client and producer spans.
- Internal: operations internal to the service, taken from internal spans.
Summary charts
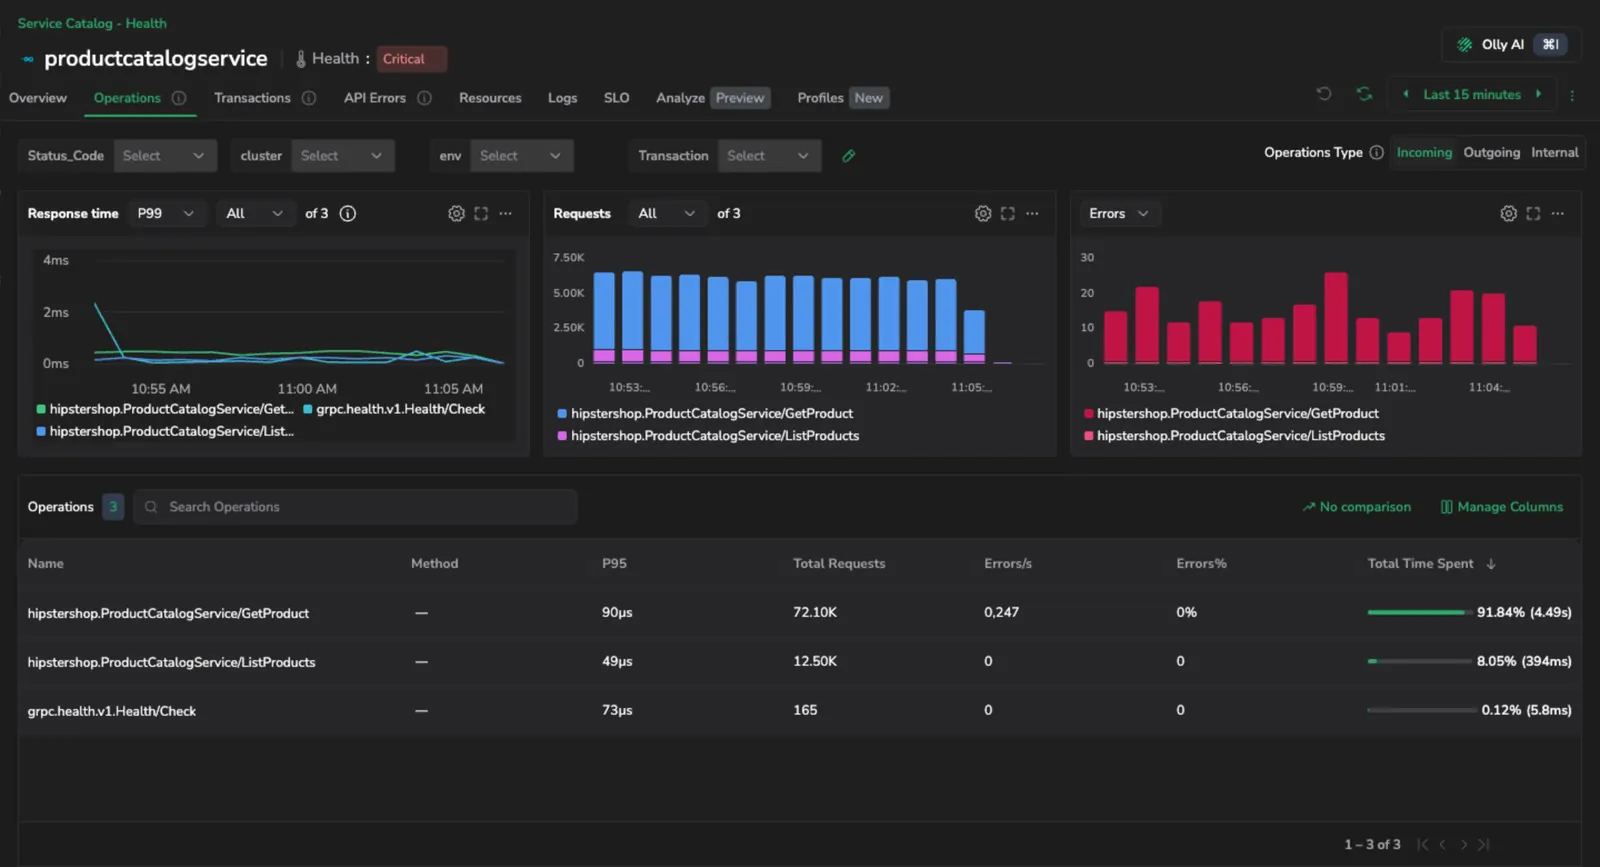
Three charts at the top of the tab summarize the selected operation type:
- Response time: response time across operations, with a percentile selector (P50, P75, P90, P95, P99, P99.99, P99.99999, or Avg). Use the series selector to plot all operations or the top 5, 10, or 20.
- Requests: request volume. Use the chart dropdown to switch between Requests/s (default) and Requests (absolute count). The Requests/s option is hidden when APM is sourced from Events2Metrics.
- Errors: error volume. Use the chart dropdown to switch between Errors (default), Errors percentage, and Errors/s. The Errors/s option is hidden when APM is sourced from Events2Metrics. When the service has no errors for the selected type, the chart shows a no-error state.
Each chart has its own visualization and scale controls. See Customize chart visualization.
Operations table
The table below the charts lists every operation matching the selected type. By default it shows:
- Name: the operation name.
- Method: the request method, where applicable.
- P95: 95th-percentile response time.
- Total Requests: total requests over the selected timeframe.
- Errors/s: errors per second. Hidden when APM is sourced from Events2Metrics.
- Errors%: error rate as a share of total requests.
- Total Time Spent: the operation's share of the service's total time, shown as a bar with the percentage and absolute time.
The table is sorted by Total Time Spent, descending, by default. Select Manage Columns to add other columns, including Requests/s (Span Metrics only), other latency percentiles (P99, P90, P75, P50, Avg), Throughput, Total Errors, and Errors Per Minute. Use the search box to find an operation by name, and the comparison control to compare each operation's metrics against an earlier period (for example, 1 day or 7 days ago). Select View query in the table toolbar to open a panel with the PromQL behind each column currently shown.
Rank and filter operations
For a service with many operations, rank the table and narrow it to the operations you care about. These controls apply to incoming, outgoing, and internal requests.
-
Top N selector: Limit the table to the busiest operations. Select Top 5 (default), Top 20, or Top 100 to set how many operations the table returns. Your selection is preserved as you re-sort.
-
Server-side ranking: Select a metric column header (for example requests, errors, error rate, or a latency percentile) to rank all of the service's operations by that metric and return the top N. The operation and method columns reorder the rows already loaded.
-
Operation-name filter: Filter the table to specific operations, and the ranking is computed over your selection. Only operation names that have already appeared in the results are available to select.
Investigate an operation
Select an operation row to open its drilldown drawer, which summarizes the operation over the selected timeframe. The header shows the operation name and three key metrics (Requests/s, P95 Latency, and Errors Rate) and a Go to Explore link that opens the operation's spans in Explore.
The drawer includes:
- Latency: latency over time by percentile (p99, p95, p75, p50, and avg).
- Successes and errors: successful and failed requests over time, with the total success and error counts in the chart header.
- Spans: a table of the individual spans for the operation, each with its timestamp, the transaction it belongs to, duration, and any error and error message. Use the search box to filter the spans, Order by to sort them, and Reset filters to clear the drawer's filters.
Select a span to open the trace it belongs to for full context.
Next steps
See how a service's operations combine into end-to-end flows in Transactions, or analyze its downstream calls in Dependencies.