Service Level Objectives (SLOs)
Overview
A Service Level Objective (SLO) is a measurable target that defines the acceptable performance or reliability level for a service, often expressed as a percentage (for example, 99% uptime or 95% request latency below a threshold). It represents an agreement between service providers and users on what "good enough" looks like.
Why are SLOs essential for APM?
In APM (Application Performance Monitoring), SLOs help teams prioritize and measure the health of their services in a user-focused way. They enable:
- Proactive issue management: Highlight potential problems before they affect user experience.
- Data-driven decisions: Align engineering efforts with user expectations by focusing on what matters.
- Efficiency: Avoid over-investing in unnecessary reliability, balancing business needs and operational costs.
- Accountability: Provide clear, measurable goals to monitor and improve service performance.
Creating an SLO
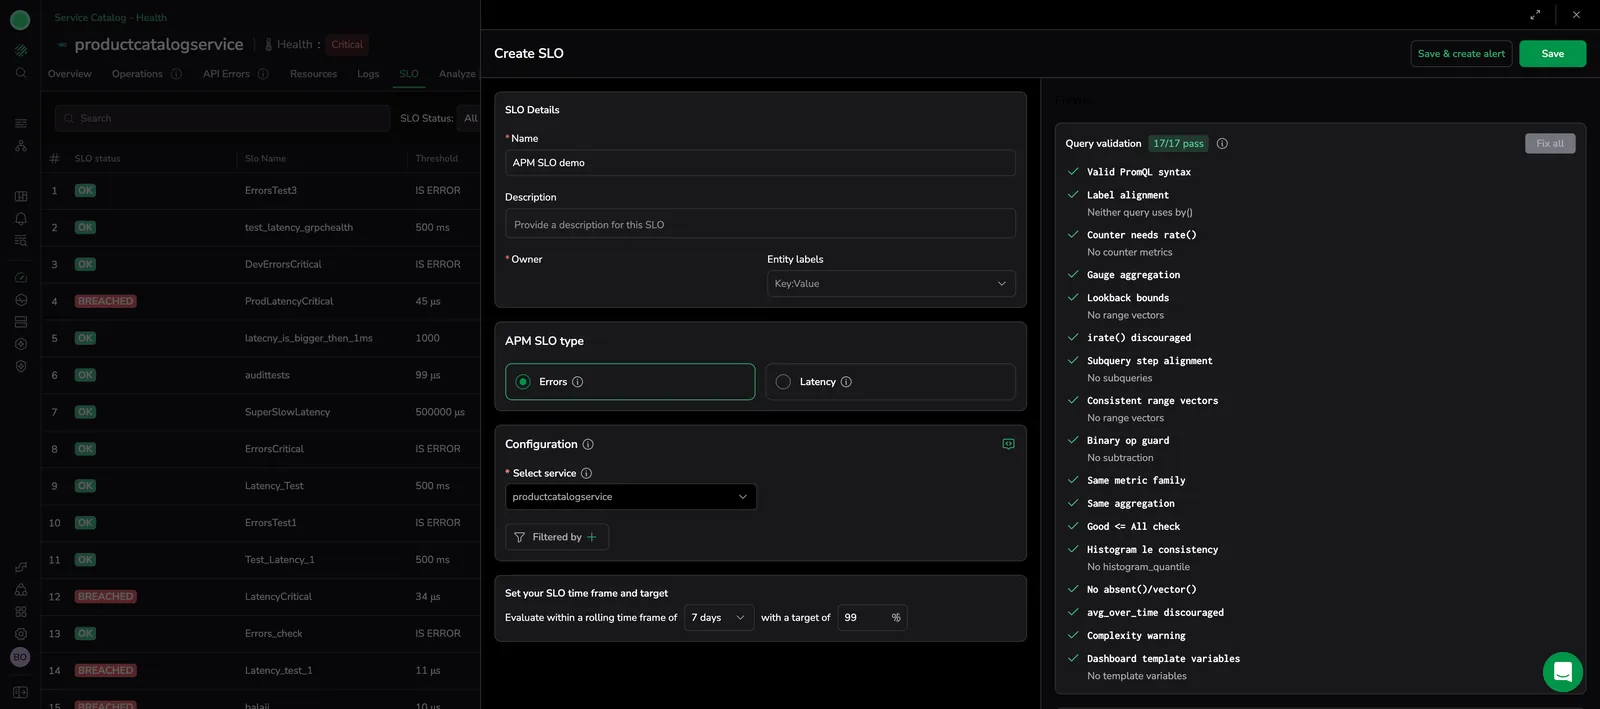
APM SLOs are created through the SLO Center. Selecting Add SLO from a Service Catalog drilldown opens the SLO Center create drawer with the SLO type and service pre-filled for the service you are viewing.
- From the SLO tab of a Service Catalog drilldown, select Add SLO. The SLO Center create drawer opens with the SLO type set to APM and the Service field pre-filled with the current service. Both fields are read-only.
- Configure the SLO — name, description, owner, entity labels, filters, time frame, target, and (for Latency SLOs) time window, aggregation method, and query threshold. For the full field reference, see Create SLOs.
- Select Create to save the SLO, or Save & create alert to create the SLO and immediately set up an alert based on it.
After you save, the SLO Center opens with the new SLO in the list.
To open the SLO Center directly from the SLO tab without creating a new SLO, select View in SLO Center.
SLOs view
The SLO tab of each service lists the legacy APM SLOs defined for that service. SLOs created through the Add SLO button appear in the SLO Center, not in this list.
Each row represents a single legacy SLO, displaying its definition and status. The following columns are key to understanding the detailed status of your SLOs:
- SLO Status: Displays whether the SLO is in an "OK" or "Breached" state based on its current state and remaining errors budget.
- SLO Name: The name of the SLO as provided during its creation.
- Threshold: Specifies the allowable limit for each of the measured events.
For SLOs on errors, the threshold is
Is Error. For SLOs on latency, the threshold is the maximum allowed duration. - Time: The defined evaluation period for the SLO, such as 7 days, 30 days.
- Target: Displays the predefined SLO target.
- Current State: Displays the real-time SLO status based on actual calculations.
- Remaining Budget: Displays the percentage of the allowable error or latency threshold remaining, along with a visual consumption bar. Your error budget is the allowable number of errors or latency threshold violations. The remaining budget shows the percentage left from this budget, with a visual bar indicator reflecting the budget consumption.
Error budget consumption bar
A color bar visualizes of the error budget consumption and provides an at-a-glance overview of the current state of your error budget, helping you quickly assess the health of your SLOs.
By combining these metrics and visual indicators, the SLOs tab offers a comprehensive view of your service-level objectives, empowering you to monitor and manage them effectively.
- Green: 75%-100% of the allowed budget remaining.
- Yellow: 25%-75% of the allowed budget remaining.
- Orange: 0%-25% of the allowed budget remaining.
SLO drilldown
-
Select the SLO to get real-time tracking of SLO events (spans) that affects your remaining SLO budget.
-
Select the event to view an example of the traces where the threshold violation occurred.
- Only team admins can add new SLOs.
- New SLOs take at least seven days for their computation window to complete.
- Until completed, the SLO will display incomplete data.
SLO calculation example
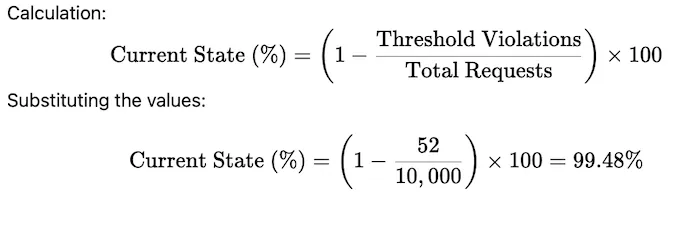
- SLO target: 99%. The target is set to ensure that 99% of requests meet the defined success criteria over a 7-day period.
- Current state: 99.48%. Based on the data for the last 7 days:
- Total Requests: 10,000
- Threshold Violations: 52
-
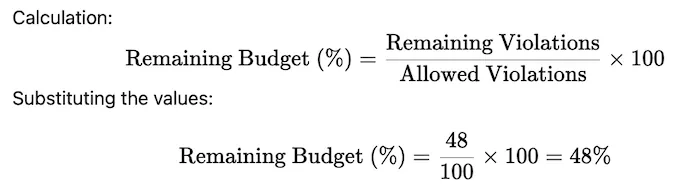
Remaining budget: 48%
The error budget defines the allowable number of threshold violations within the 7-day period.
- Allowed Violations: 100 (1% of 10,000 requests)
- Remaining Violations: 48 (100 - 52 violations)
Additional resources
| Coralogix Academy | SLO/SLI Management in Coralogix APM |
| API | SLO Management API |
| Terraform | Terraform registry |
Next steps
When an SLO breaches, jump to Analyze to see which dependencies and traces are driving the regression.