Monitor transactions
Purpose-built for microservices-based environments, the Coralogix Transactions feature lets you investigate the radius of impact of different services over time and troubleshoot issues immediately as part of Application Performance Monitoring.
Note
Transactions is available for Span Metrics users only.
Use transactions to:
- Investigate the performance of each transaction by breaking it down into its constituent operations.
- Understand how each segment, a collection of related operations, affects the performance of the entire transaction over time.
- Identify and troubleshoot the segments causing performance issues over time.
What you need
- An OpenTelemetry collector running version
0.130.0or later, with the Coralogix processor configured. - For Kubernetes deployments, the Coralogix Kubernetes Complete Observability integration on Helm chart
v0.0.203or later.
Key concepts
A user visits an e-commerce website and clicks on a product to view its details. This action initiates a transaction. The transaction begins when the user's request reaches a service and ends when the service sends back the product details as a response. During this transaction, several operations occur: the service might query a database to retrieve the product information, call external services for current pricing, and execute internal logic to prepare the content for display. Each of these operations represents a segment. The transaction breakdown shows how these segments collectively contribute to the request's overall response time and performance. A transaction denotes a singular logical unit of work in a software application. More precisely, it encompasses the function and method calls constituting that unit of work. Each transaction consists of a root span, an operation that serves as its entry point and triggers all other related operations. Every transaction may contain hundreds, if not thousands, of spans, grouped per operation name. An operation is a logical entity consolidating all spans with the same action type. A segment is a collection of related operations, the constituent functions that break down the various service operations into a transaction and collectively structure its performance. Examples include external service calls and database calls. Each segment provides insights into its performance and how it affects the transaction over time. Coralogix's APM captures and monitors the performance metrics associated with each segment that makes up the transaction. This information helps identify bottlenecks, optimize code, and ensure a smooth and efficient user experience during the entire purchase process. A root transaction is the entry-point service operation that initiates subsequent actions within the service — such as database queries, internal operations, external API calls, or downstream service requests. It is the main request or operation that triggers a chain of dependent actions.Transaction
Operation
Segment
Root transaction
Transactions vs. spans
Transactions and the Explore spans feature serve different analysis contexts and depths. Transactions examine the entire sequence of events over time within a service. This method explains how different parts of the transaction interact and evolve, providing deep insights into the internal dynamics of service requests.
While Explore spans captures snapshots of individual operations at specific moments, it does not effectively identify long-term bottlenecks within the overall flow. Transactions deliver a detailed analysis that helps pinpoint the underlying causes of performance issues across the entire flow of the service.
In essence, the transactions feature complements span analysis by examining the collective impact of operations within a service, offering a more comprehensive view of their influence on the transaction's performance over time.
Why enable the transactions processor
By default, OpenTelemetry lets you aggregate the performance of a single operation (span/endpoint) over time. It does not natively aggregate the performance of multiple connected operations over time as a single logical unit. Coralogix APM Transactions fill that gap.
How it works
The processor automatically identifies the transaction root span within each transaction and applies transaction attributes to all spans in that transaction:
- Transaction root identification: the processor finds the span with no parent span ID (or whose parent is not in the current trace) and marks it as the transaction root.
- Transaction attributes: all spans from the same service that are part of traces containing a transaction root receive the following attributes:
cgx.transaction: set to the name of the transaction root span.cgx.transaction.root: set totruefor the root span only.
You can continue using pure OpenTelemetry while adding Transactions through a lightweight, open processor contributed by Coralogix to the OpenTelemetry community. See the v0.130.0 enhancements in the OpenTelemetry Collector Contrib changelog.
This approach ensures:
- No vendor-locked SDKs and no agents.
- No modifications to the OpenTelemetry SDK.
Enable transactions processor
To use the Coralogix transactions processor, ensure your environment meets the following requirements:
- OpenTelemetry version
0.130.0or later. - For Kubernetes users, Helm chart version
v0.0.203or later.
The Coralogix Kubernetes Complete Observability integration ships the transactions processor as a preset in the values.yaml.
To enable the Coralogix transactions processor in your own collector configuration:
Add
coralogixandgroupbytrace/transactionsprocessors in theprocessorssection:processors: groupbytrace/transactions: wait_duration: 5s num_traces: 1000 coralogix: transactions: enabled: trueNote
The
groupbytrace/transactionsprocessor must be added before thecoralogixprocessor. This ensures that all spans belonging to the same trace are grouped and processed together.Add
coralogixandgroupbytrace/transactionsprocessors to yourtracespipeline:
Once configured, the transactions processor starts generating segment-level visibility for your transactions, unlocking the full Transactions experience.
Monitor transactions
The Transactions screen lets you identify service flows that may be good candidates for fine-tuning performance problems or resolving errors. It presents a high-level overview of the selected app's transactions.

Displays a high-level overview of a service's transactions, presented as operations.
To view information about your app's transactions, navigate to APM, select a service and switch to the Transactions tab.
Select a transaction mode and filter to scope what you are viewing:
- Web flows: requests this service receives from external sources or messaging systems.
- Pub-Sub: requests this service sends to other services or messaging systems.
- Internal: background processes or function calls within a service.
Once you have defined your view, Coralogix displays the response time, throughput, and error rate for the matching transactions. On each latency chart, use the aggregation dropdown to switch between avg, P50, P75, P90, P95, P99, P99.99, and P99.99999. P99 is the default, and you can set the aggregation independently per series.
A grid lists every transaction matching your filter. Each row shows average response time, the selected latency aggregation, average throughput (RPM), and error rate (per minute).
Select a transaction to open the Transaction Breakdown screen.
Investigate a transaction
The Transaction Breakdown screen summarizes the selected transaction over the chosen time range and lists every segment that runs as part of it.
Transaction performance
Three charts at the top of the screen summarize the transaction:
- Throughput: request volume. Use the chart dropdown to switch between Requests/s (default) and Requests (absolute count).
- Number of Errors: error volume. Use the chart dropdown to switch between Errors/s (default) and Errors (absolute count).
- Total Response Time: response time by series. Switch the aggregation (avg, P50, P75, P90, P95, P99, P99.99, P99.99999) and the number of series shown (Top N) using the dropdowns in the chart header.
Segments
The Segments table lists every segment that runs as part of the transaction. Each row shows:
- Name: segment name; a Root Transaction tag marks root segments.
- Method: HTTP method, where applicable.
- Calls: total calls in the selected time range.
- Avg calls/flow: average calls per transaction flow.
- Error rate: percentage of failed calls.
- Time spent: total time spent in the segment.
- P95: 95th-percentile response time.
- Avg time: average response time.
- Flow time %: share of the transaction's total time spent in this segment.
Use the Search segment field to narrow the list, or sort by any column to surface slow or error-prone segments.
Select a segment to open the Spans panel.
Investigate a segment
The Spans panel summarizes every span that makes up the selected segment. The header shows the total Requests, the P95 response time, and the Errors count for the segment in the selected time range.
Span performance
- Requests and Errors: request volume and error count over time.
- Response Time: response time by percentile (P99, P95, Avg, P75, P50).
Span list
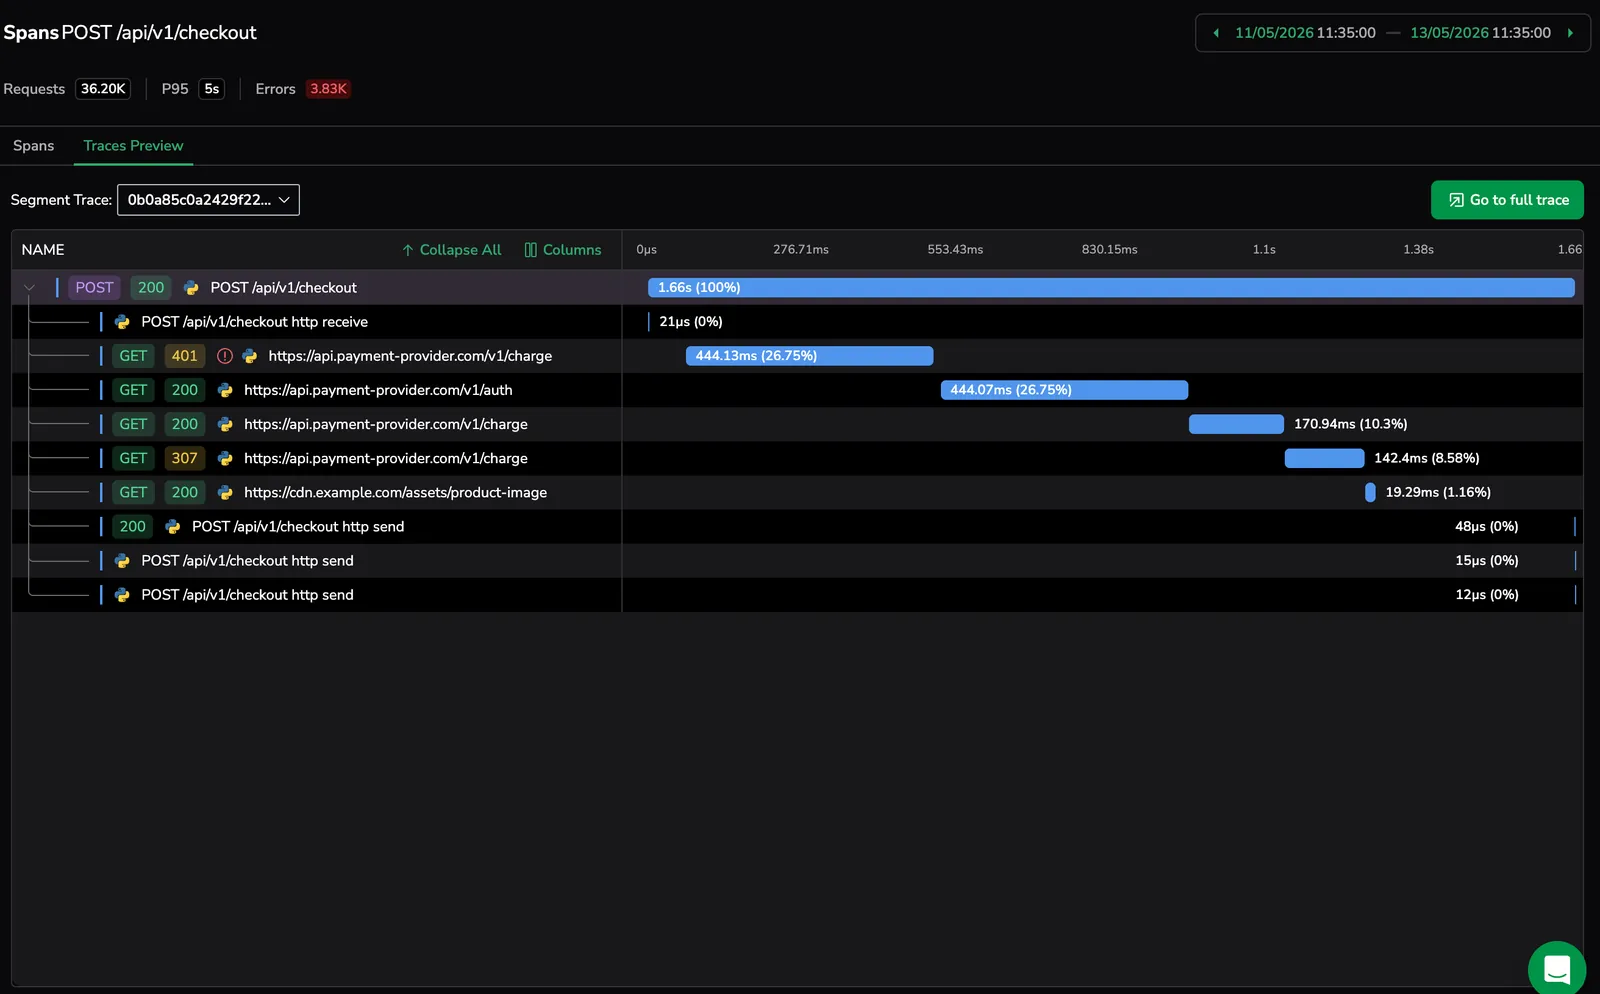
Switch between two tabs:
Spans: every span in the segment, with its timestamp, the transaction it belongs to, duration, and any error message.
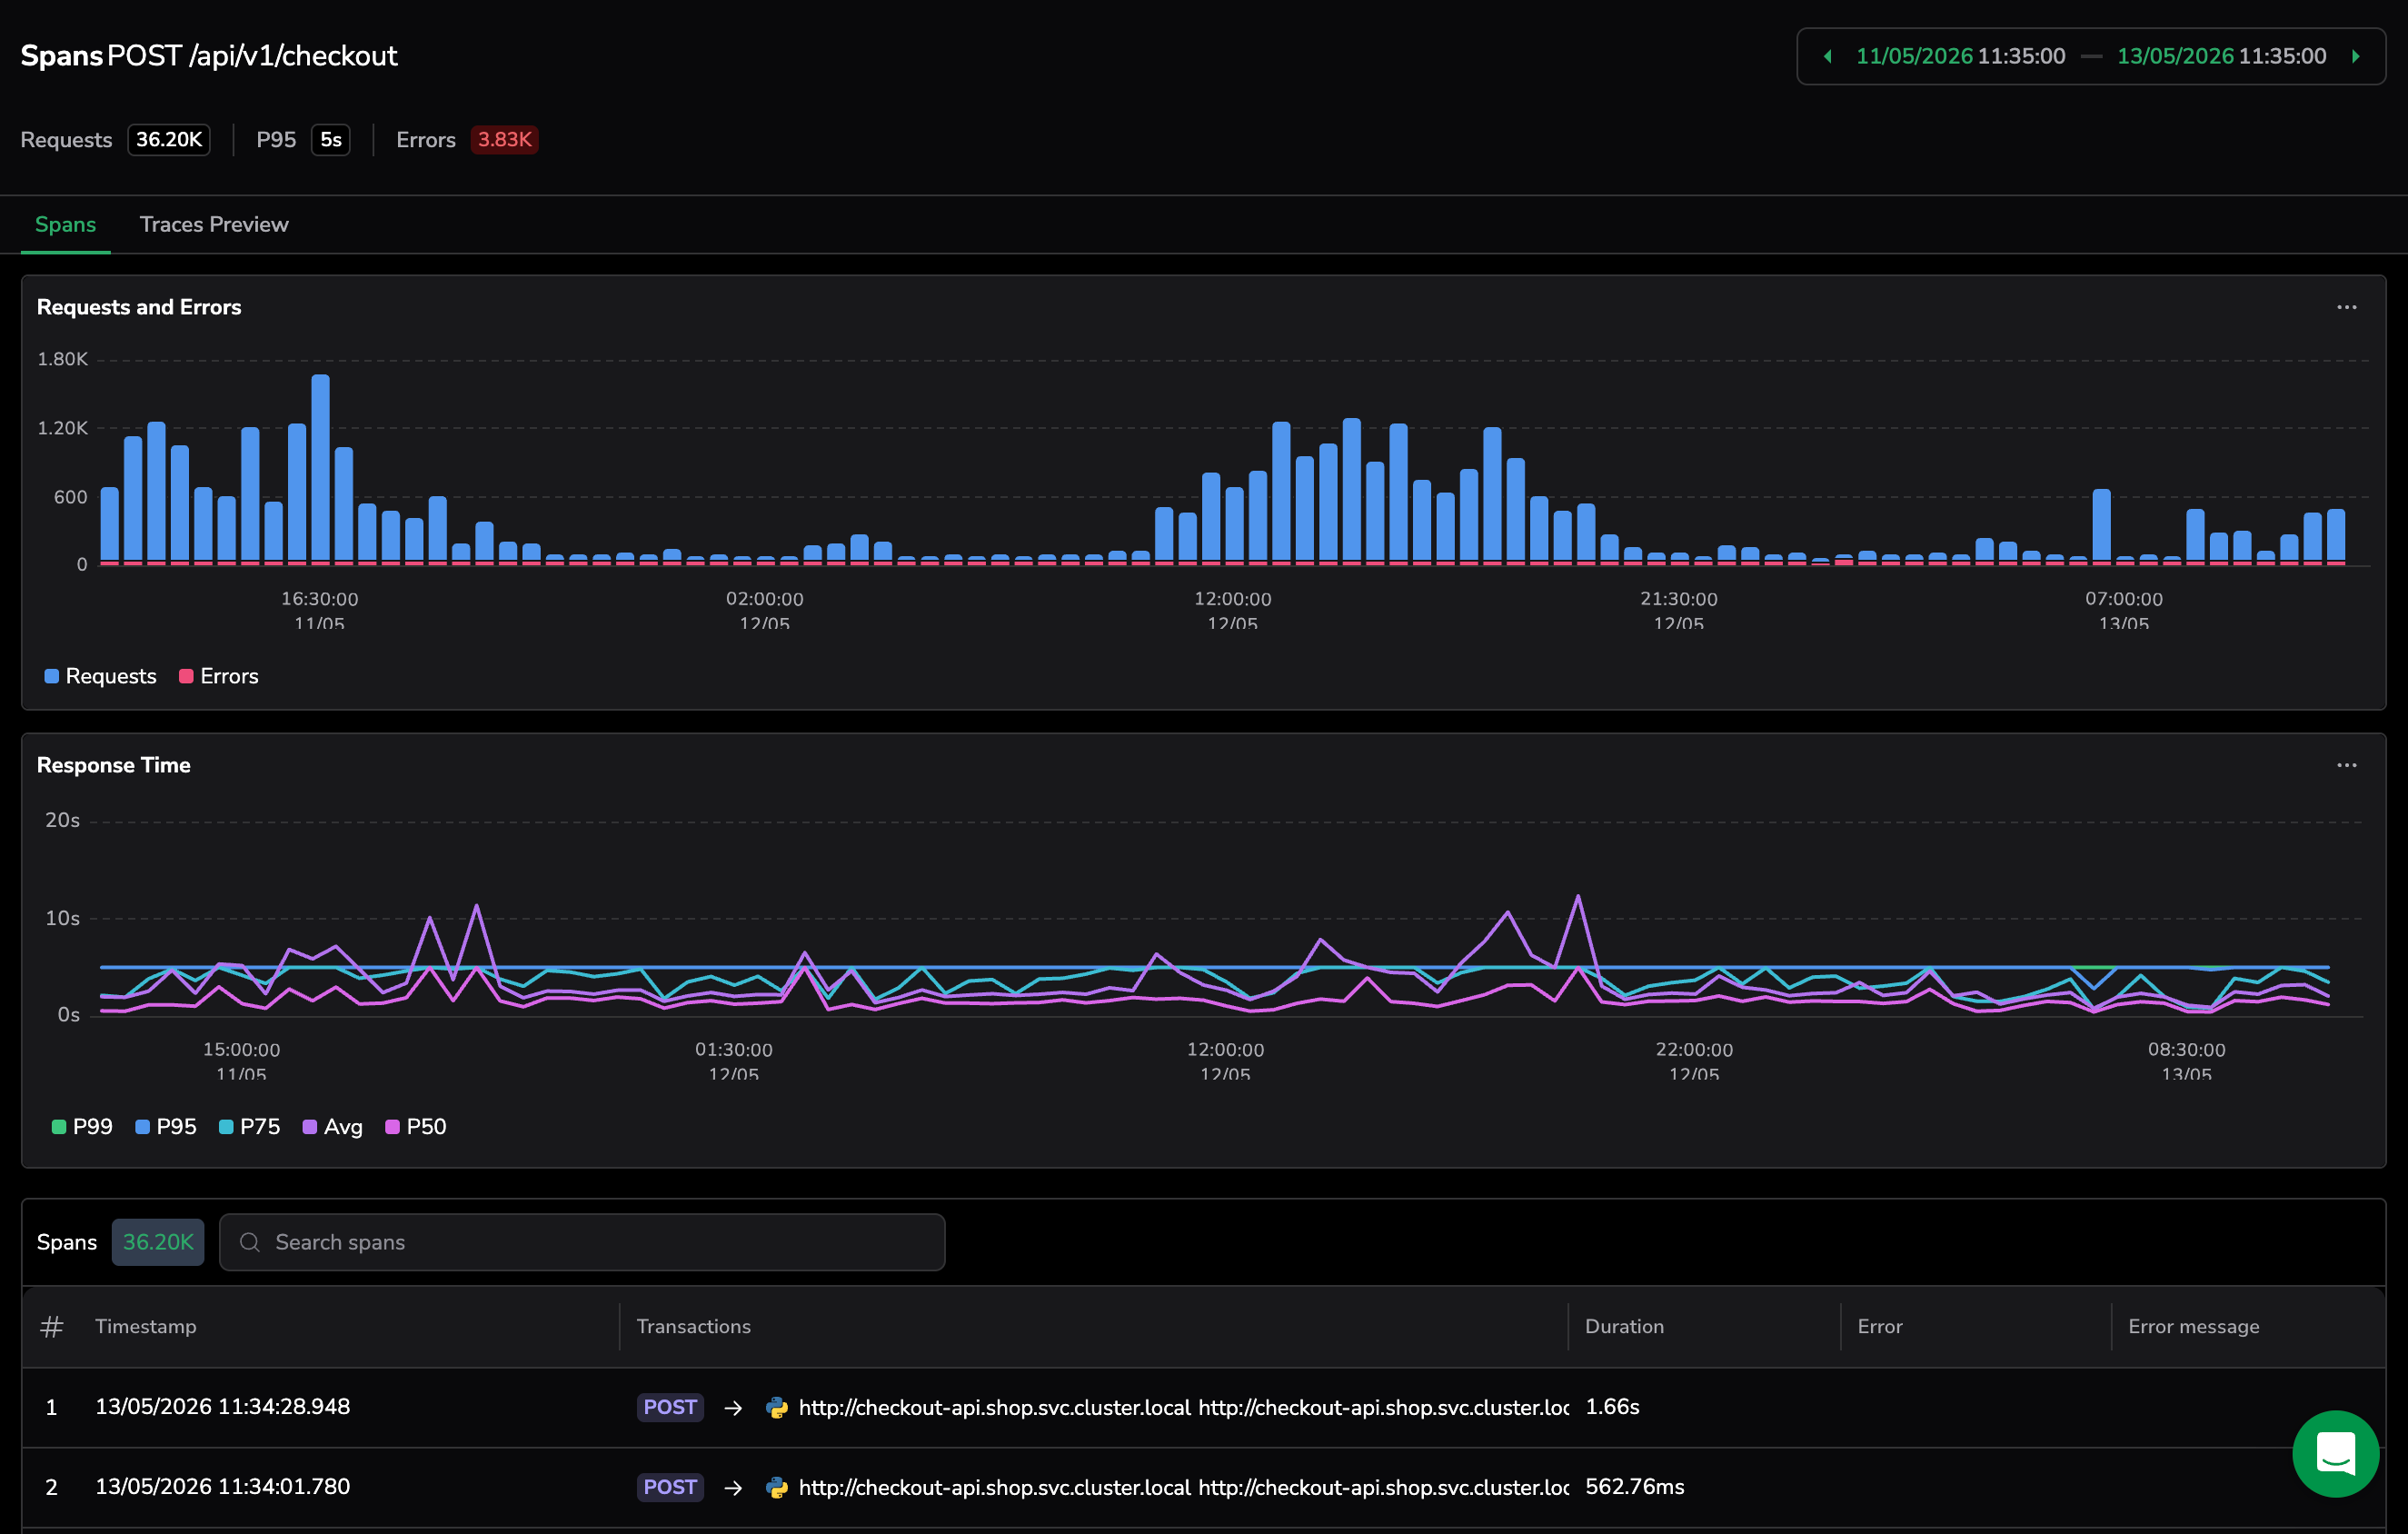
Traces Preview: a waterfall view of one trace from the segment. Use the Segment Trace dropdown to switch between traces, Collapse All and Columns to adjust the view, or Go to full trace to open the full Span drilldown.


Use Search spans to filter the list. Select a span to open the trace it participates in.
Investigate a span
Selecting a span opens the Span drilldown. From there, switch between Dependencies, Flame, and Gantt views, inspect span metadata and latency distribution, and pivot to correlated logs, infrastructure context, profiles, or AI insights.
See Investigate with the span drilldown for the full reference.
This workflow gives you investigative clarity end to end: identify the segment with the greatest impact on the transaction, see where it sits within the transaction flow, and switch between trace examples based on the KPIs that matter to your analysis.
Next steps
See how each transaction interacts with downstream systems by enabling Dependencies.