Quick Start
Configure Span Metrics using the method that applies to your environment and verify the installation.
Using Coralogix Complete Observability integrations
When working with Coralogix UI, the fastest way to enable APM with Span Metrics is using Coralogix Complete Observability integrations. They provides a comprehensive solution for full-stack observability in your Kubernetes or ECS-EC2 environment.
- Kubernetes: Monitor nodes, pods, cluster metrics, logs, Kubernetes events, and distributed traces-all in one place. This integration provides a guided OTEL agent installation capability that helps you generate a tailored
values.yamlfile for deploying the OpenTelemetry agent based on your environment and use case. For the installation instructions, refer to this document. Span Metrics is enabled by default withspanMetrics: enabled: trueand can be disabled by setting the value tofalsein the values.yaml file. - ECS-EC2: Deploy comprehensive OpenTelemetry monitoring for your AWS ECS-EC2 infrastructure. Monitor container metrics, application traces, logs, and infrastructure health across your ECS cluster. This integration provides guided deployment through CloudFormation or Terraform, enabling complete observability for your containerized workloads running on EC2 instances. For the installation instructions, refer to this document.
Using your own collector
If you are not using one of the Coralogix integrations (Kubernetes or ECS on EC2) and instead run your own OpenTelemetry collector, you can generate a working example configuration directly from the Coralogix UI and adapt it to your setup.
Follow the steps below to generate a baseline configuration using the Kubernetes integration UI:
- If the Kubernetes integration is not yet configured, follow the instructions here. If the integration is configured, skip this step and proceed to the next one.
- From the Kubernetes Complete Observability page, Select Actions, then Update.
Navigate to Review values.yaml and Deploy and select Download content. Download the Kubernetes manifest.
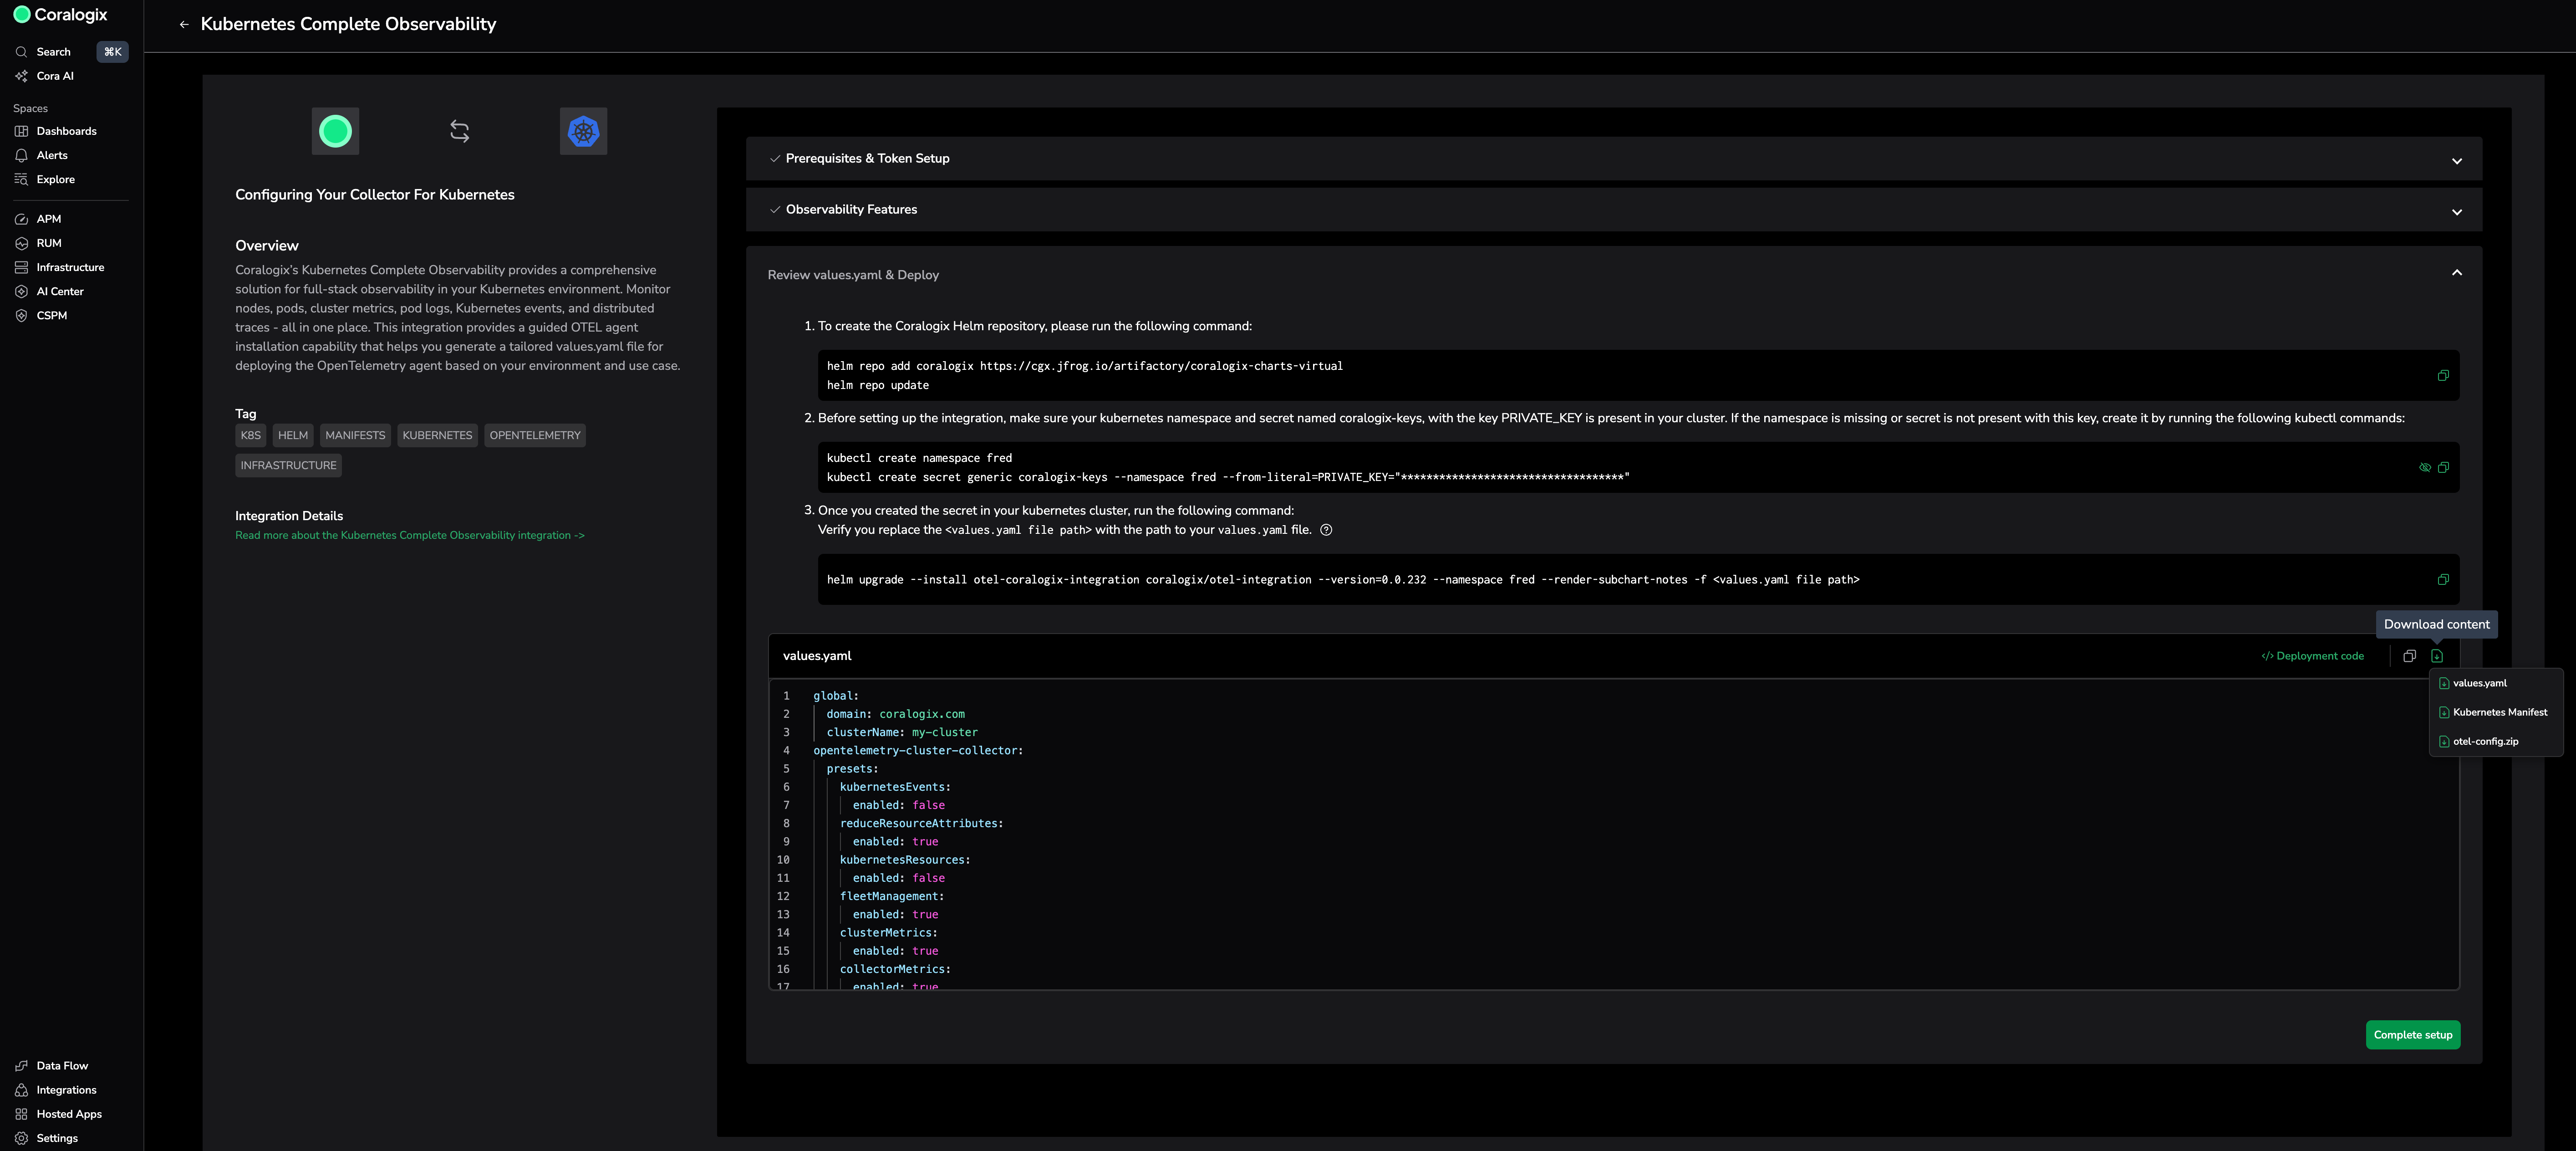
Use the downloaded manifest as a reference configuration. It includes a fully configured setup and reflects the latest supported settings. You can adapt this configuration for your own OpenTelemetry collector if needed.
Note
Whenever possible, use the Coralogix integrations for Kubernetes or ECS on EC2. They provide ongoing updates, feature compatibility, and streamlined support, while still allowing you to inspect and reuse the underlying configuration when customization is required.
After you deploy the configuration, verify that services appear in the Service Catalog and that RED metrics populate.
Metrics available with Span Metrics
The following metrics are produced by the OpenTelemetry Span Metrics connector and must be available for the Service Catalog, Databases Catalog, and optional features such as transactions, API error tracking, and version grouping.
Do not remove these metrics or their labels.
Minimal set of metrics and labels (Service catalog and db catalog drilldown pages)
| Metric | Label |
|---|---|
duration_ms_sum | span_name, service_name, span_kind, status_code, http_method, host_name, k8s_cluster_name, cgx.transaction, cgx.transaction.root, db_namespace, db_operation_name, db_collection_name, db_system, application_name, cx_subsystem_name |
duration_ms_bucket | span_name, service_name, span_kind, status_code, http_method, host_name, k8s_cluster_name, cgx.transaction, cgx.transaction.root, db_namespace, db_operation_name, db_collection_name, db_system, application_name, cx_subsystem_name, le |
calls_total | span_name, service_name, span_kind, status_code, http_method, host_name, k8s_cluster_name, cgx.transaction, cgx.transaction.root, db_namespace, db_operation_name, db_collection_name, db_system, application_name, cx_subsystem_name |
duration_ms_count | span_name, service_name, span_kind, status_code, http_method, host_name, k8s_cluster_name, cgx.transaction, cgx.transaction.root, db_namespace, db_operation_name, db_collection_name, db_system, application_name, cx_subsystem_name |
Additional labels to add for each metric:
rpc.grpc.status_code,http.response.status_codeto track API errors feature.service.versionfor grouping service metrics by version feature.k8s.deployment.namefor service to k8s correlations. This label correlates services with the resources catalog.k8s.pod.nameto avoid metric collisions in environments where each node runs its own collector. Without a stable per-pod attribute, metrics from the same service on different nodes might overwrite each other.
Next steps
Proceed to the Recommended Configurations document to configure Span Metrics for production environments and optimize its performance.