Cases analytics
Cases analytics turns the raw stream of Cases into a quantitative view of how teams respond to operational issues. Where the Case list answers "what is happening now?", the Analytics tab answers "how is the team performing over time, and where is the work concentrated?"
Use it to track response and recovery trends, compare results across teams or services, justify reliability investments with hard numbers, and drill back into the underlying Cases the moment a number needs investigation.
To open analytics, select Alerts, then Cases, then the Analytics tab.
Cases analytics is in early access. The feature is rolling out to opted-in workspaces and the UI may change before general availability. Contact Coralogix Support to enable it for your workspace.
When to use Cases analytics
Cases analytics fits the moments when you stop firefighting and start measuring. Typical scenarios:
- Weekly or monthly reliability review. Compare this week's Mean Time to Resolve against last week's, see which teams or services drove the change, and bring concrete numbers to the review.
- Quarterly business review or Service Level Objective (SLO) conversation. Report Mean Time to Acknowledge, Mean Time to Resolve, and Mean Time Between Incidents per service and trend them across the quarter. Use saved views to keep the same scope each cycle.
- On-call load assessment. Group by Team to see who is absorbing the most Cases. A team with a high case count but a low Mean Time to Acknowledge is shouldering real load; a team with a high case count and a flat acknowledgement rate might be drowning.
- Noisy service hunt. Group by Service and sort by Cases opened to find the services that generate the most operational work. Pair the result with a high Mean Time Between Incidents to confirm whether the noise is chronic or recently spiking.
- Postmortem and incident-pattern review. Filter by Priority = P1/P2 and a longer time range to see how the most severe Cases trended, then jump into the Case list with View in cases to inspect individual incidents.
- Routing and ownership audit. Group by Team with a None value visible. Cases that fall into None have no team assigned; a persistent None row points to a routing gap, not a metric.
Time range and filters
Use the controls at the top of the page to scope every metric on the page at once.
- Time range picker. Select a quick range, relative range, or custom range. The default is Last 7 days. The percentage indicator on each mean time card compares the current range to the previous range of the same length, so switching to Last 30 days also changes the comparison baseline to the 30 days before that.
- Filtered by. Narrow results by Alert, Connector Type, Environment, Priority, Service, or Team. Filters apply to the mean time cards and the Overview table at the same time, so a metric and its breakdown always describe the same population of Cases.
Combining a tight filter with a long time range usually works best for analytics. For example, Environment = production, Priority = P1, Last 90 days gives you a clean picture of production-critical reliability without weekend test alerts skewing the numbers.
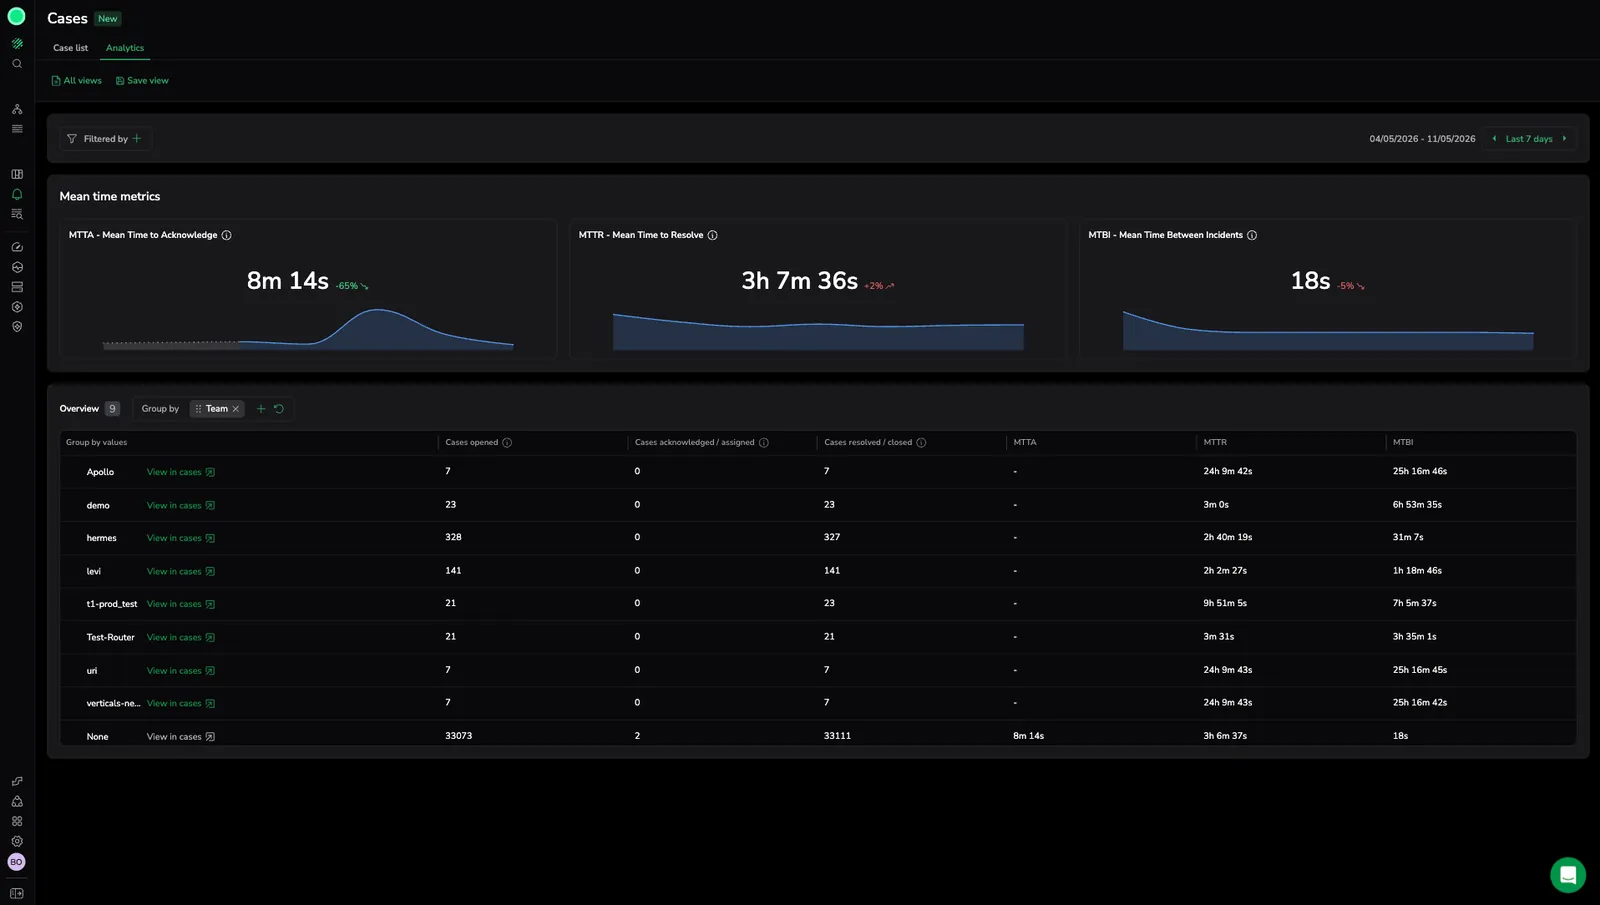
Mean time metrics
Three cards summarize Case lifecycle performance for the selected range. Each card shows the current value, the percentage change against the previous comparable range, and a trend line of the underlying values. A red arrow means the metric moved in the worse direction for that metric: longer Mean Time to Acknowledge or Resolve, or shorter Mean Time Between Incidents. A green arrow means it improved.
| Metric | What it measures | How to read it |
|---|---|---|
| Mean Time to Acknowledge (MTTA) | Average time between case creation and first acknowledgement or assignment. | A proxy for detection-to-response speed. Rising MTTA usually points to alert fatigue, broken notification routing, or an understaffed on-call rotation. |
| Mean Time to Resolve (MTTR) | Average time between case creation and resolution. | A proxy for end-to-end recovery speed. MTTR captures both response time and the time to fix, so investigate it alongside MTTA: if MTTA is flat but MTTR is climbing, the slowdown is in mitigation, not detection. |
| Mean Time Between Incidents (MTBI) | Average time between consecutive case creations. | A stability indicator. Higher is better: a long MTBI for production services means fewer incidents per unit of time. A sudden drop in MTBI is often the earliest sign of a regression. |
Interpreting the numbers
- A single value is rarely actionable. Always compare to the previous range (the percentage indicator) or to a different group in the Overview table.
- Watch the trend line, not only the headline. A flat percentage can hide a sharp spike followed by recovery. The mini trend line shows the shape.
- Mean is sensitive to outliers. One Case that took 14 days to resolve inflates MTTR for a small range. When a number looks wrong, open the underlying Cases through View in cases in the Overview table and sort by resolution time.
- An empty
-is not zero. It means no eligible Case contributed to the calculation. The MTTA column stays empty until someone acknowledges a Case in that group; the MTTR column stays empty until someone resolves a Case in that group.
Overview breakdown
The Overview table breaks the same metrics down by a dimension you select, so a single page-level number turns into a comparison across teams, services, or priorities.
- Use the Group by selector to group results by a Case attribute such as Team, Service, Priority, or Environment.
- Each row shows the group value plus Cases opened, Cases acknowledged / assigned, Cases resolved / closed, MTTA, MTTR, and MTBI for that group.
- Select View in cases on any row to open the Cases list pre-filtered to that group, so you can investigate the Cases behind the numbers without rebuilding the filter by hand.
Choosing what to group by
Different grouping dimensions answer different questions. Pick the dimension that matches the conversation you are having.
| Group by | Use it when you need to answer |
|---|---|
| Team | Who owns the load? Which teams are improving or regressing? Are any teams seeing zero acknowledgements (a routing or ownership gap)? |
| Service | Which services generate the most operational work, and which take the longest to recover? Useful when planning reliability investments. |
| Priority | Are P1 and P2 Cases trending in the desired direction? Is low-priority noise drowning out high-priority signal? |
| Environment | How does production reliability compare to staging? Are staging or development alerts polluting your numbers? |
| Alert | Which alert definitions create the most Cases? Often the input to alert-tuning work. |
| Connector Type | Are Cases originating from a specific integration (for example, ServiceNow) behaving differently from the rest? |
Save an analytics view
The Analytics tab uses the same saved views mechanism as the Case list, so weekly or quarterly reviews become repeatable. A saved analytics view captures the filters, Group by dimension, and time range that define the current report. For the full saved views workflow, including how to edit, clone, delete, and share views, see Cases saved views.
To save the current analytics report as a view:
Give the view a name that describes the conversation it supports, such as Weekly prod reliability or P1 trend by team. Turn on Lock time when the view always shows a specific window, such as an incident or a calendar month. Leave it off for rolling reports that follow today's date.
Sharing analytics views across a team
Saved views give reliability conversations a shared vocabulary. A few patterns that work well:
- Set a default view per team so every member of an on-call rotation lands on the same starting picture when they open Analytics.
- Maintain a named view per recurring meeting (
Weekly reliability review,Quarterly SLO review) with the time range and grouping that meeting always uses. - Use Lock time for postmortem-style views that need to keep showing the incident window, even when reopened weeks later.