Prometheus Alert Manager triage
When a Case is opened by a Prometheus Alert Manager alert, the Case Triage tab shows a dedicated Prometheus Alert Manager view. Use it to see the alerts in the group, inspect their labels, annotations, and PromQL, and confirm what fired without leaving the Case.
Creating and linking Cases from Prometheus Alert Manager is in public beta.
What you need
- Access to Cases.
- A Case opened by a Prometheus Alert Manager alert. Cases from other sources show their own triage view instead.
Connect Prometheus Alert Manager to Cases
Send your Prometheus Alert Manager alerts to Coralogix to open and update Cases automatically. Alert Manager posts each alert group to a Coralogix webhook, and Coralogix opens a Case for the group, keeps it updated as alerts fire, and resolves it when the group clears.
Before you start
- An API key with the
case:Createpermission. See API keys to create one. - Your Coralogix domain. See Coralogix domain.
Configure the webhook receiver
Add a webhook receiver to your alertmanager.yml that points at the Coralogix Cases webhook and authenticates with your API key:
global:
  resolve_timeout: 5m

route:
  group_by: ['alertname', 'job']
  group_wait: 30s
  group_interval: 5m
  repeat_interval: 1h
  receiver: 'coralogix-cases'

receivers:
  - name: 'coralogix-cases'
    webhook_configs:
      - url: 'https://api.<coralogix-domain>/mgmt/v1/cases/webhooks/prometheus_alert_manager'
        http_config:
          authorization:
            type: Bearer
            credentials: '<your-team-api-key>'
        timeout: 10s
Point the url at the Coralogix API domain for your region, not the web UI. It takes the form https://api.<coralogix-domain>/mgmt/v1/cases/webhooks/prometheus_alert_manager, for example https://api.us3.coralogix.net/mgmt/v1/cases/webhooks/prometheus_alert_manager. See Coralogix domain to find your domain, and replace <your-team-api-key> with an API key that has the case:Create permission.
Keep these webhook settings at their defaults:
send_resolved: leave astrue. Coralogix needs the resolved notification to close the Case.max_alerts: leave as0. A nonzero value truncates alerts and can leave the Case in an inconsistent state.
Set timeout to a value such as 10s so that a stalled connection retries in reasonable time. The default of 0s never times out.
How alerts map to Cases
Coralogix builds each Case from the alert group's labels and annotations. Set these in your Prometheus rules:
| Alert Manager field | Type | Maps to | Notes |
|---|---|---|---|
severity | Label | Case priority | critical to P1, error to P2, warning to P3, info to P5. An unknown or missing value falls back to P5. |
alertname | Group label | Case title | Set this label. It becomes the first part of the title. |
summary | Annotation | Case title text | Optional. A human-readable summary. |
description | Annotation | Case description | Optional. |
status | Payload | Case state | firing opens or keeps the Case active, resolved resolves it. Always sent. |
Alert Manager creates a Case per group_by group. Define a grouping label so that related alerts share a Case instead of opening a separate Case each.
Open the triage view
Open the Case and select the Triage tab. For a Prometheus Alert Manager Case, the view lists the alert group and the alerts it contains, each with a status of Triggered or Resolved.
Inspect an alert
Select an alert in Choose Alert to inspect it:
- Labels: the alert's label set. Labels common to the whole group are shown separately from labels specific to the selected alert.
- Annotations: the alert's annotations.
- PromQL query: the query behind the alert. Select Open in Metric Explorer to open it in Metric Explorer, where you can adjust it and explore related metrics.
- Query chart: the alert's metric plotted over the selected range.
When a section has nothing to show, for example an alert with no annotations or no PromQL, the view says so in place rather than leaving the panel blank.
Review the alert group
The group details show the context shared across the alert group, including the group labels, common labels and annotations, the latest receiver, the group key, and the timeframe. Use this to understand what the alerts have in common before drilling into a specific one.
Adjust the timeframe
The view uses the Case timeframe by default. Change the window with the time picker to widen or narrow what the chart plots, and select Reset to case timeframe to return to the Case's own range.
Open a Case from an Alert Manager notification
Every Case opened by a Prometheus Alert Manager alert is addressable by that alert's fingerprint plus its start time. Point any notification that Alert Manager sends (Slack, Microsoft Teams, PagerDuty, or email) at the following URL, and responders move from the notification straight to the Case:
https://<team-hostname>/#/cases?fingerprint=<alert-fingerprint>&start_time=<start-time>
<team-hostname>: your Coralogix team domain, for exampleteam.coralogix.com.fingerprint: the Prometheus alert's fingerprint. Alert Manager assigns this stable identity to each alert, and Coralogix uses it to match the alert to its Case.start_time: the alert's start time as a timestamp in the format2026-06-17T09:30:00.000Z.
Include both parameters. Coralogix resolves the Case that matches the fingerprint and start time and opens it directly. If no Case matches yet, Coralogix returns you to the Case list and notes that the Case might not exist yet:
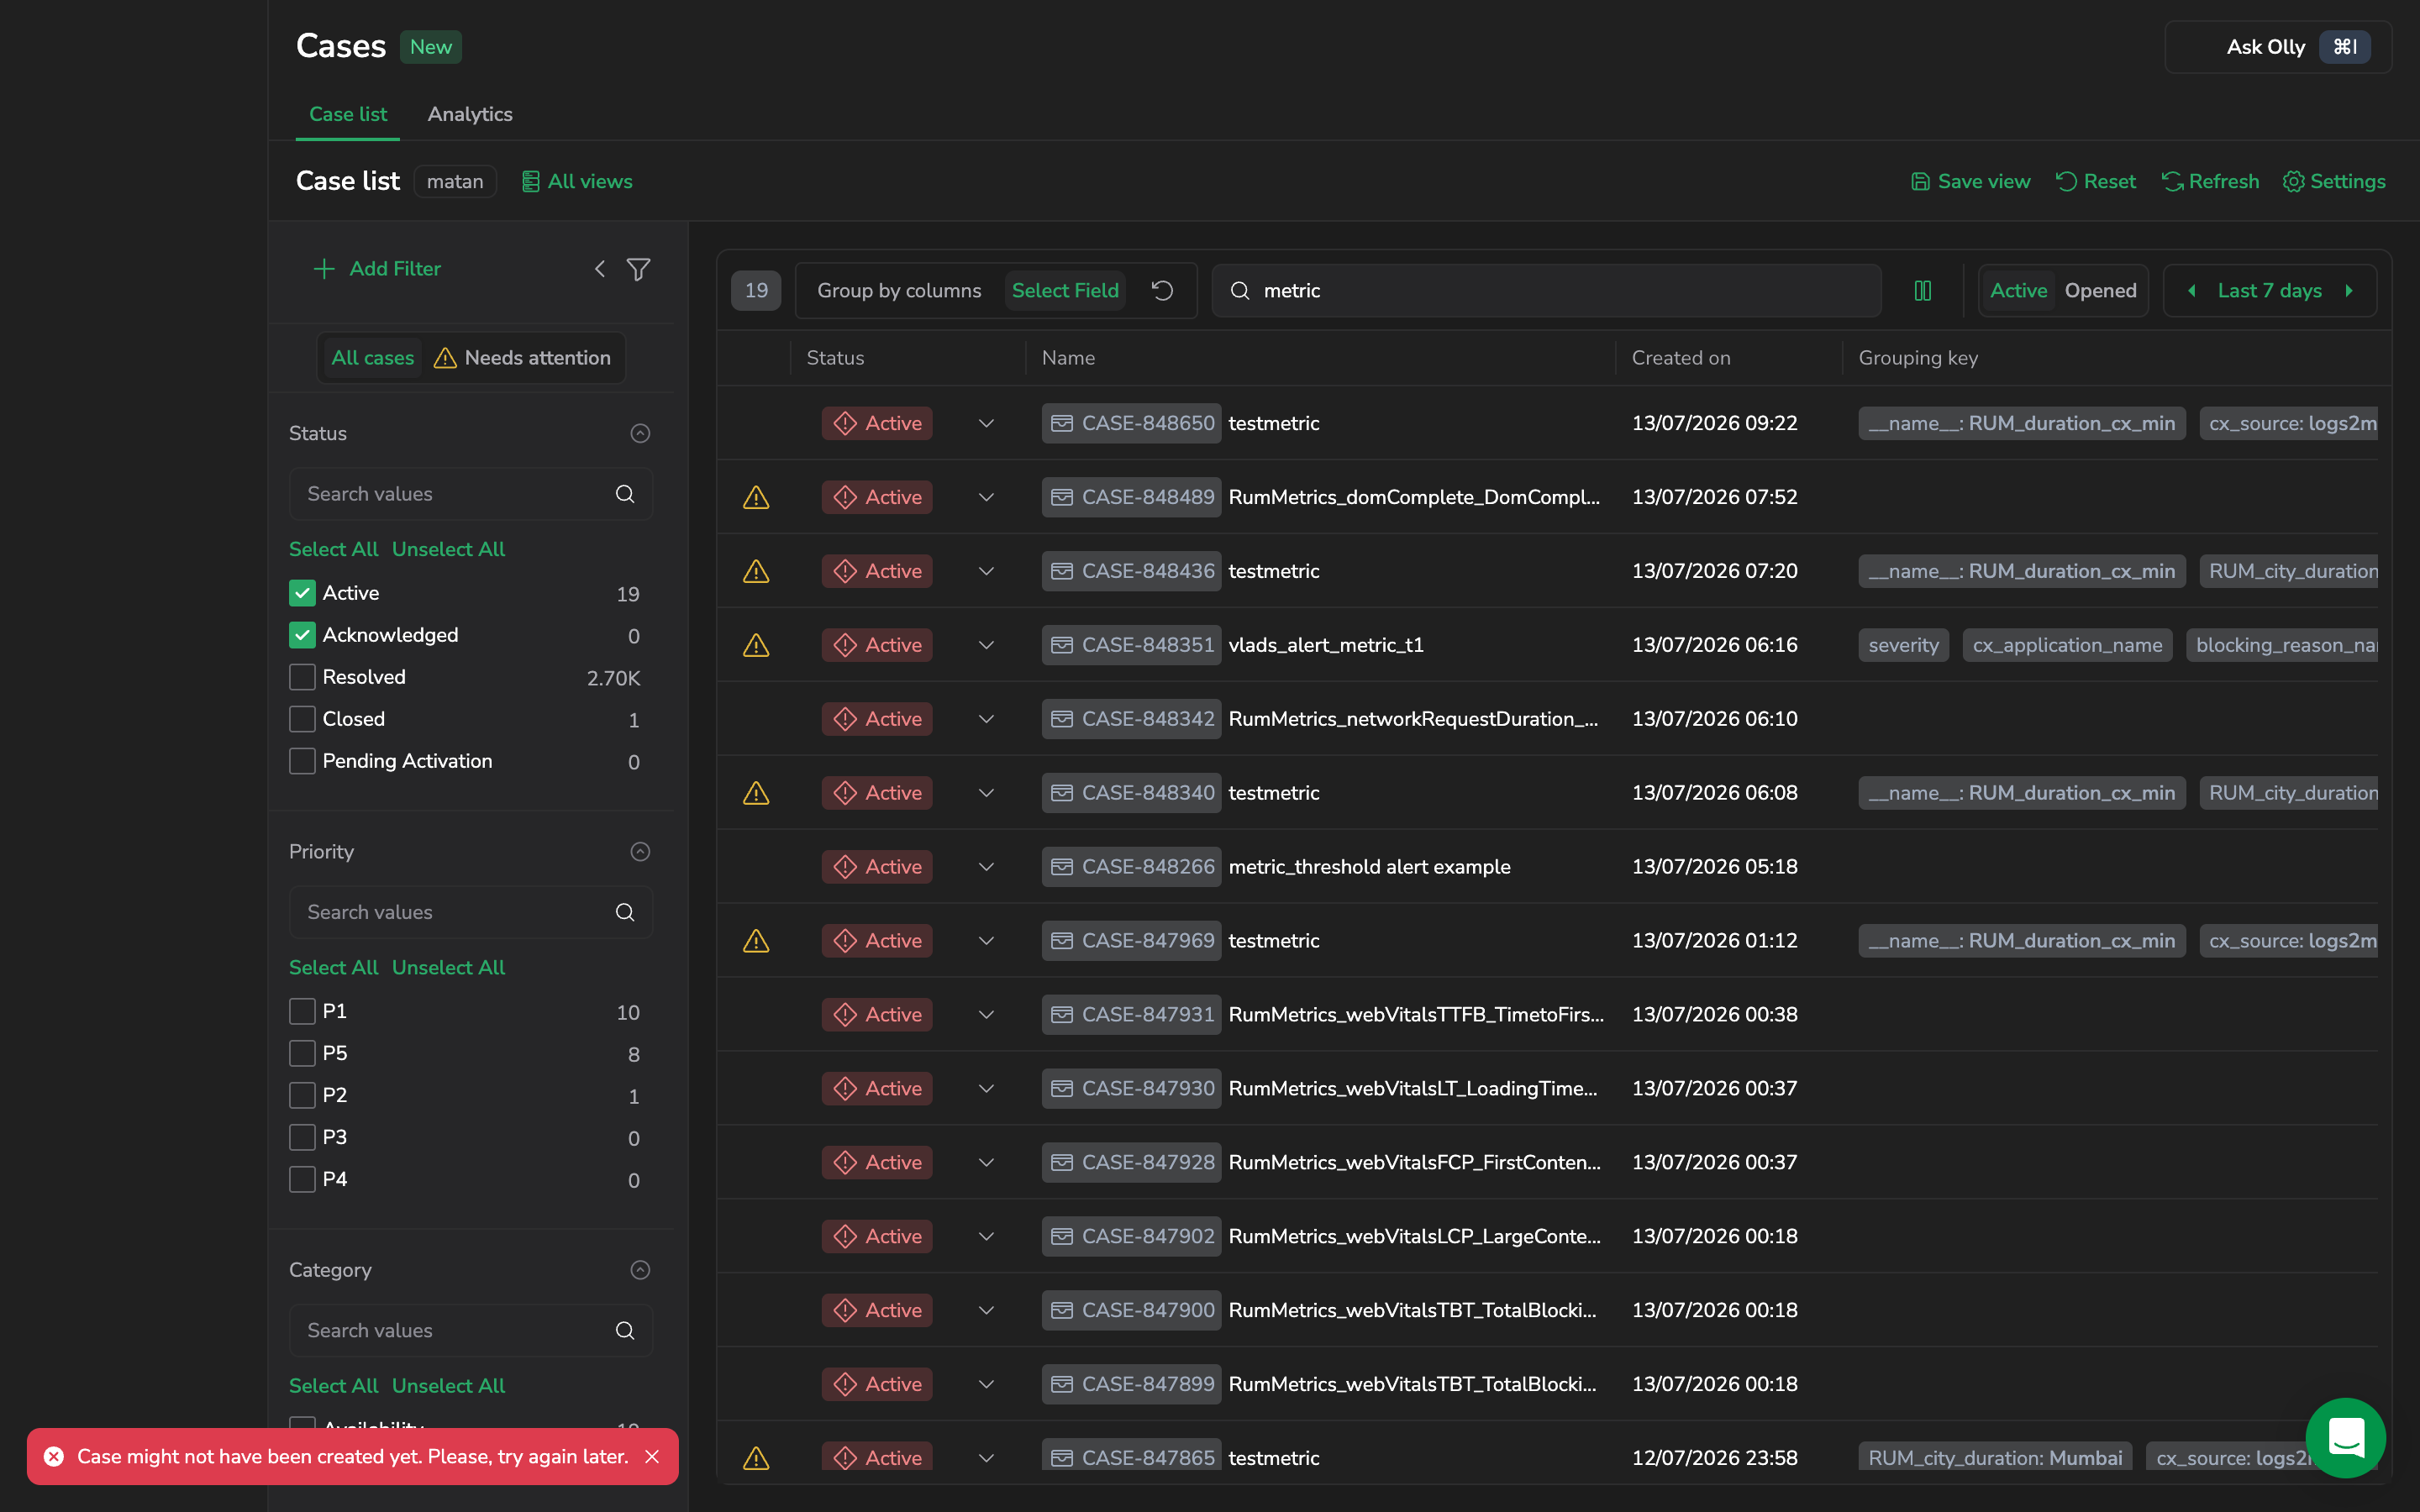
Alert ingestion can lag slightly behind the notification, so retry after a moment if the Case is not found on the first attempt.
To create the Cases in the first place, send your Prometheus alerts to Coralogix as described in Prometheus Alert Manager data ingestion.
Build the link in your Alert Manager templates
Define a reusable template so every receiver builds the same link. Add a templates/coralogix.tmpl file and reference it from your Alert Manager configuration:
{{ define "coralogix.first_fingerprint" -}}
{{- if gt (len .Alerts.Firing) 0 -}}
{{- with index .Alerts.Firing 0 -}}{{ .Fingerprint }}{{- end -}}
{{- else if gt (len .Alerts.Resolved) 0 -}}
{{- with index .Alerts.Resolved 0 -}}{{ .Fingerprint }}{{- end -}}
{{- end -}}
{{- end }}

{{ define "coralogix.first_start_time" -}}
{{- if gt (len .Alerts.Firing) 0 -}}
{{- with index .Alerts.Firing 0 -}}{{ date "2006-01-02T15:04:05.000Z" (tz "UTC" .StartsAt) }}{{- end -}}
{{- else if gt (len .Alerts.Resolved) 0 -}}
{{- with index .Alerts.Resolved 0 -}}{{ date "2006-01-02T15:04:05.000Z" (tz "UTC" .StartsAt) }}{{- end -}}
{{- end -}}
{{- end }}

{{ define "coralogix.cases_url" -}}
https://<team-hostname>/#/cases?fingerprint={{ template "coralogix.first_fingerprint" . }}&start_time={{ template "coralogix.first_start_time" . }}
{{- end }}
Load the template file and set your routing in alertmanager.yml. Replace <team-hostname> with your own Coralogix team domain:
templates:
  - templates/*.tmpl

route:
  receiver: slack-coralogix
  group_by: ['...']
  group_wait: 10s
  group_interval: 5m
  repeat_interval: 4h
Reference the link from a receiver
Prometheus Alert Manager supports many integrations, each with its own configuration fields. The following examples wire the coralogix.cases_url template into common receivers.
- Slack
- Microsoft Teams v2
- PagerDuty
receivers:
  - name: slack-coralogix
    slack_configs:
      - api_url_file: /etc/alertmanager/secrets/slack-webhook-url
        channel: '#alerts'
        send_resolved: true
        title: '{{ .CommonLabels.alertname }}'
        title_link: '{{ template "coralogix.cases_url" . }}'
        text: '{{ .CommonAnnotations.summary }}'
        actions:
          - type: button
            text: Open Coralogix case
            url: '{{ template "coralogix.cases_url" . }}'
receivers:
  - name: teams-coralogix
    msteamsv2_configs:
      - webhook_url_file: /etc/alertmanager/secrets/teams-webhook-url
        send_resolved: true
        title: '{{ .Status | toUpper }}: {{ .CommonLabels.alertname }}'
        text: |
          {{ .CommonAnnotations.summary }}

          [Open Coralogix case]({{ template "coralogix.cases_url" . }})
receivers:
  - name: pagerduty-coralogix
    pagerduty_configs:
      - routing_key_file: /etc/alertmanager/secrets/pagerduty-routing-key
        send_resolved: true
        description: '{{ .CommonLabels.alertname }}'
        client: Alertmanager
        client_url: '{{ template "coralogix.cases_url" . }}'
        details:
          coralogix_case_url: '{{ template "coralogix.cases_url" . }}'
          coralogix_fingerprint: '{{ template "coralogix.first_fingerprint" . }}'
          coralogix_start_time: '{{ template "coralogix.first_start_time" . }}'
        links:
          - href: '{{ template "coralogix.cases_url" . }}'
            text: Open Coralogix case
The first_fingerprint and first_start_time templates use the first alert in the notification group, so the link resolves to the Case for that alert. Adjust the templates if your grouping strategy needs a different alert.