Monitor memory consumption
Identify memory-intensive functions, detect allocation hotspots, and optimize allocation behavior in your Java services. Memory profiling uses the Async Profiler to capture allocation data with minimal overhead, giving you function-level visibility into how your application consumes memory.
Memory profiling complements CPU profiling by revealing a different dimension of performance. While CPU profiles show where processing time is spent, memory profiles show where allocations occur—helping you reduce garbage collection pressure, prevent out-of-memory errors, and lower infrastructure costs.
What you need
- Continuous Profiling set up and installed so the Coralogix collector is reachable from your service. The eBPF profiler used for CPU profiling is not required for memory profiling.
- Java services running on a supported JVM (JDK 7–25); the Coralogix profiler SDK itself requires Java 17+
- Build access to publish the Coralogix profiler SDK as a dependency (Maven or Gradle)
How memory profiling works
Coralogix memory profiling integrates with the Async Profiler, a low-overhead sampling profiler for Java and other JVM languages. Unlike the eBPF-based profiler used for CPU profiling, the Async Profiler hooks directly into the JVM to capture memory allocation events.
The profiler samples memory allocation events at runtime, recording which functions allocate memory, how much they allocate, and the resulting call paths. This data is aggregated and displayed in the Profiles UI alongside CPU profiles.
Set up memory profiling
Memory profiling is enabled by adding the Coralogix Continuous Profiler SDK to your Java service. The SDK bundles the Async Profiler native libraries, extracts them automatically on first use, and exports allocation samples to the Coralogix collector—no manual native library installation is required.
1. Add the SDK dependency
Maven — add to pom.xml:
<dependency>
    <groupId>com.coralogix</groupId>
    <artifactId>continuous-profiler</artifactId>
    <version>0.1.1</version>
</dependency>
Gradle — add to build.gradle:
dependencies {
    implementation 'com.coralogix:continuous-profiler:0.1.1'
}
2. Initialize the profiler
Wrap your application in a ContinuousProfiler builder. The profiler runs in the background and samples allocation events for the configured duration. Use try-with-resources so the profiler stops cleanly on shutdown.
import com.coralogix.profiler.ContinuousProfiler;

public class MyApp {
  public static void main(String[] args) throws Exception {
    try (ContinuousProfiler profiler = ContinuousProfiler.builder()
            .build()) {

      myApplication.run();
    }
  }
}
To narrow the profile to your own code and skip the JVM standard library, add include/exclude filters:
try (ContinuousProfiler profiler = ContinuousProfiler.builder()
        .duration(60)
        .include("com\\.mycompany\\..*")
        .exclude("java\\..*|sun\\..*")
        .build()) {

    myApplication.run();
}
| Builder method | Description | Default |
|---|---|---|
duration(int) | Profiling window in seconds. | 30 |
alloc(String) | Allocation sampling interval (512k, 1m, 2g, or plain bytes). Lower values capture more events but increase ingested data and cost; higher values reduce overhead. | Async Profiler default |
outputDir(String) | Directory for profile output files. | java.io.tmpdir |
include(String) | Regex of stack frames to keep. | none |
exclude(String) | Regex of stack frames to drop. | none |
3. Configure with environment variables
All builder options have an environment variable fallback. Programmatic values take precedence. Set these in your container or service definition when you don't want to hardcode configuration.
| Variable | Description | Default |
|---|---|---|
CX_PROFILER_INTERVAL | Profiling interval in seconds. | 30 |
CX_PROFILER_EVENT | Event type: alloc, cpu, lock, wall. Use alloc for memory profiling. | alloc |
CX_PROFILER_ALLOC | Allocation sampling interval (e.g. 512k, 1m). | Async Profiler default |
CX_PROFILER_OUTPUT_DIR | Directory for profile output files. | java.io.tmpdir |
CX_PROFILER_OUTPUT_FORMAT | Output format: OTLP or JFR. Use OTLP to forward through the Coralogix collector. | OTLP |
CX_PROFILER_INCLUDE | Regex to include only matching stacks. | none |
CX_PROFILER_EXCLUDE | Regex to exclude matching stacks. | none |
OTEL_EXPORTER_OTLP_ENDPOINT | OTLP collector gRPC endpoint. Point this at the Coralogix collector deployed during Continuous Profiling setup. | http://localhost:4317 |
4. Verify the setup
- Start your Java service with the SDK on the classpath.
- Confirm allocation samples are reaching the collector (check collector logs or the configured
outputDirif exporting JFR locally). - Open the service in APM → Service Catalog → Profiles.
- Switch the CPU / Memory toggle above the Profile usage card to Memory and confirm the Memory Allocations chart populates.
Supported platforms
- JVM: JDK 7–25 (SDK requires Java 17+ to build and run)
- OS: Linux (x86_64, ARM64), macOS (Intel, Apple Silicon), Windows (x86_64)
- Runtime: bare metal, Docker, Kubernetes
- Overhead: ~5–10% for allocation profiling
Memory profile types
Memory profiling exposes four profile types, grouped into two families. Allocation profiles record allocation events as they happen; heap profiles sample the live heap to show what is currently retained.
| Profile type | What it measures | Units | When to use it |
|---|---|---|---|
| Allocated bytes | Total bytes allocated by each function over the selected window. | Byte units (KB/MB/GB) | Reduce garbage-collection pressure by finding functions that allocate the most memory. |
| Allocated objects | Number of allocations made by each function over the selected window. | Quantity units (K/M/B) | Find functions that allocate most often, even when each allocation is small. |
| Heap bytes | Live bytes retained on the heap by each function, sampled from the current heap. | Byte units (KB/MB/GB) | Investigate sustained memory growth and the call paths that keep memory alive. |
| Heap objects | Live object count retained on the heap by each function. | Quantity units (K/M/B) | Detect leaks or long-lived objects that accumulate over time. |
Allocation profiles answer "where are allocations happening?"; heap profiles answer "what is still resident in memory now?". Use allocation profiles to reduce garbage-collection overhead and heap profiles to investigate sustained memory growth or leaks.
Access memory profiles
- Select APM, then Service Catalog.
- Switch to the Profiles tab.
- From the Profiles view dropdown, select Memory.
- Select a Java service to open its profiling drilldown.
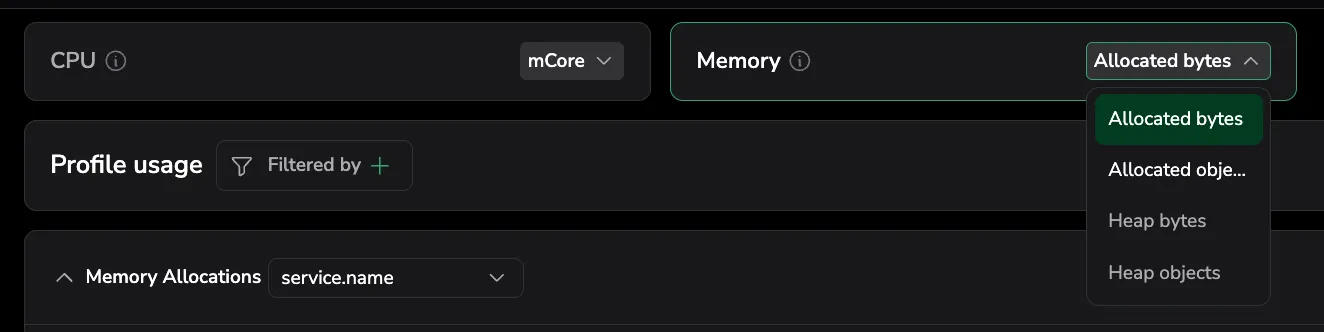
The Memory card above the Profile usage tab exposes the four memory profile types through a variant dropdown: Allocated bytes, Allocated objects, Heap bytes, and Heap objects. Each option is enabled only when that profile type has data; the card is disabled only when no option has data. Selecting a variant loads its flame graph and time series, and the choice is reflected in the profileType URL parameter so it survives reloads and shared links.
If the selected memory type has no data, the view falls back to the first available type in this priority order: Allocated bytes → Allocated objects → Heap bytes → Heap objects.
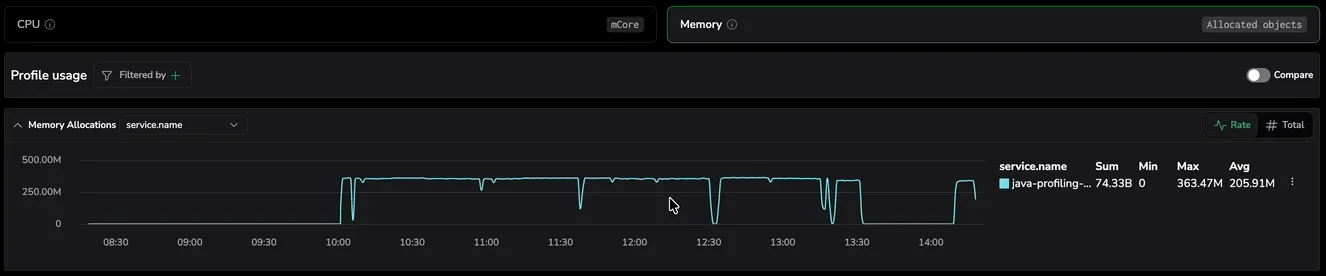
When an allocation type is selected, the metrics chart is titled Memory Allocations, the unit toggle is Rate / Total, and the flame graph Color by option is Total allocations.
The Profiles catalog memory view exposes the heap data as three extra columns: Avg. heap bytes (sparkline), Heap bytes, and Heap objects. See Profiles catalog.
Visualize memory allocation trends over time
The memory usage chart displays allocation activity or heap size over time for the selected service.
- Y-axis: Measures allocation count—the number of memory allocations made by the service over the selected time range.
- X-axis: Time range, helping you correlate memory trends with deployments, traffic changes, or system events.
Narrow the time range by selecting a region on the chart to focus on allocation spikes or memory growth patterns.
Read per-series stats
The legend table next to the chart shows Sum, Min, Max, and Avg values per series, summarizing each one over the selected timeframe.
Filter from the chart
Open the more actions menu next to a series in the legend table and select Add to filter to filter the profiling view by that value. This lets you quickly isolate a specific service, pod, or label directly from the chart without manually configuring filters.
Group by labels
Group memory metrics by labels such as pod, host_id, or envr to compare allocation behavior across instances. This helps identify whether memory issues are isolated to specific pods or widespread across the service.
Toggle between Rate and Total views
Toggle between Rate and Total views to switch the Y-axis metric. Use Rate to see allocations per second and Total to see the cumulative number of allocations over the selected timeframe.
Pinpoint functions with highest memory consumption
The function table presents a structured breakdown of memory usage at the function level, showing which functions are responsible for the most allocations.
- Self: Allocations made exclusively within that function, not counting calls to other functions. Sort by Self to find the functions generating the most allocation pressure.
- Total: Allocations made within that function and all functions it calls. High Total values indicate functions that trigger expensive allocation chains.
Focus on functions with both high Self and Total values to reduce overall memory pressure and garbage collection overhead.
Drill down with profiled stack traces
Memory flame graphs work the same way as CPU flame graphs—the width of each frame represents its share of the selected memory metric instead of CPU time.
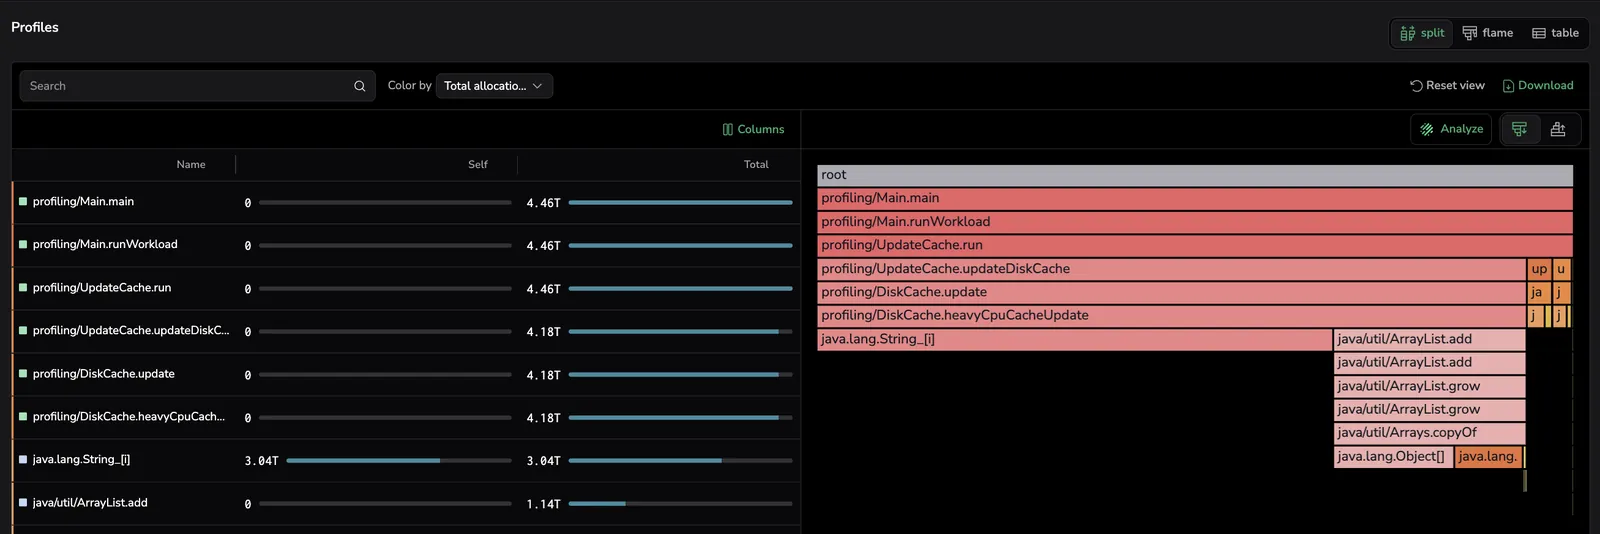
Frame width represents the total number of allocations made by each function. Use the flame graph to trace allocation paths from leaf functions (where allocations happen) up through their callers, identifying which code paths drive the most allocation pressure.
Show only user code
The Show only user code toggle next to the Color by dropdown filters both the flame graph and the allocation table to User code frames, hiding standard library, external library, native, kernel, and unclassified frames. It is off by default. Turn it on to focus on your own application code. For full behavior — including how the toggle promotes User code descendants past intermediate parents and how it composes with search and Color by — see Show only user code.
Right-click actions on the flame graph
Right-click any frame in the memory flame graph to open a context menu with per-frame actions — Focus on this frame, Copy function name, Copy stack trace, and Search for this frame. The menu behaves identically to the CPU flame graph. See Right-click actions on the flame graph for the full reference.
Locate functions in the flame graph
Select a function from the table to narrow the flame graph to stack traces involving that function. This removes unrelated call paths so you can focus on where the function is called from and what it calls.
When multiple matches exist, use the Show matches toggle to cycle through each occurrence individually or view all matches at once. For details, see Locate functions in flame graph.
Common use cases
Detect allocation hotspots
Use the function table to identify functions that allocate disproportionately often. High allocation counts in tight loops or frequently called methods are common sources of garbage collection pressure and latency spikes.
Correlate allocation spikes with deployments
Use the allocations chart to correlate memory spikes with deployment events or traffic changes. A sudden increase in allocations after a release may indicate a memory regression in new code.
Optimize garbage collection
Compare allocation profiles across two time ranges using Compare mode to validate that code changes reduced allocation pressure. Functions with high allocation counts directly increase garbage collection overhead, especially for short-lived objects in the young generation.
Related resources
| Memory profiling walkthrough | Watch on YouTube |
| Monitor CPU consumption | Monitor CPU consumption |
| Compare profiles | Compare profiles |
| Profiles Catalog | Profiles Catalog |
| Supported languages | Supported languages |
| Set up Continuous Profiling | Set up & Install |
| Async Profiler | async-profiler/async-profiler |