Supported runtimes
Coralogix Continuous Profiling supports a broad set of native and managed runtimes through the OpenTelemetry eBPF profiler. The matrix below summarizes supported versions and available profile types. Expand a language for symbolization details, runtime caveats, and troubleshooting.
Supported runtimes
| Language | Type | Versions | Profile types | Symbol upload | Notes |
|---|---|---|---|---|---|
| JVM (Java, Scala, Kotlin) | Managed | JDK 7 - JDK 25 | CPU, Memory | ❌ No | |
| Node.js | Managed | 14.x - 23.x | CPU | ❌ No | ARM64 requires Node 16+ |
| Python | Managed | 3.6 - 3.14 | CPU | ❌ No | |
| .NET | Managed | 6.0 - 10 | CPU | ❌ No | |
| Ruby | Managed | 2.5 - 4.0 | CPU | ❌ No | |
| PHP | Managed | 7.3 - 8.4 | CPU | ❌ No | |
| Perl | Managed | 5.28 - 5.42 | CPU | ❌ No | |
| Go | Native | — | CPU | ❌ No (embedded) | |
| Rust | Native | — | CPU | ✅ Yes | |
| C/C++ | Native | — | CPU | ✅ Yes | |
| Zig | Native | — | CPU | ✅ Yes |
Native binaries (Rust, C/C++, Zig) require debug symbols to be uploaded to Coralogix for human-readable stack traces — see Upload debug symbols. Go binaries embed their symbols and are symbolized automatically. Memory profiles are currently available for JVM services through the Async Profiler.
Language-specific reference
To get symbolized Rust stack traces, compile with debug symbols and upload them to Coralogix. In your Cargo.toml, set the debug profile setting to a value higher than line-tables-only:
[profile.release]
debug = "full"
For the upload workflow (CLI install, build-ID pairing, dynamic libraries), see Upload debug symbols.
C and C++ binaries are profiled by the OpenTelemetry eBPF profiler. Because they compile to Native machine code, you must upload debug symbols to Coralogix to see fully symbolized stack traces. Symbol files can be uploaded using the Coralogix symbol upload tool.
Zig binaries are profiled by the OpenTelemetry eBPF profiler. As a Natively compiled language, Zig requires debug symbols to be uploaded to Coralogix for fully symbolized stack traces. Symbol files can be uploaded using the Coralogix symbol upload tool.
Symbols for JVM languages (for example, Java, Scala, Kotlin) are supported out of the box without any additional configuration or setup.
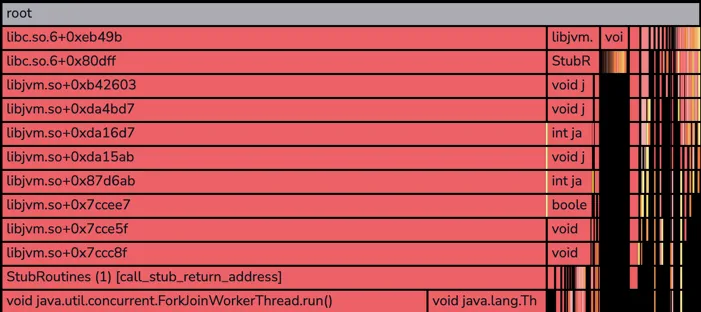
JVM frames
Most JVM services start with a few unsymbolized frames like the example below. These frames belong to the JVM runtime itself and typically are not useful for profiling analysis.
Node.js is fully supported on AMD64 across the entire version range above. On ARM64, support starts at Node.js 16.0.0. Symbols for Node.js are supported out of the box without any additional configuration or setup.
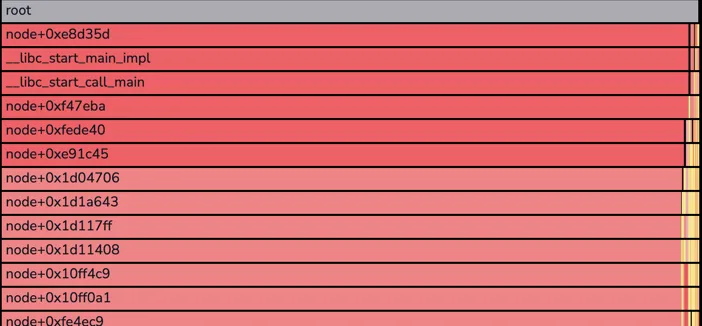
Node.js frames
Most Node.js services start with a few unsymbolized frames like the example below. These frames belong to the Node.js runtime itself and typically are not useful for profiling analysis.
Known limitations
Profiling async functions
Like most Node.js CPU profilers, the OpenTelemetry eBPF profiler has limitations when profiling asynchronous functions. Reconstructing asynchronous call stacks requires accessing the Node.js (V8) heap, which introduces significant overhead. As a result, asynchronous call stacks are currently recorded separately, without reconstructing the full end-to-end call stack.
Troubleshooting
Named anonymous functions appear as <anonymous> with ESBuild
When using ESBuild to bundle your Node.js application, named anonymous functions might appear as <anonymous> in the profiling data instead of their actual names. This happens when using the keepNames option in ESBuild, which doesn't correctly reset the function names of anonymous (arrow) functions after minification.
Python applications work out of the box with the OpenTelemetry eBPF profiler.
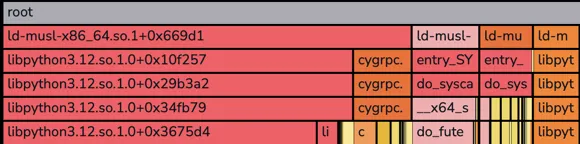
Python frames
Most Python services start with a few unsymbolized frames like the example below. These frames belong to the Python runtime itself and typically are not useful for profiling analysis.
Next steps
Learn how to visualize and analyze CPU usage across your services in Monitor CPU consumption.