Create and manage variables
Overview
Variables allow you to build flexible, interactive Custom Dashboards. Instead of hardcoding values like environment names or service IDs directly into each widget’s query, you can define a template variable once and reuse it throughout your dashboard.
This guide walks you through how to set up, create, and use dashboard variables.
Create a variable
To create a new variable:
- Click {} on the left side of the dashboard.
- In the VARIABLES panel, click + Variable.
- Enter the variable details including the variables name, display name, and optional description.
| Field | Description |
|---|---|
| Variable name | Internal reference used in widget queries (e.g., ${env}). Must be unique, lowercase, and contain no spaces. |
| Display name | Friendly label shown in the dashboard toolbar. Can contain spaces and capitalization. |
| Description (optional) | Tooltip shown on hover to explain how the variable is used. Helps collaborators understand its purpose. |
Choose how the variable will behave based on the kind of values it should accept.
Choose a value type
Each variable must have an Expected Value Type that defines the kind of data the variable is meant to hold. Specific Methods (how the values are provided) are supported based on the value type you selected.
Note
The value type determines the kind of values the variable selects. The method is the mechanism in which the values are assigned to the variable.
| Expected Value Type | Purpose | Supported Methods | Example Use Cases |
|---|---|---|---|
| Single string | A single value selected or entered | Static values, Text box, all Query (All sources: DataPrime, metrics, logs/spans) | Filter by one service, team, or region |
| Multi-string | One or more values (tags-like input) | Static values, Query (All sources: DataPrime, metrics and logs/spans) | Filter by multiple environments, error codes |
| Numeric | A single number | Text box, Static values, DataPrime query | Thresholds, percentile selection, scaling factor |
| Regex | A pattern-matching expression | Text box | Match log labels or spans using wildcard/pattern filters |
| Lucene | A structured Lucene query | Text box | Inject a Lucene query into logs, spans, or DataPrime queries |
| Interval | A time duration (e.g., 5m, 1h, 1d) | Static values, Text box | Bucket size for charts, rolling windows, step sizes for range selectors |
Note
Some methods support both single and multiple values. A query-based method, for example, may return multiple values, but whether the variable accepts multiple selections depends on the value type (single-string vs. multi-string).
Choose a method
The method defines how the values for the variable will be entered, retrieved, or calculated. Each method has its own configuration rules and use cases.
| Method | Description | Supported value types |
|---|---|---|
| Static values | Enter a fixed list of values (e.g., frontend, backend). | single-string, multi-string |
| Text box | Allow dashboard users to manually input values. | single-string, numeric , regex, Lucene, interval |
| Query | Dynamically populate values by querying logs, spans, metrics, or using DataPrime. | single-string, multi-string, numeric |
Static values method
Use static values when you know the set of possible options in advance, such as teams, environments, or regions. Also useful for predefined interval options like 1m, 5m, 15m, 1h so you can easily switch bucket sizes across multiple visualizations.
Configuration
- Enter values as a comma-separated list (e.g.,
frontend, backend, api). - Optionally map query values to user-friendly display names using
key : valuesyntax (e.g.,us-east:US East). The left side (key) is the display value used in the query, and the right side (value) is the actual value injected into the variable. - Set a default value to preselect when the dashboard loads.
- Sort: Choose how values are ordered in the dropdown. Select None to preserve the exact order in which you defined the values. This is particularly useful for interval variables (e.g.,
1m, 5m, 15m, 1h) where alphabetical sorting would produce an unintuitive order.
Behavior
- Users select from a predefined dropdown list.
- Values do not update unless manually edited.
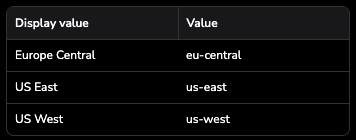
Use-case example
You define a variable region with values:
This shows “US East” in the dropdown, but injects us-east in your queries.
Colons and spaces behavior
The way you type the colon determines whether the string is split into a display value and an actual value:
| Input string | Display value | Value | Notes |
|---|---|---|---|
US East : us-east | US East | us-east | Space-colon-space splits into Display value and Value |
US:East | US:East | US:East | No spaces treated as a single literal value |
Text box method
Text boxes allow you to manually enter values in the dashboard. The variable method defines how input is interpreted and validated.
- Single-string: Manually enter a single text value.
- Numeric: Enter numbers for thresholds or parameters.
- Regex: Enter regex patterns to filter or extract values.
- Lucene: Enter Lucene query expressions for logs/traces (e.g.,
resource.attributes.cloud_region:"us-east-2”). - Interval: Enter a duration in PromQL-style syntax (e.g.,
30s,5m,1h,2d). Supports combined notation such as1d6h30m10sfor precise day-hour–minute–second intervals. Validation ensures a well-formed duration and rejects invalid sequences.
Behavior
- Users type values into a text field at runtime.
- Used for dynamic filters and template inputs.
- Lucene and Regex are mutually exclusive and must be chosen at variable creation.
- Interval inputs are treated as literal durations and can be injected anywhere a duration is expected.
Use-case examples
Lucene
Allows structured expressions such as severity: “error”
or cx_rum.environment: "production".
Example widget query:
Use when you need field-based filtering, especially for complex log or span queries that can include boolean logic, phrase matching (e.g., "connection timeout") or exact field-value pairs.
Regex
Regex (regular expressions) textbox allows you to match, filter, or transform variable values based on patterns instead of exact matches. This is useful when your values share naming patterns (e.g., different node IDs, region codes, or service prefixes) and you want to select them dynamically without listing every possibility.
Supports input like .*prod.* and named capture groups (e.g., (?<value>.*)):
Example widget query (PromQL):
If ${hostname} is a variable populated with node names, the regex ensures that the variable includes only values matching the node naming pattern. The =~ operator applies the regex filter inside the metric query.
Number
Used for:
- Thresholds in visualizations
- Statistical filters (e.g., percentiles)
- Multipliers or units
Examples widget queries (metric):
1. Percentile value with scaling factor
This PromQL query calculates the 99th percentile from a histogram and then multiplies the result by ${factor}. Set ${factor} to apply a scaling or unit conversion (for example, 1000 to convert seconds to milliseconds).
2. Dynamic percentile selection
Here, ${factor} is a numeric variable that determines which percentile to display (for example, 0.5 for median, 0.9 for the 90th percentile). You can switch the value at runtime to explore different percentiles without editing the query.
Interval
Use an interval variable when you want dashboard users to control how data is grouped or aggregated over time. Intervals can be applied in PromQL or DataPrime queries to define bucketing, windowing, or range selector durations.
1. PromQL range selector window
Set ${time_bucket} interval variable to 1m, 5m, or 15m to explore different smoothing windows.
2. PromQL bucketing in functions
In this example,${time_bucket} is an interval variable controlling the time span that the avg_over_time() function uses when aggregating memory usage data. This lets users change the bucket size directly from the dashboard, making the chart more or less granular without editing the query.3. DataPrime time bucketing
In DataPrime, use the $p.time_bucket interval variable to set the time bucket size used to group log entries. Shorter intervals (for example, 1m) show more detail, while longer intervals (for example, 1h) smooth out the data for trend visualization. Use interval variables when you want a user-controlled bucket, and use $p.timeRange.suggestedInterval when you want the bucket to auto-adjust with the dashboard time range.
Query method
Use the query method when you want to populate variable values dynamically based on your latest telemetry data. This is sourced and retrieved from logs, spans, metrics, and DataPrime queries.
Behavior
- A query runs in the background to retrieve possible values.
- The values list updates automatically.
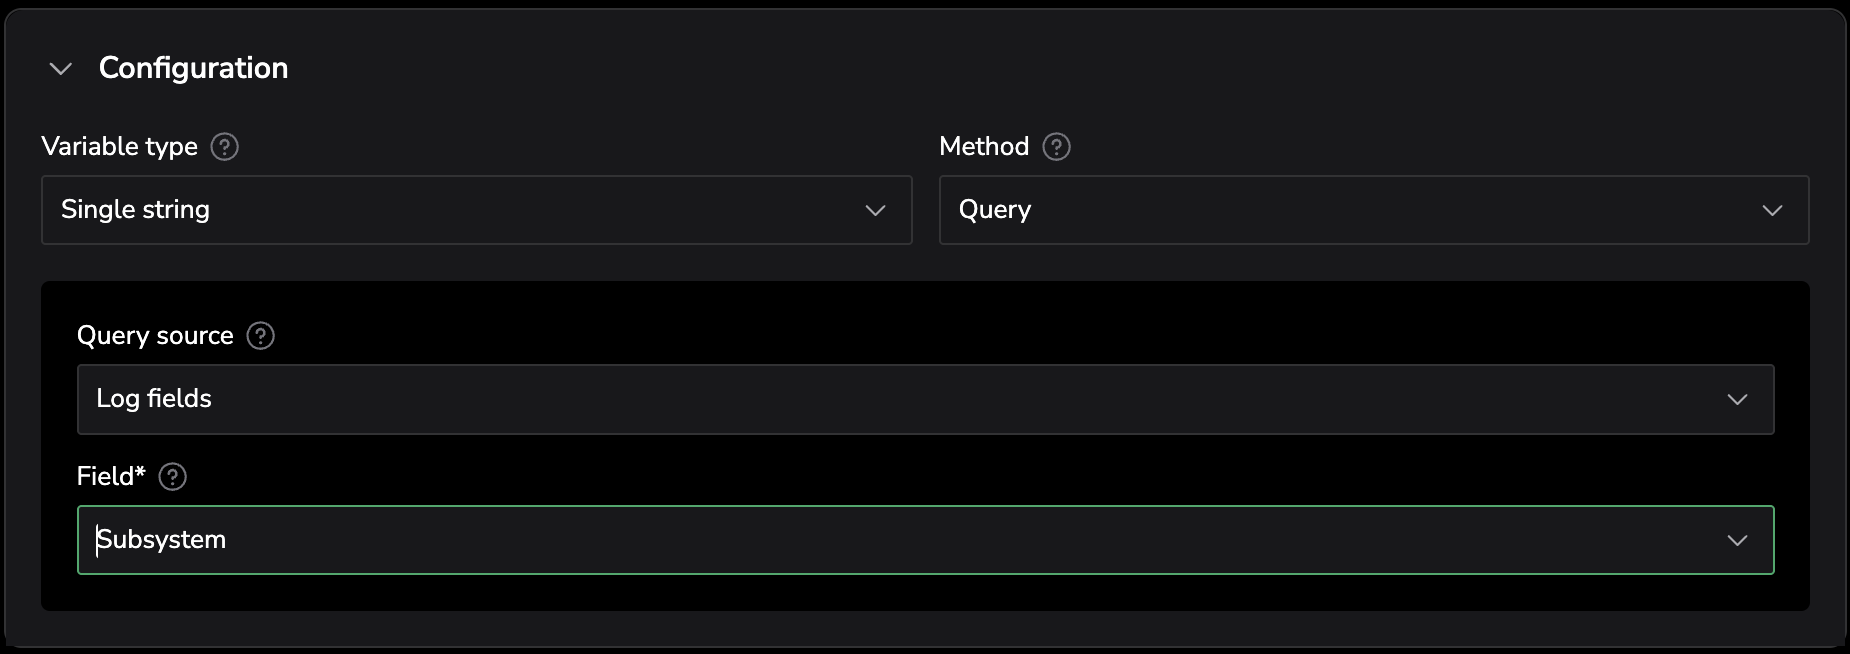
Logs or spans
- Select a field (e.g.,
objectRef.name,json.http_resp_status) - The variable dropdown shows all distinct values for that field.
Use Case: Filter by severity from span metadata.
Metric names or labels via regex
- Use regex to filter metric names or label names.
Example:
Use case: Populate a variable with only Kubernetes label keys related to names (e.g., cluster_name, namespace_name, pod_name). This keeps the variable dropdown focused on relevant dimensions without including unrelated labels like UIDs or cloud provider tags.
Metric label values
Use this method to populate your variable with the values of a specific label from a selected metric. This is useful when you want to filter widgets by metric attributes like cpu, or instance.
- Optionally, select a metric (e.g.,
http_requests_total). The metric name is not required — if left blank, label names are fetched across all available metrics. - Choose a label (e.g.,
status_code). The variable is populated with all values of that label. - Optionally, add label filters to limit which metric series are queried when retrieving values.
Note
The Values Preview shows up to 1,000 label values. If your results are truncated, use the search field to narrow results by typing a prefix or substring. If more than 1,000 values match, a message appears prompting you to refine your search term.
Note
You can reference other variables inside the label filters. This allows you to “nest” variables, so the label values shown for this variable depend on the selection made in another variable. See Advanced nested variables for a detailed example.
Use Case: Filter dashboards by metric dimensions such as HTTP status codes or region, based on the labels defined in your metric data.
DataPrime
- Write a custom DataPrime query that returns values.
- Your query can retrieve values from logs, metrics, or spans. Learn more about DataPrime queries.
- Reference template variables in your widgets using
$p.variableName.
Example:
Use Case: Dynamically generate values for log severities or groupings.
Format and filter display values
Filter display values
Use regex to include or exclude certain results from the values list.
Example: /frontend.*/ filters for services starting with “frontend”.
Format display values
Use named regex capture groups to specify which part of the value should be displayed in the values list.
Example: If the query returns values like kube-events or kube-proxy, use kube-(\w+) to display only events and proxy. The variable still resolves to the full original value in queries.
If no groups are defined, the full match is used for both display and value.
Use variables in queries
You can reference variables in widget queries across all query languages. For consistency in the examples below, assume you have created these variables:
app— a single-string variable holding application names.sub— a multi-string variable holding subsystem names.pod— a multi-string variable holding pod names.time_bucket- Interval variable (e.g.,5m,1m)
| Query Type | Syntax | Example |
|---|---|---|
| Lucene | ${variable} | coralogix.metadata.applicationName:${app} (Injects the selected application name) |
| PromQL | ${variable} | rate(http_requests_total{pod=~${pod}}[5m]) (Filters by one or more pod names) |
| DataPrime (single value) | $p.variable | filter $l.applicationname == $p.app |
| DataPrime (multi value) | $p.variable | filter $m.severity == ERROR | filter $l.applicationname.inArray($p.app) | groupby agg count() (Counts error logs for the selected applications) |
| DataPrime (interval) | $p.variable | groupby $m.timestamp / $p.time_bucket as timestamp agg count() |
Note
In DataPrime, multi-value variables resolve to null when All(*) is selected in the variable's values list. Add an OR (||) condition to ensure the filter still returns results. For details see the Include all option section.
Multi-value selection options
Multi-string variables offer two ways to select all values at once: the Include All configuration option and the Select All checkbox. Each serves a different purpose.
Include all option
Enable Include All to add an All(*) option to the variable dropdown. This option represents all available values, including any values added in the future.
Behavior:
- All(*) automatically maps to every available result, including values that do not yet exist.
- The dropdown option label can be renamed (e.g., “Any”, “All (*)”).
- If you disable Include 'All' option, users must manually select one or more values.
- DataPrime only: When a user selects All(*) for a multi-string variable, the variable value becomes
nullin the DataPrime query, not an array of all strings. To keep the filter working, add an OR (||) condition that lets the filter return results when the variable value isnull. For example:
Select All checkbox
The Select All checkbox in the variable dropdown lets you select or deselect every currently listed value at once. Unlike the Include All option, Select All explicitly selects each individual value rather than injecting a wildcard.
Behavior:
- Selecting the Select All checkbox checks every value currently displayed in the dropdown.
- Deselecting the checkbox clears all selected values.
- Adding or removing individual values after using Select All updates the selection accordingly, and the Select All checkbox reflects the current state.
- Works independently of the Include All option. You can enable both on the same variable:
- Include All adds the All(*) wildcard entry to the dropdown.
- Select All provides a convenience checkbox to toggle all currently listed values.
When to use each option:
| Option | Use when |
|---|---|
| Include All | You want a single wildcard selection that covers all current and future values without listing them individually |
| Select All | You want to explicitly select every currently listed value, then optionally deselect specific ones |
Advanced: nested variables
You can use the values of one variable inside another’s query, or inside the filter configuration of a metric label values variable.
Example 1: Nested query:
Define a cluster variable and use it in a pod variable:
source logs | filter $d.resource.attributes.k8s_cluster_name == $p.cluster | distinct $d.kubernetes.pod.name
This filters pod values by the selected values in your cluster variable.
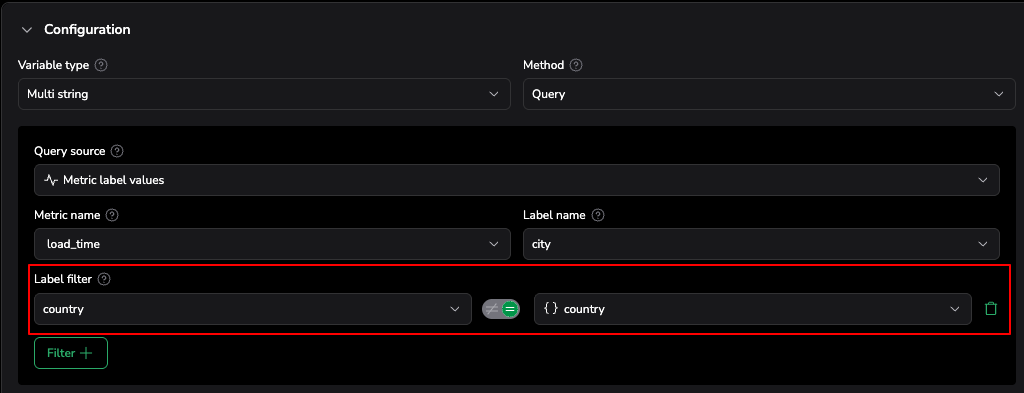
Example 2: Nested metric label value
- Create a variable called
country.- Method: Query → Metric label values
- Metric name:
load_time - Label name:
country
- Metric name:
- Method: Query → Metric label values
- Create another variable called
city.- Method: Query → Metric label values
- Metric name:
load_time - Label name:
city - Add a filter
countryand set it equal to the{} countryvariable that you just created.
- Metric name:
- Method: Query → Metric label values
At runtime, the city variable only lists values that belong to the selected country. For example, if you pick Germany, the city dropdown only shows Berlin. Switching to United States expands the dropdown to New York, San Francisco, and other U.S. cities.
Manage variables
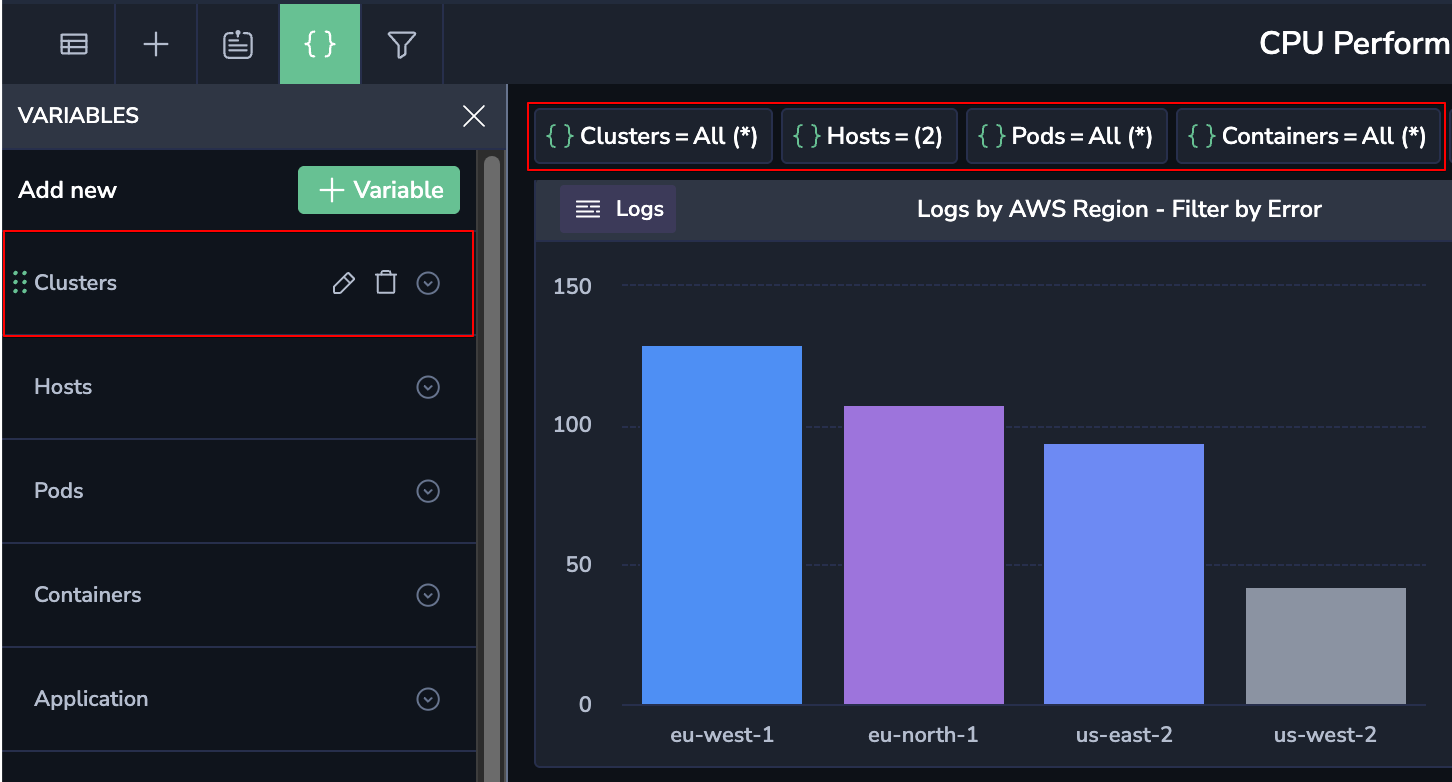
Easily view and manage the variables from the Custom Dashboards upper toolbar.
Edit or delete
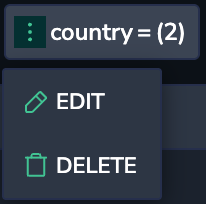
To edit or delete a variable:
- Hover over the variable at the top of the dashboard.
- Click the

- Select EDIT or DELETE from the dropdown.
Reorder variables
Variables support drag-and-drop reordering, allowing you to organize them in a logical and meaningful order-especially helpful after adding new variables.
To reorder one or more variables:
- Click

- In the VARIABLES panel that opens, drag variables up or down to update their order in the toolbar at the top of your dashboard.
Query with template variables
You can use template variables in Lucene, PromQL, or DataPrime queries to build reusable dashboards. This eliminates the need to input the same data points into each widget, and instead allows you to filter all the widgets on your dashboard simultaneously with one variable.
To edit the query, select the widget and navigate to the query builder at the bottom of the screen.
Lucene
In a Lucene query, a template variable is referenced with ${variable_name} syntax.
Example:
In this example, the pid is the variable name, which must match the name you defined in the dashboard.
PromQL
In a PromQL query, a template variable is referenced with ${variable_name} syntax.
Example:
In this example, {pod=~${pod}} is a label selector that filters the kube_pod_owner metric for the specific pod whose name matches the name selected in the ${pod} template variable. The ${pod} is dynamically replaced with the selected pod when the query runs.
DataPrime
In a DataPrime query, a template variable is accessed with $p.<variable_name> syntax.
Example:
source logs
| filter $l.applicationname.inArray($p.application)
| groupby $l.applicationname as Application
, $m.timestamp / 10m as timestamp agg count() as count
In this example, the DataPrime query groups log activity into 10 minute intervals and filters them by the selected application dashboard variable, using a parameter that dynamically updates based on the variable you select. This allows you to compare log volume across one or more applications.
Learn more about query parameters.
Global variables
Coralogix provides predefined, system-managed variables that automatically adapt to the scope of your dashboard context. These variables can be included directly in your widget queries and update dynamically when the global dashboard context changes, such as when you adjust the dashboard time range using the time picker.
PromQL predefined variables
Use these variables in metrics-based widgets.
| Variable | Description | Example |
|---|---|---|
${__range} | This variable represents the duration of the dashboard time range. It is rendered as an interval string supported by PromQL. e.g., If one selects a time range from 13.00 to 14.30, then ${__range} will be rendered as 90m. | 30m, 1d |
${__range_s} | Rendered as the number of seconds in the selected time frame. | 60s, 180s |
${__range_ms} | Rendered as the number of milliseconds in the selected time frame. | 60ms, 180ms |
${__interval} | A dynamic interval based on the selected time range. Used to group time series data efficiently in visualizations. Behavior depends on the widget type. In widgets that support time bucket configuration (such as line charts and vertical bar charts by time), the ${__interval} variable resolves to the value set in the widget's configuration. In other widgets, it defaults to the selected time range divided by 96. | 5m, 1h, 1d |
${__interval_s} | The ${__interval} value in seconds, rendered as a number. Useful for functions that require interval math in seconds. | 60s, 1200s |
${__interval_ms} | The ${__interval} value expressed in milliseconds as a number. Useful for calculations or functions requiring millisecond precision. | 60000ms, 1200000ms |
${__rate_interval} | A dynamic range for PromQL rate() queries. It resolves to the larger of ${__interval} + 15s or 60s, ensuring both adequate overlap and enough data points for accurate calculations. | 60s, 2m |
${__rate_interval_s} | The ${__rate_interval} value in seconds, rendered as a number. | 60s, 120s |
${__rate_interval_ms} | The ${__rate_interval} value expressed in milliseconds as a number. Enables precise math and comparisons. | 6000000ms, 1200000ms |
Example:
This query calculates the average CPU time accumulated across all nodes over the time range selected in the dashboard. The ${__range} variable dynamically reflects the current time picker selection, so the aggregation always matches the visible timeframe.
DataPrime predefined variables
Take advantage of predefined global dashboard variables in your widgets querying with DataPrime.
| Variable | Description | Example |
|---|---|---|
$p.timeRange.startTime | The start of the dashboard time range, based on the current time picker setting. Use this to align query results with the visible time scope. | 1d, 5m, 60s |
$p.timeRange.endTime | The end of the dashboard time range, based on the current time picker setting. Use this to align query results with the visible time scope. | 1d, 5m, 60s |
$p.timeRange.suggestedInterval | The suggested interval variable allows you to include queries that automatically adjust the widget's query and visualization according to the current dashboard time range by dividing it into 96 uniform time buckets. This ensures the query and visualization remain appropriately scaled as users change the time picker. | 1d, 5m, 60s |
$p.timeRange.startTimestamp | The start of the dashboard time range as a Unix millisecond timestamp. Always returns an absolute timestamp, even when the dashboard uses a relative time range such as Last 15 minutes. Use this in Custom Actions when the target URL requires an absolute timestamp. | 1775023456543 |
$p.timeRange.endTimestamp | The end of the dashboard time range as a Unix millisecond timestamp. Always returns an absolute timestamp, even when the dashboard uses a relative time range. Use this in Custom Actions when the target URL requires an absolute timestamp. | 1775023456543 |
Example:
source logs | groupby $m.timestamp / $p.timeRange.suggestedInterval
as timestamp agg count() as count
This example dynamically groups log data by time without hardcoding an interval, ensuring the widget adapts gracefully across different time ranges. Use $p.timeRange.suggestedInterval instead of manually selected a time interval, which can result in charts that are too broad or too granular when the time range is adjusted.
Global variables auto-scale with the dashboard’s time range. In contrast, interval variables are user-selected durations you define and expose in the toolbar for manual control.
Additional resources

Next steps
Learn how to create and manage annotations on your dashboard widgets.


