Create and manage annotations
Use annotations in Custom Dashboards to call out important events or value thresholds on your charts. Annotations help you correlate deployments, incidents, and recurring patterns with trends you see in logs, spans, metrics, and DataPrime queries.
By the end of this tutorial, you’ll be able to add, configure, and display annotations on your widgets using queries or manual inputs.
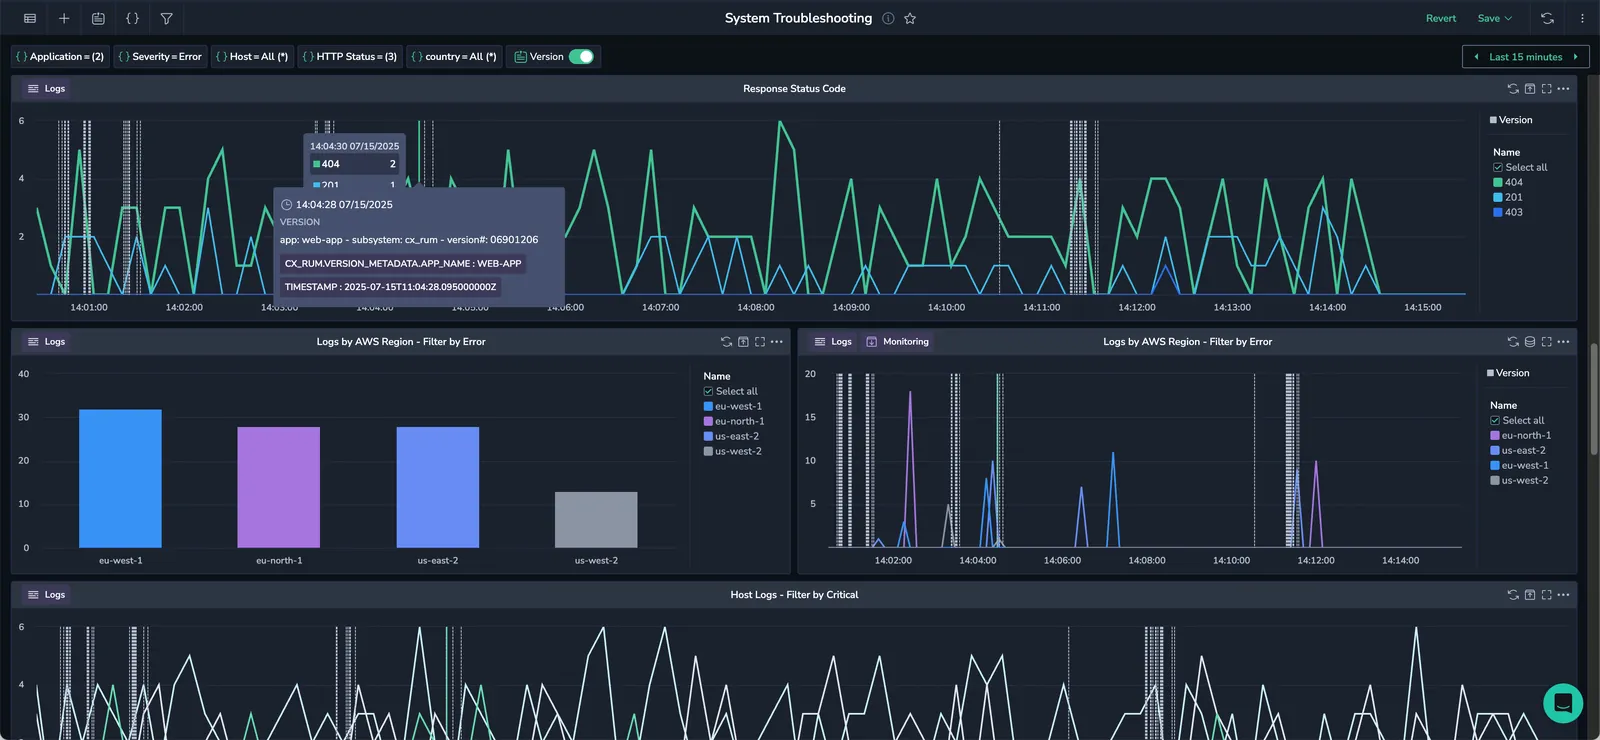
Overview
Annotations add visual markers, in the form of dotted lines or shaded areas, directly on your charts. These markers highlight key events or thresholds so you can quickly connect changes in your logs, spans, or metrics to real-world actions such as deployments, incidents, or configuration updates.
- Vertical annotations highlight a point in time or a time range.
- Horizontal annotations highlight a numeric value or range.
- Hover over an annotation to see its details, labels, and optional text with placeholders.
- Apply annotations to all relevant widgets in a dashboard or only to selected widgets.
Create an annotation
Add a new annotation by opening the annotations panel in your custom dashboard.
At the top of your dashboard click  Manage Annotations.
In the ANNOTATIONS panel, click + Annotation.

In the Create annotation drawer, configure the annotation settings.
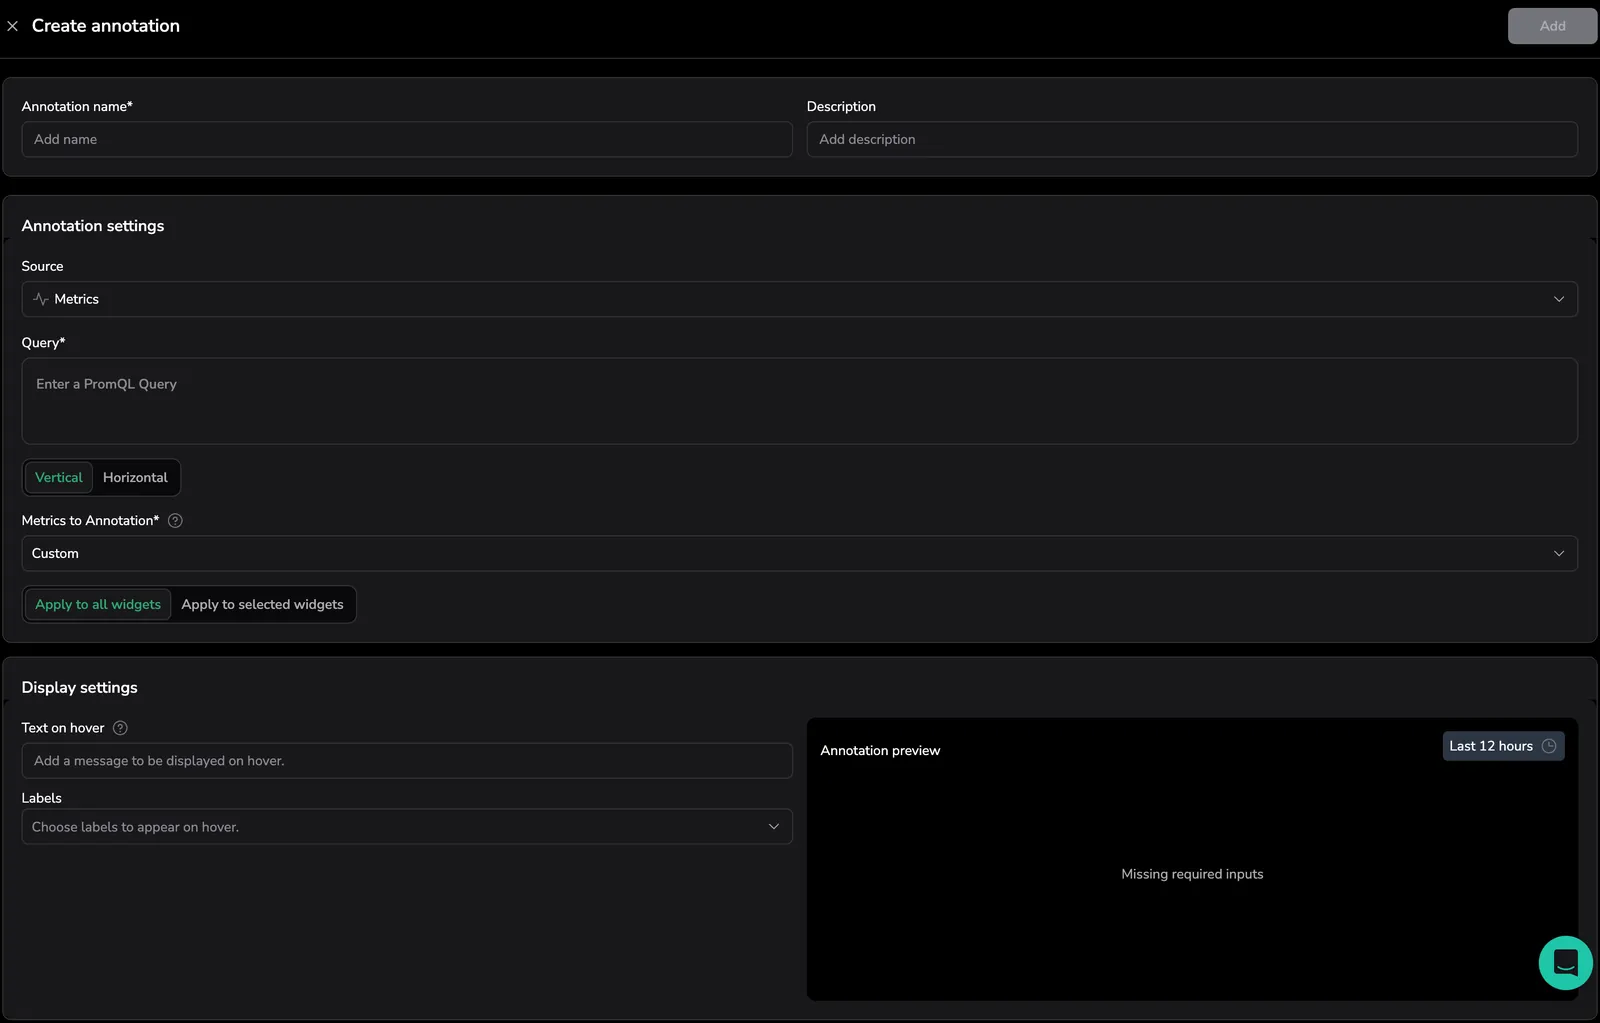
If you are satisfied with the annotation displayed in the Preview, click Add.
Details
Identify your annotation.
- Annotation name: Give the annotation a clear, descriptive name.
- Description: Optionally, add the annotation context or purpose for your team.
Annotation settings
Define how the annotation is generated and applied to widgets.
Source
Select one of the supported sources:

Annotation source menu showing available sources.
| Source | Orientation | Type | Description |
|---|---|---|---|
| Logs | Vertical | Single / Range | Lucene query; select timestamp fields. |
| Spans | Vertical | Single / Range | Similar to logs; duration fields often available. |
| Event recurrence (pending-release) | Vertical | Single / Range | Define repeating weekly periods (day, start time, duration). |
| Metrics | Vertical or Horizontal | Single | Choose a metric or enter a PromQL query. |
| DataPrime | Vertical or Horizontal | Single / Range | Use a DataPrime query; map timestamp or value fields. |
| Manual | Vertical or Horizontal | Single / Range | Select dates and times from the picker or numeric values manually. |
For query-based sources (logs, metrics, spans, DataPrime), annotations appear when data in your system matches the query. Each time the dashboard refreshes, the annotation is redrawn based on the latest matching results.
Before creating a query-based annotation, make sure you know which fields in your data represent timestamps or numeric values. You’ll need these when selecting start and end times or value ranges.
Mode
Select where the annotation query runs:
- Frequent Search: Runs in the Frequent Search pipeline, alongside dashboard queries.
- Monitoring: Runs in the Monitoring pipeline.
Mode selection is available for logs, spans, and DataPrime query sources only.
These sources run queries directly against Coralogix data pipelines, so you can choose where the query executes.
In Coralogix, logs and traces are routed to different pipelines, known as priority levels, based on your data policy.
-
Frequent Search data stored on fast SSDs (solid state drive) for low-latency queries.
-
Monitoring data is optimized for dashboards, alerts, and analysis at scale across longer time horizons.
Learn more about TCO pipelines.
Annotation type
Choose Single or Range.
- Single: One timestamp or value field.
- Range: Start + end fields, or start + duration field (a data attribute such as
duration_ms).
Orientation
Decide whether to plot the annotation on the time axis (vertical) or the value axis (horizontal). Horizontal orientation is supported only for metrics, DataPrime, and manual sources.
| Orientation | Description | Typical use | Supported sources |
|---|---|---|---|
| Vertical | Marks a point in time or time range | Deployments, outages, recurring events | All sources |
| Horizontal | Marks a numeric value or range | Thresholds, KPI limits, averages | Metrics, DataPrime, Manual |
Metrics to annotation
When the source is Metrics, use the Metrics to Annotation field to set how metric series become annotation markers. The available strategy is "Start time" metric, which reads each returned series' value as an epoch timestamp in milliseconds and draws a vertical annotation at that point in time.
Use it directly with metrics whose value is already a timestamp. For example, kube_pod_start_time exposes the pod start time as its value, so the metric works as-is and produces an annotation per pod.
For metrics whose value is not a timestamp, transform the query so the returned value becomes the event timestamp. Wrap the condition in PromQL's timestamp() function and multiply by 1000 to convert seconds to milliseconds:
timestamp(<your_metric> > 0) * 1000
Mark alerts as annotations. To overlay alert firings on every dashboard widget, query cx_alert_evaluation with the same transformation:
timestamp(cx_alert_evaluation > 0) * 1000
cx_alert_evaluation is nonzero while an alert is firing. The expression returns the evaluation timestamp at each firing point, which the "Start time" strategy plots as a vertical marker. Add alert_name and alert_severity under Labels in Display settings so the alert name and severity appear in the tooltip on hover.
Mark deployments as annotations. The same pattern turns any deployment-indicator metric into deployment markers, useful for correlating release events with errors, latency, or traffic on your dashboards.
Apply to
Choose whether the annotation appears on all widgets or only on selected widgets.
- Vertical annotations (time-based) apply to all relevant widgets by default.
- Horizontal annotations (value-based) are unit-specific, so you must manually select each widget where the annotation should appear.
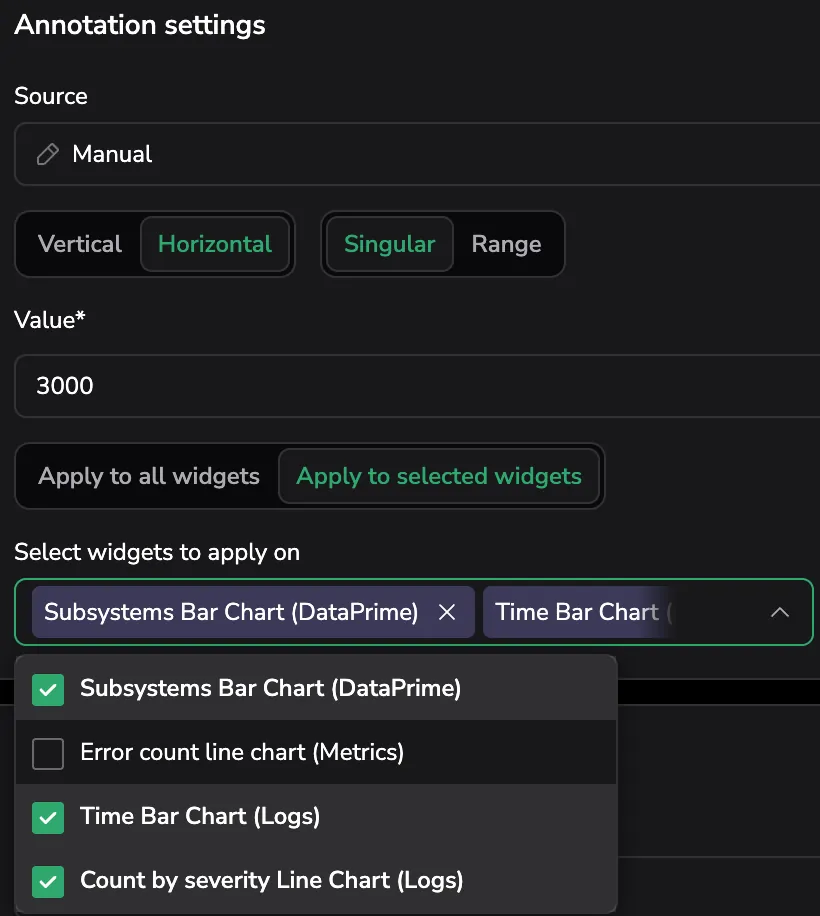 Select which widgets to include when applying a horizontal or scoped annotation.
Display settings
Customize how the annotation appears on your dashboard.
- Text on hover: Optional message shown when hovering. Use double curly braces for dynamic placeholders, for example:
app: {{applicationname}} - subsystem: {{subsystemname}} - version#: {{cx_rum.version_metadata.app_version}} - Labels on hover: Select fields to display as
key: valuepairs in the tooltip. - Color: Pick a color to group similar annotations (for example, deployments as red and maintenance as yellow).
Preview time frame
When you create or edit an annotation, the Preview panel shows a mini chart with the annotation plotted against real data. The preview time frame adapts to the dashboard's current time range:
- If the dashboard time range is shorter than 24 hours, the preview promotes it to Last 24 hours (for relative ranges) or extends 24 hours back from the end of the window (for absolute ranges).
- For manual and recurring annotations, if the annotation's data falls outside the base window, the preview expands further to encompass it. An event span shorter than 6 hours gains an hour of padding on each side; a longer one expands to the nearest 12-hour boundary (00:00 or 12:00 local time).
- Horizontal annotations never widen the window. Their values are plot values rather than timestamps.
A chip at the top of the preview shows the active preview window, for example, Last 24 hours or a formatted date range such as Aug 4, 2026 00:00 - Aug 5, 2026 00:00. The chip is read-only and updates automatically as you configure the annotation.
Hide annotations
When an annotation is created, it applies to all time-based widgets in your dashboard. Toggle your annotation on and off for all widgets in the dashboard toolbar.
Toggle an annotation on and off in a specific widget by clicking on the annotation name in the widget legend.
Modify or delete annotations
At the top of your dashboard click Manage Annotations.
In the ANNOTATIONS panel, click Edit Annotation to update or Delete Annotation to remove the annotation.
Additional resources
Next steps
Learn how to import and export Custom Dashboards.