# Migrate from OpenSearch to Coralogix Custom Dashboards
Copy as Markdown[Open in ChatGPT](https://chatgpt.com/?q=Read%20https%3A%2F%2Fcoralogix.com%2Fdocs%2Fuser-guides%2Fcustom-dashboards%2Ftutorials%2Fmigrate-from-opensearch-to-coralogix-custom-dashboards.md%20and%20help%20me%20with%20my%20question%20about%20this%20Coralogix%20documentation%20page.)[Open in Claude](https://claude.ai/new?q=Read%20https%3A%2F%2Fcoralogix.com%2Fdocs%2Fuser-guides%2Fcustom-dashboards%2Ftutorials%2Fmigrate-from-opensearch-to-coralogix-custom-dashboards.md%20and%20help%20me%20with%20my%20question%20about%20this%20Coralogix%20documentation%20page.)
Coralogix [Custom Dashboards](https://coralogix.com/docs/docs/user-guides/custom-dashboards/introduction/.md) provides you with the ideal dashboard experience, allowing you to create unlimited, personalized custom dashboards using our five visualizations: [Data Table](https://coralogix.com/docs/docs/user-guides/custom-dashboards/widgets/data-tables/.md), [Line Chart](https://coralogix.com/docs/docs/user-guides/custom-dashboards/widgets/line-charts/.md), [Gauge](https://coralogix.com/docs/docs/user-guides/custom-dashboards/widgets/gauges/basic-gauges/.md), [Pie Chart](https://coralogix.com/docs/docs/user-guides/custom-dashboards/widgets/pie-charts/.md) and [Bar Chart](https://coralogix.com/docs/docs/user-guides/custom-dashboards/widgets/vertical-bar-charts/.md). Each visualization - supporting logs, metrics and spans - can be used to define and create a dashboard catered to your specific observability needs.
The following tutorial demonstrates how to migrate from OpenSearch to Coralogix [Custom Dashboards](https://coralogix.com/docs/docs/user-guides/custom-dashboards/introduction/.md). Using a series of examples, it illustrates which OpenSearch dashboard parameters correlate with those in Coralogix Custom Dashboards.
## Data tables[](#data-tables "Direct link to Data tables")
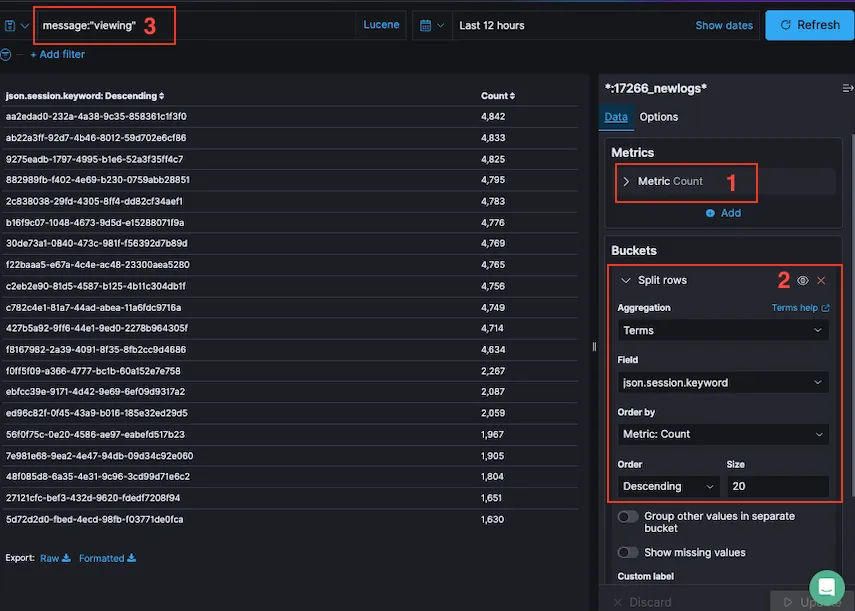
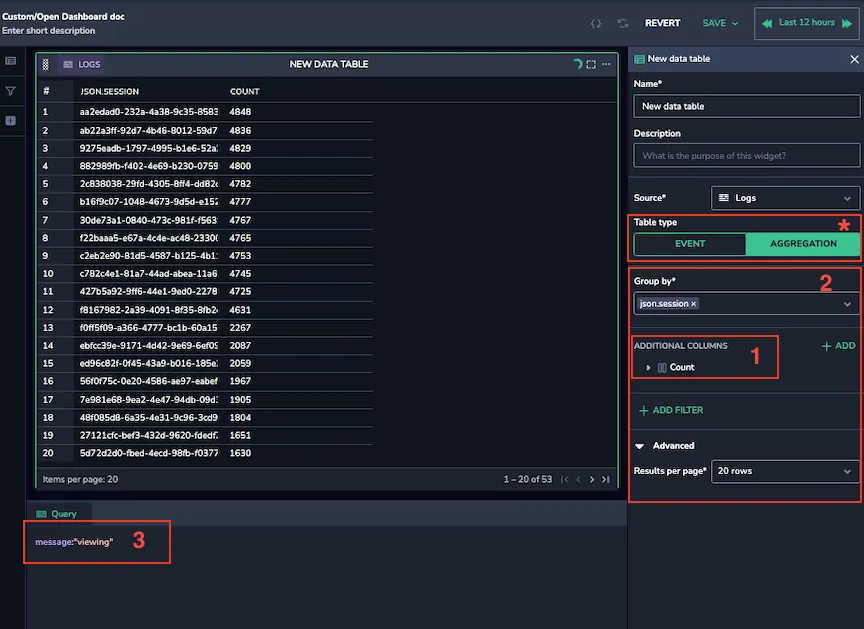
Migrate a [data table](https://coralogix.com/docs/docs/user-guides/custom-dashboards/widgets/data-tables/.md) from your OpenSearch dashboard to your Coralogix Custom dashboard.
### OpenSearch dashboard[](#opensearch-dashboard "Direct link to OpenSearch dashboard")
[](https://coralogix.com/docs/docs/assets/images/Untitled-38-8621ecc666695dc518a3ad2c2930cb59.webp)
### Custom Dashboards[](#custom-dashboards "Direct link to Custom Dashboards")
[](https://coralogix.com/docs/docs/assets/images/Untitled-39-6cc9865f79e10ce0c96ad533aa153373.webp)
### Migrate parameters[](#migrate-parameters "Direct link to Migrate parameters")
For each section (1, 2, 3, or \*), migrate the parameters from your OpenSearch dashboard to your Coralogix Custom dashboard.
| Section | OpenSearch Dashboard Parameter | Coralogix Custom Dashboard Parameter | Notes |
| ------- | ------------------------------ | ------------------------------------ | --------------------------------------------------------------------------------- |
| 1 | Aggregation | Aggregation | |
| 2 | Split rows | Group-by | |
| 3 | Lucene query | Query bar | |
| \* | --- | Data Table: Event or Aggregation | Data-table has two options:
- Event: log grid
- Aggregation: data table |
For example, transfer the aggregation value in Section 1 of your OpenSearch Dashboard to the aggregation parameter value in Section 1 of your Coralogix Custom dashboard.
For additional information on data tables, see the full tutorial on [Data Tables in Custom Dashboards](https://coralogix.com/docs/docs/user-guides/custom-dashboards/widgets/data-tables/.md).
## Line charts[](#line-charts "Direct link to Line charts")
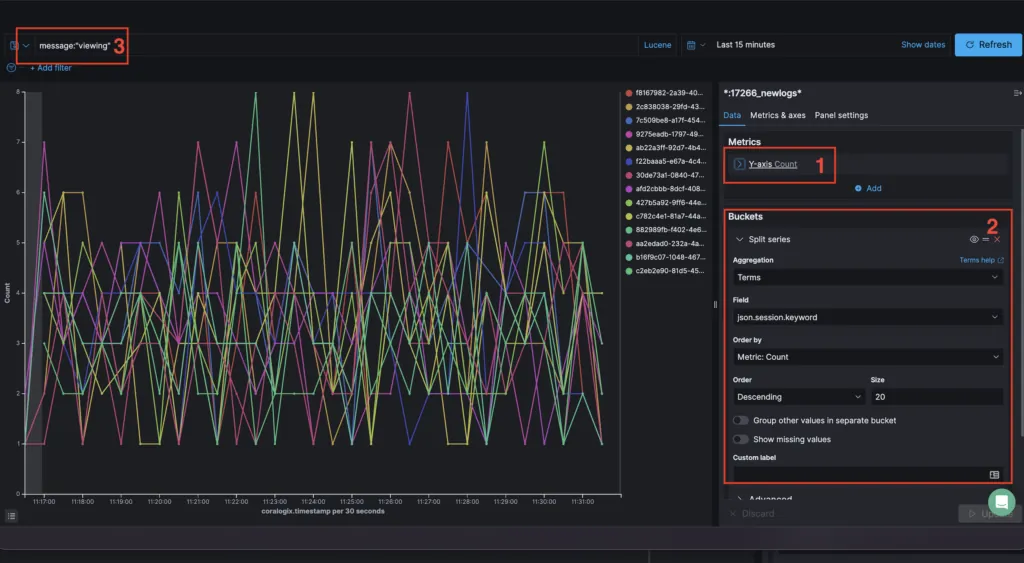
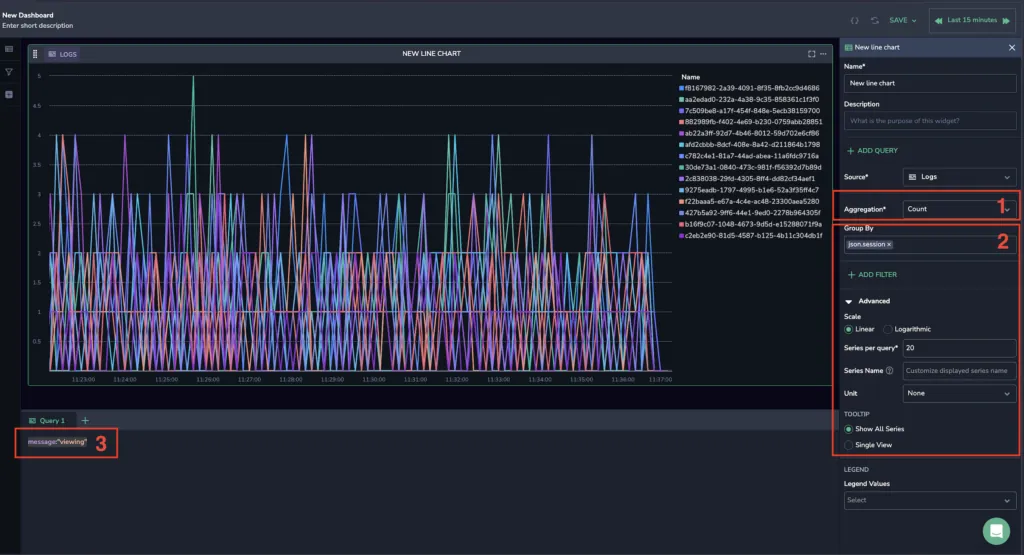
Migrate a [line chart](https://coralogix.com/docs/docs/user-guides/custom-dashboards/widgets/line-charts/.md) from your OpenSearch dashboard to your Coralogix custom dashboard.
### OpenSearch dashboard[](#opensearch-dashboard-1 "Direct link to OpenSearch dashboard")
[](https://coralogix.com/docs/docs/assets/images/Untitled-30-1024x563-562e92ee6eadc5957b5d3aef74fd683c.webp)
### Custom Dashboards[](#custom-dashboards-1 "Direct link to Custom Dashboards")
[](https://coralogix.com/docs/docs/assets/images/Untitled-31-1024x555-d970a655e7a2e4d13142737d14e23d87.webp)
### Migrate parameters[](#migrate-parameters-1 "Direct link to Migrate parameters")
For each section (1, 2, or 3), migrate the parameters from your OpenSearch dashboard to your Coralogix Custom dashboard.
| Section | OpenSearch Dashboard Parameter | Coralogix Custom Dashboard Parameter |
| ------- | ------------------------------ | ------------------------------------ |
| 1 | Y-axis count | Aggregation |
| 2 | Split-series | Group by |
| 2 | Size | Series per query |
| 3 | Lucene query | Query bar |
For example, transfer the Y-axis count values in Section 1 of your OpenSearch Dashboard to the aggregation parameter value in Section 1 of your Coralogix Custom dashboard.
For additional information on line charts, see the full tutorial on [Line Charts in Custom Dashboards](https://coralogix.com/docs/docs/user-guides/custom-dashboards/widgets/line-charts/.md).
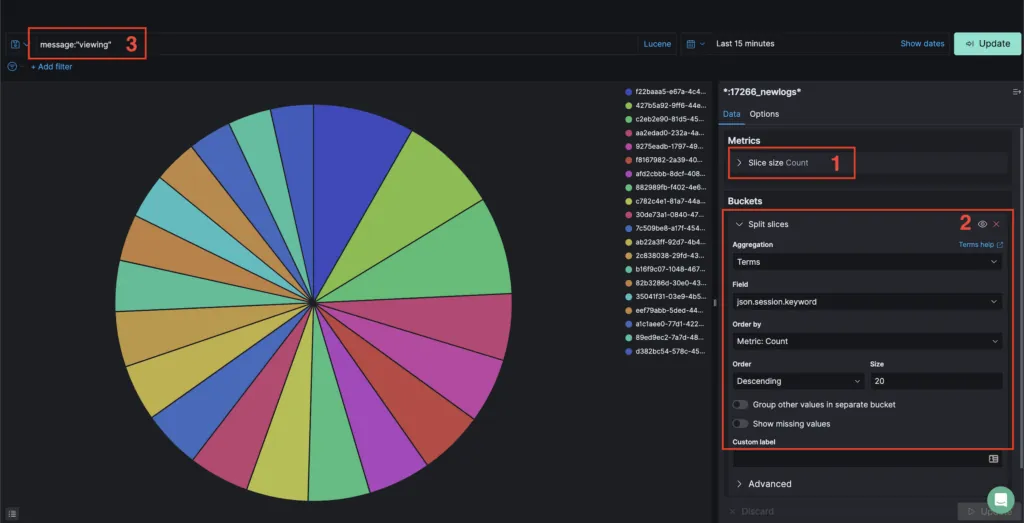
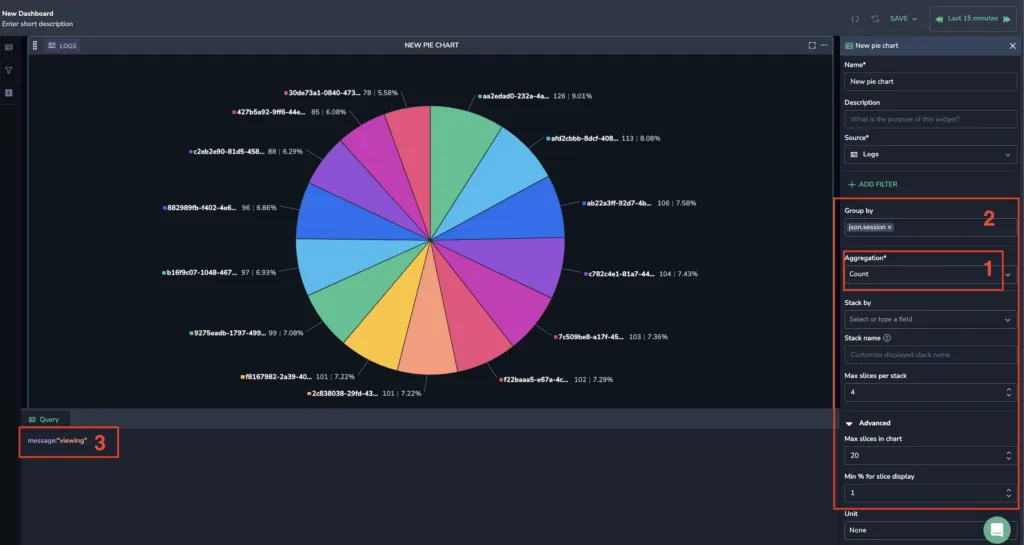
## Pie charts[](#pie-charts "Direct link to Pie charts")
Migrate a [pie chart](https://coralogix.com/docs/docs/user-guides/custom-dashboards/widgets/pie-charts/.md) from your OpenSearch dashboard to your Coralogix Custom dashboard.
### OpenSearch dashboard[](#opensearch-dashboard-2 "Direct link to OpenSearch dashboard")
[](https://coralogix.com/docs/docs/assets/images/Untitled-32-1024x523-ee589b8eb7eac15bfe7d6baec8ac3ebc.webp)
### Custom Dashboards[](#custom-dashboards-2 "Direct link to Custom Dashboards")
[](https://coralogix.com/docs/docs/assets/images/Untitled-33-1024x545-9164399951667079a12e72ae16876b3f.webp)
### Migrate parameters[](#migrate-parameters-2 "Direct link to Migrate parameters")
For each section (1, 2, or 3), migrate the parameters from your OpenSearch dashboard to your Coralogix Custom dashboard.
| Section | OpenSearch Dashboard Parameter | Coralogix Custom Dashboard Parameter |
| ------- | ------------------------------ | ------------------------------------ |
| 1 | Slice size | Aggregation |
| 2 | Split-series field | Group by |
| 2 | Split-series (second level) | Stack by |
| 2 | Size | Max slices in chart (under Advanced) |
| 3 | Lucene query | Query bar |
For example, transfer the slice size value in Section 1 of your OpenSearch dashboard to the aggregation parameter value in Section 1 of your Coralogix Custom dashboard.
For additional information on pie charts, see the full tutorial on [Pie Charts in Custom Dashboards](https://coralogix.com/docs/docs/user-guides/custom-dashboards/widgets/pie-charts/.md).
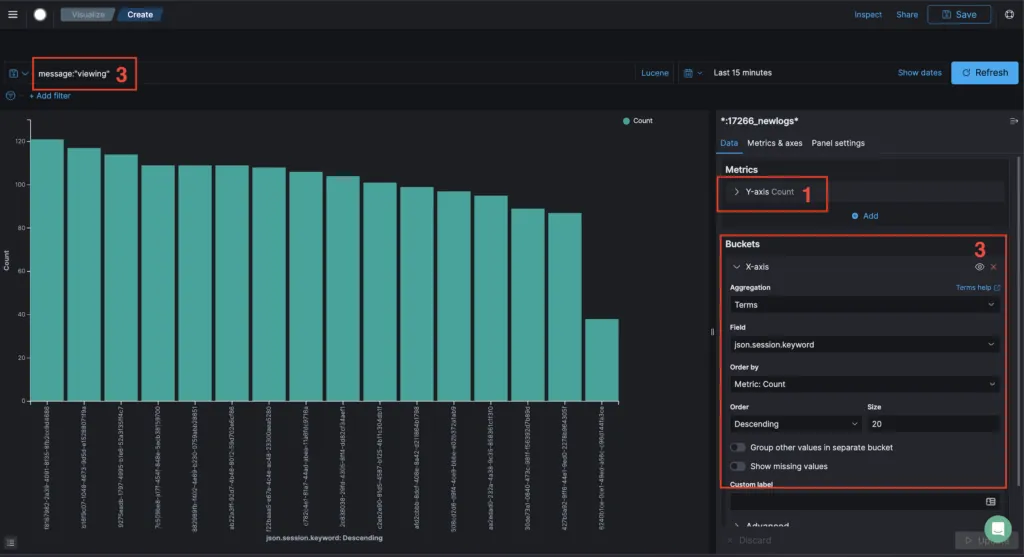
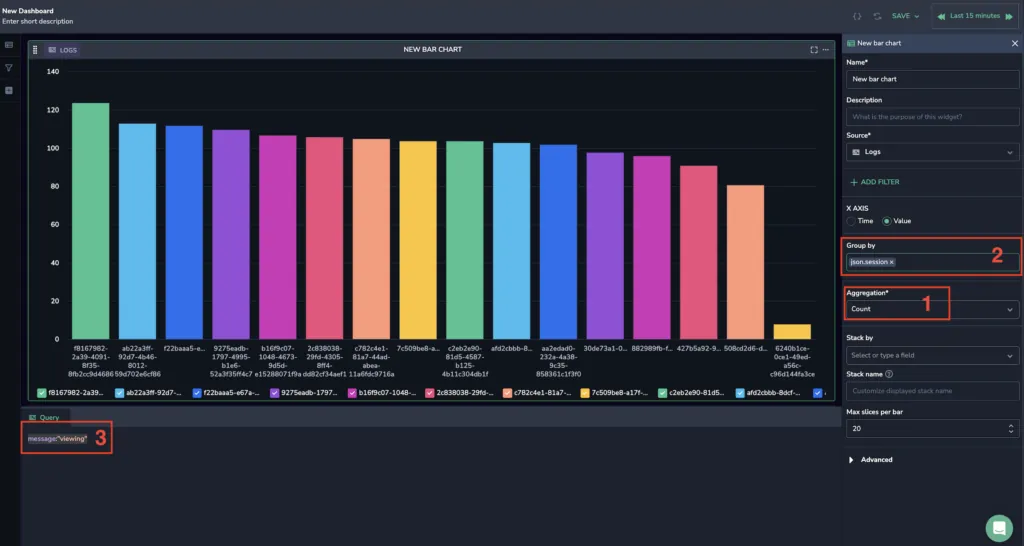
## Bar charts[](#bar-charts "Direct link to Bar charts")
Migrate a [bar chart](https://coralogix.com/docs/docs/user-guides/custom-dashboards/widgets/vertical-bar-charts/.md) from your OpenSearch Dashboard to your Coralogix Custom dashboard.
### OpenSearch dashboard[](#opensearch-dashboard-3 "Direct link to OpenSearch dashboard")
[](https://coralogix.com/docs/docs/assets/images/Untitled-34-1024x557-41a782c6e2b8677872785f883d585f35.webp)
### Custom Dashboards[](#custom-dashboards-3 "Direct link to Custom Dashboards")
[](https://coralogix.com/docs/docs/assets/images/Untitled-35-1024x546-19ca5e4c797624d62994cfb5c7b478e4.webp)
### Migrate parameters[](#migrate-parameters-3 "Direct link to Migrate parameters")
For each section (1, 2, or 3), migrate the parameters from your OpenSearch dashboard to your Coralogix Custom dashboard.
| Section | OpenSearch Dashboard Parameter | Coralogix Custom Dashboard Parameter | Notes |
| ------- | ------------------------------ | ------------------------------------ | -------------------------------------------------------------------------------------------------------------------------------------------------------- |
| 1 | Y-axis count | Aggregation | |
| 2 | Split-series field | Group by | If you apply the X-axis in OpenSearch Dashboard with a date histogram, you should choose X-axis as Time in Custom Dashboards (above the Group by field). |
| 2 | Size | Max bars per chart (under Advanced) | |
| 2 | Split-series (second level) | Stack by | |
| 3 | Lucene query | Query bar | |
For example, transfer the Y-axis Count value in Section 1 of your OpenSearch dashboard to the aggregation parameter value in Section 1 of your Coralogix Custom dashboard.
For additional information on bar charts, see the full tutorial on [Bar Charts in Custom Dashboards](https://coralogix.com/docs/docs/user-guides/custom-dashboards/widgets/vertical-bar-charts/.md).
## Gauges[](#gauges "Direct link to Gauges")
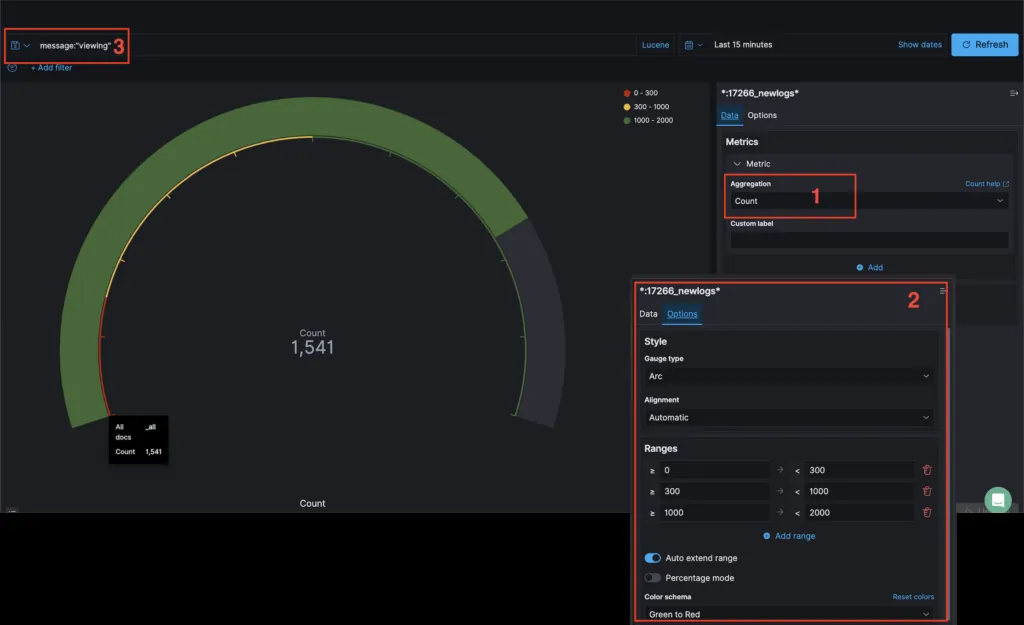
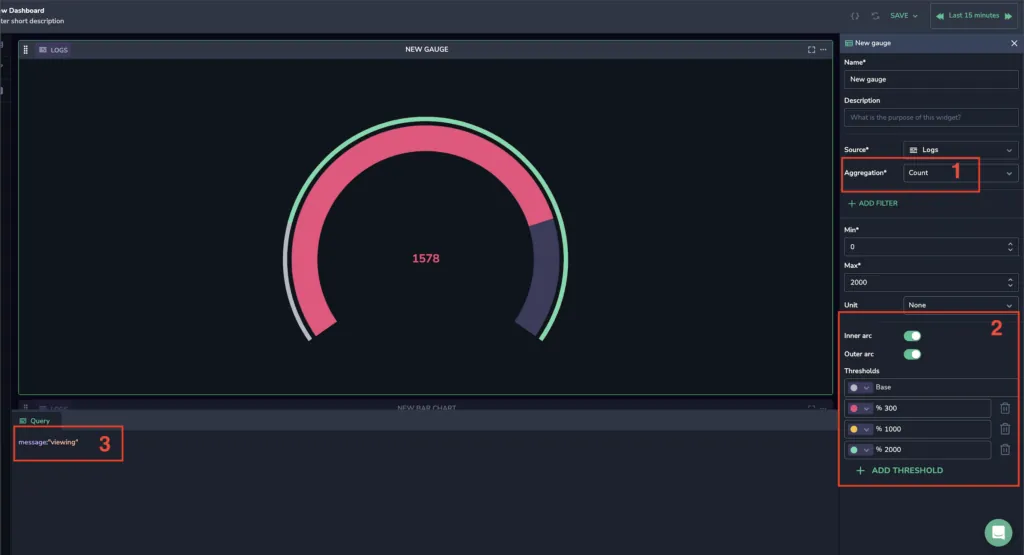
Migrate a [gauge](https://coralogix.com/docs/docs/user-guides/custom-dashboards/widgets/gauges/basic-gauges/.md) from your OpenSearch dashboard to your Coralogix Custom dashboard.
### OpenDashboard[](#opendashboard "Direct link to OpenDashboard")
[](https://coralogix.com/docs/docs/assets/images/Untitled-36-1024x625-b1409716e730c9017749b89013570324.webp)
### CustomDashboards[](#customdashboards "Direct link to CustomDashboards")
[](https://coralogix.com/docs/docs/assets/images/Untitled-37-1024x555-109ca87ad6bd515eb41cb4bb388ac00c.webp)
### Migrate parameters[](#migrate-parameters-4 "Direct link to Migrate parameters")
For each section (1, 2, or 3), migrate the parameters from your OpenSearch dashboard to your Coralogix Custom dashboard.
| Section | OpenSearch Dashboard Parameter | Coralogix Custom Dashboard Parameter |
| ------- | ------------------------------ | ------------------------------------ |
| 1 | Aggregation | Aggregation |
| 2 | Gauge Ranges | Thresholds |
| 2 | Arc settings | Arc settings |
| 3 | Lucene query | Query bar |
For example, transfer the aggregation value in Section 1 of your OpenSearch Dashboard to the aggregation parameter value in Section 1 of your Coralogix Custom dashboard.
For additional information on gauges, see the full tutorial on [Gauges in Custom Dashboards](https://coralogix.com/docs/docs/user-guides/custom-dashboards/widgets/gauges/basic-gauges/.md).
## Additional resources[](#additional-resources "Direct link to Additional resources")
| | |
| ------------- | ------------------------------------------------------------------------------------------------------------------------------------------------------------------------------------------------------------------------------------------------------------------------------------------------------------------------------------------------------------------------------------------------------------------------------------------------------------------------------------------------------------------------------------------------------------------------------------------------------------------------------------------------------------- |
| Documentation | [Custom Dashboards](https://coralogix.com/docs/docs/user-guides/custom-dashboards/introduction/.md)
[Line Charts](https://coralogix.com/docs/docs/user-guides/custom-dashboards/widgets/line-charts/.md)
[Data Tables](https://coralogix.com/docs/docs/user-guides/custom-dashboards/widgets/data-tables/.md)
[Gauges](https://coralogix.com/docs/docs/user-guides/custom-dashboards/widgets/gauges/basic-gauges/.md)
[Pie Charts](https://coralogix.com/docs/docs/user-guides/custom-dashboards/widgets/pie-charts/.md)
[Bar Charts](https://coralogix.com/docs/docs/user-guides/custom-dashboards/widgets/vertical-bar-charts/.md) |
## Next steps[](#next-steps "Direct link to Next steps")
Learn how to [visualize multiple queries in Custom Dashboards](https://coralogix.com/docs/docs/user-guides/custom-dashboards/tutorials/multiple-queries-in-custom-dashboards/.md).