Pipeline Analyzer
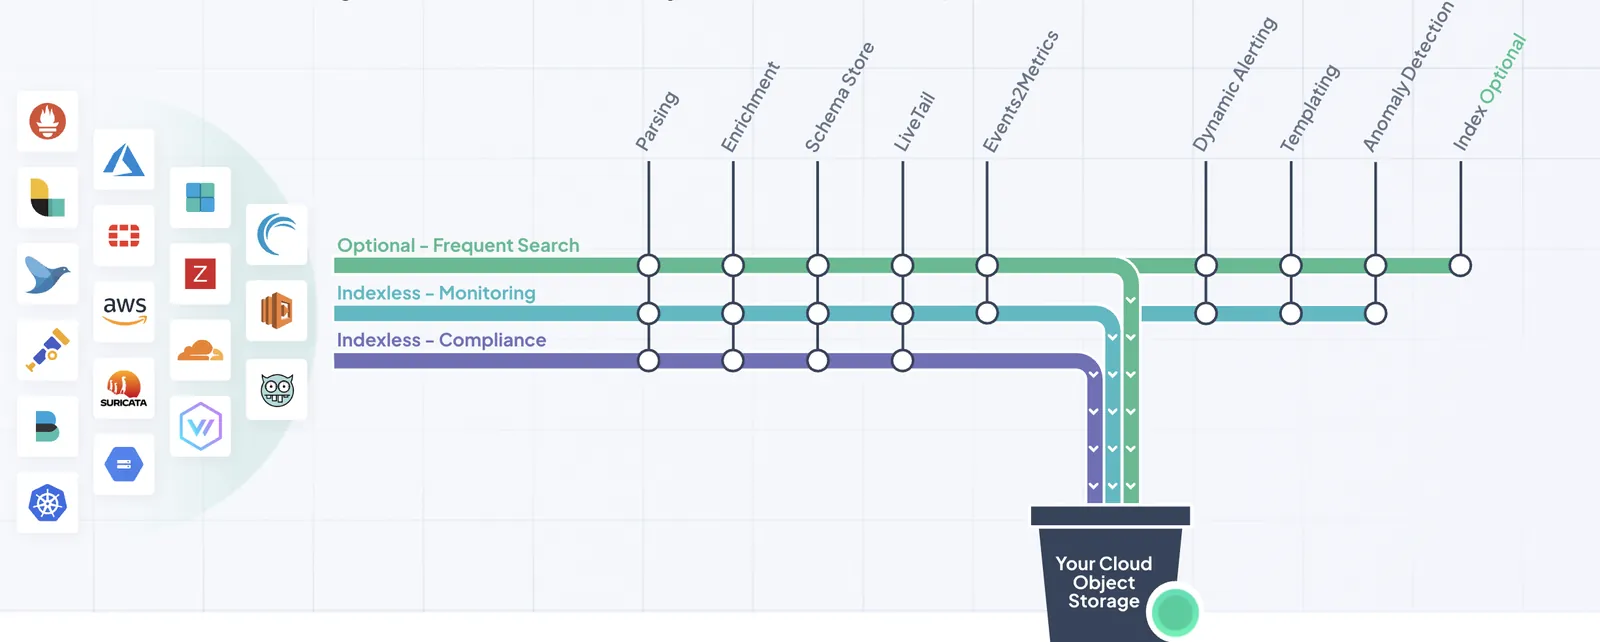
In complex environments, logs often flow from multiple services, teams, and infrastructure. To handle this scale, many teams create customized processing pipelines—for security, compliance, observability, and more. These pipelines parse, enrich, and route logs based on TCO policies, enabling advanced monitoring and faster issue resolution.
But as environments grow, pipelines multiply, and misconfigurations, conflicting rules, or visibility gaps can lead to incorrect parsing, broken dashboards, and monitoring failures.
The Pipeline Analyzer is a no-code tool designed to solve these challenges. Use it to inspect logs in real time as they move through your pipelines, providing complete transparency into parsing, enrichment, and routing behavior.
With the Analyzer, teams can trace log processing flows in order to:
- Visualize the full processing flow of logs on demand.
- Compare raw and modified logs.
- Troubleshoot pipeline behavior with pinpoint accuracy.
How it works
As your logs enter Coralogix, they pass through multiple stages, including:
- Parsing rules to extract structure
- Enrichments to add context
- TCO pipelines to optimize and route
At present, Pipeline Analyzer visualizes the parsing rule pipeline.
Start using Pipeline Analyzer
To get started, navigate to Data Flow, then Pipeline Analyzer.
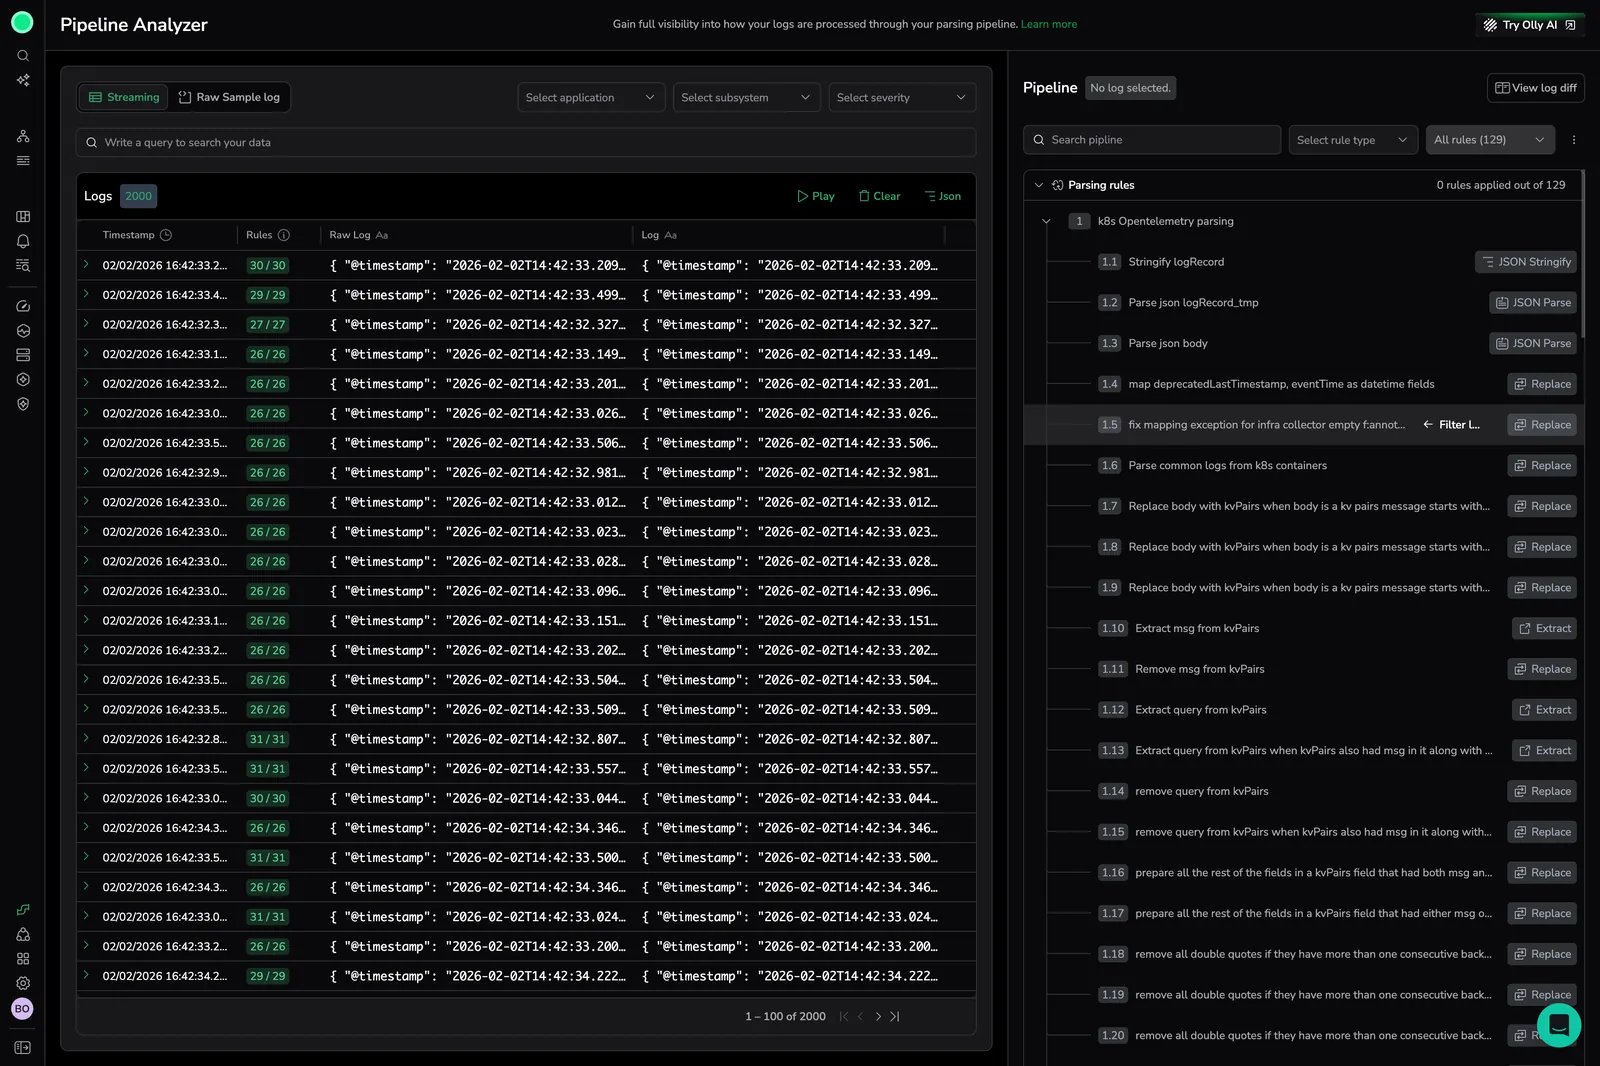
Capture and filter logs on demand
Use filters to capture only logs that match your criteria:
applicationsubsystemseverityregex
Only those logs meeting your filter criteria are streamed.
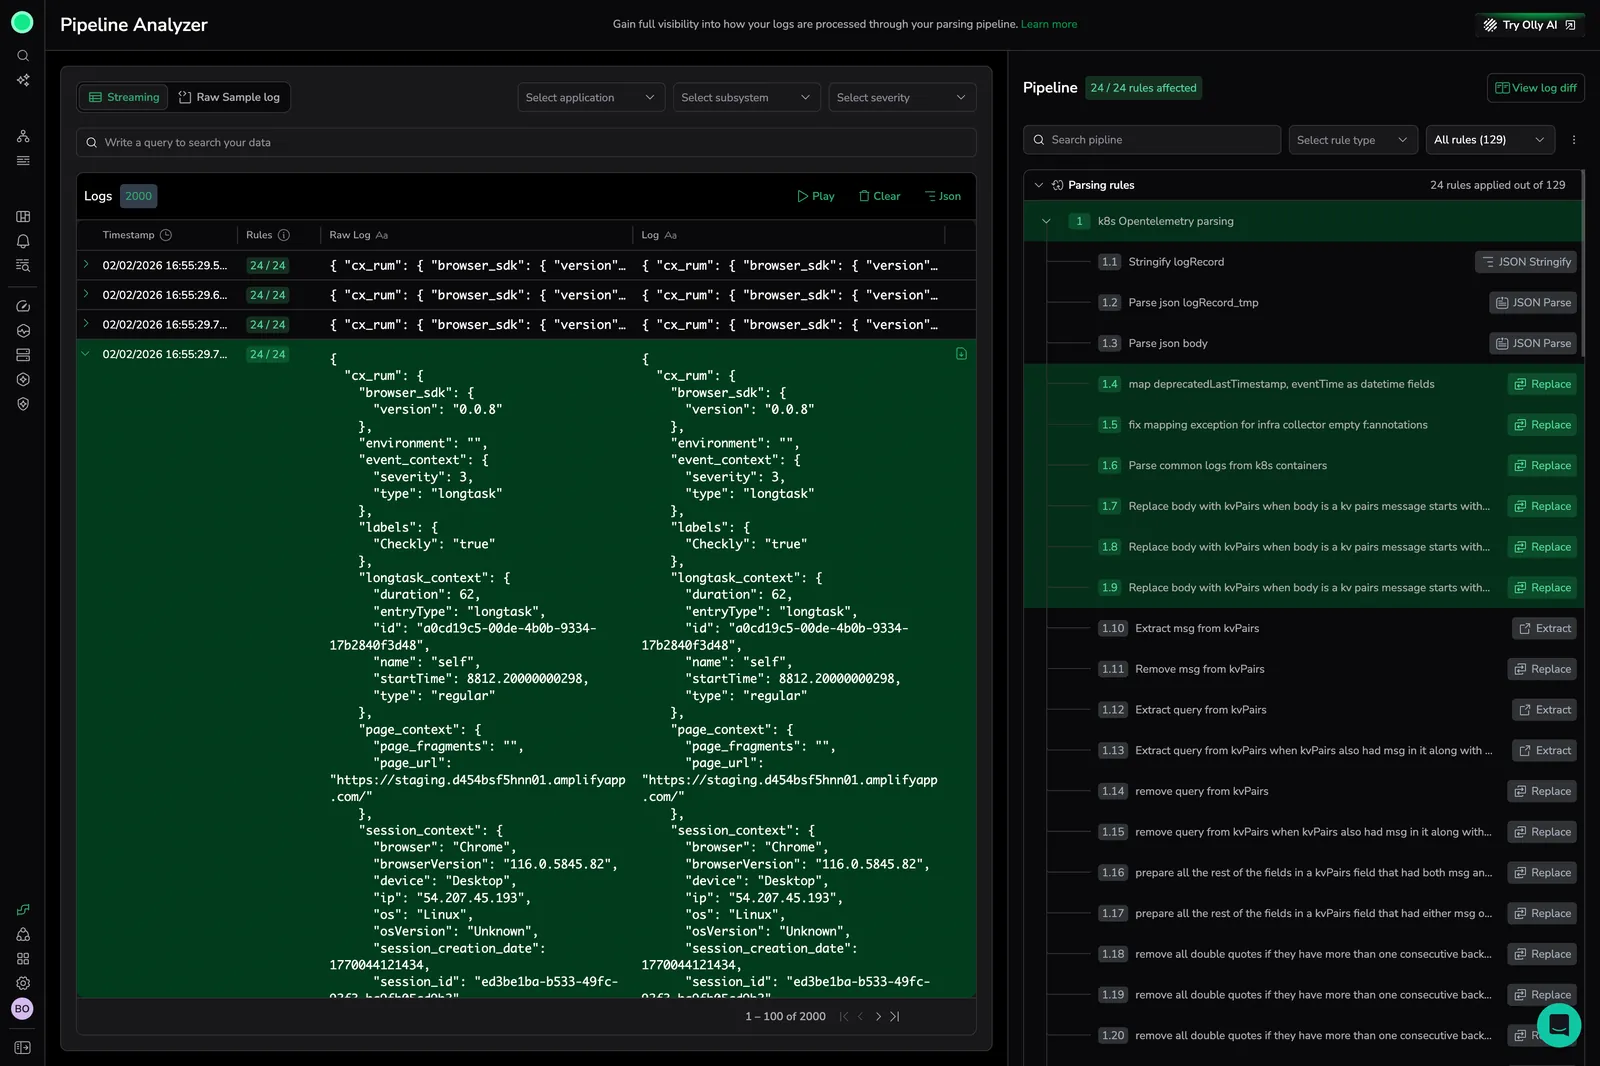
Inspect real-time log processing
Watch logs as they’re ingested and see which parsing rules ran and how they affected the log.
Select Play to start streaming logs in real-time.
As logs appear in the stream, each entry shows:
- Timestamp
- Rules summary (applied rules)
- Raw log content
- Ingested log (after parsing)
Use Pause or Clear to stop or reset the stream.
Simulate parsing with raw logs
Double-click a log entry or select the arrow (▶) to view its raw and modified versions. This gives you a detailed view of how the log changes at each processing stage.
Paste a raw log sample into the Analyzer to test parsing behavior.
Hover over any ingested log to download the raw version.
To download the raw version of an ingested log, hover over the log entry and select Download.
View applied rules
Select one or more logs to view their applicable rules in the right-hand panel.
The parsing rule panel displays:
- All applicable rule groups
- The specific rules within each group
- The order of execution
- The option to Show only applied rules
Use the Drawer toggle to expand or collapse the Rule Panel.
Step through rules in Sample Log mode
Sample Log mode uses the same side-by-side diff component as the main Analyzer view. Paste a raw log, run the pipeline, and step through each rule to see exactly how it transforms the log — the same experience available for streaming and ingested logs.
Run a sample log through the pipeline
- Open Pipeline Analyzer and switch to Sample Log.
- Set the log context. Application, Subsystem, and Severity are required. Select Add labels to include optional Class, Category, Method, or Thread ID values.
- Paste a raw log into the Sample log editor. The editor accepts plain text or JSON.
- Select Analyze pipeline to simulate the log as it moves through your parsing rule pipeline.
Coralogix runs the sample log through the same rule pipeline applied to live traffic and renders the before and after state side by side.
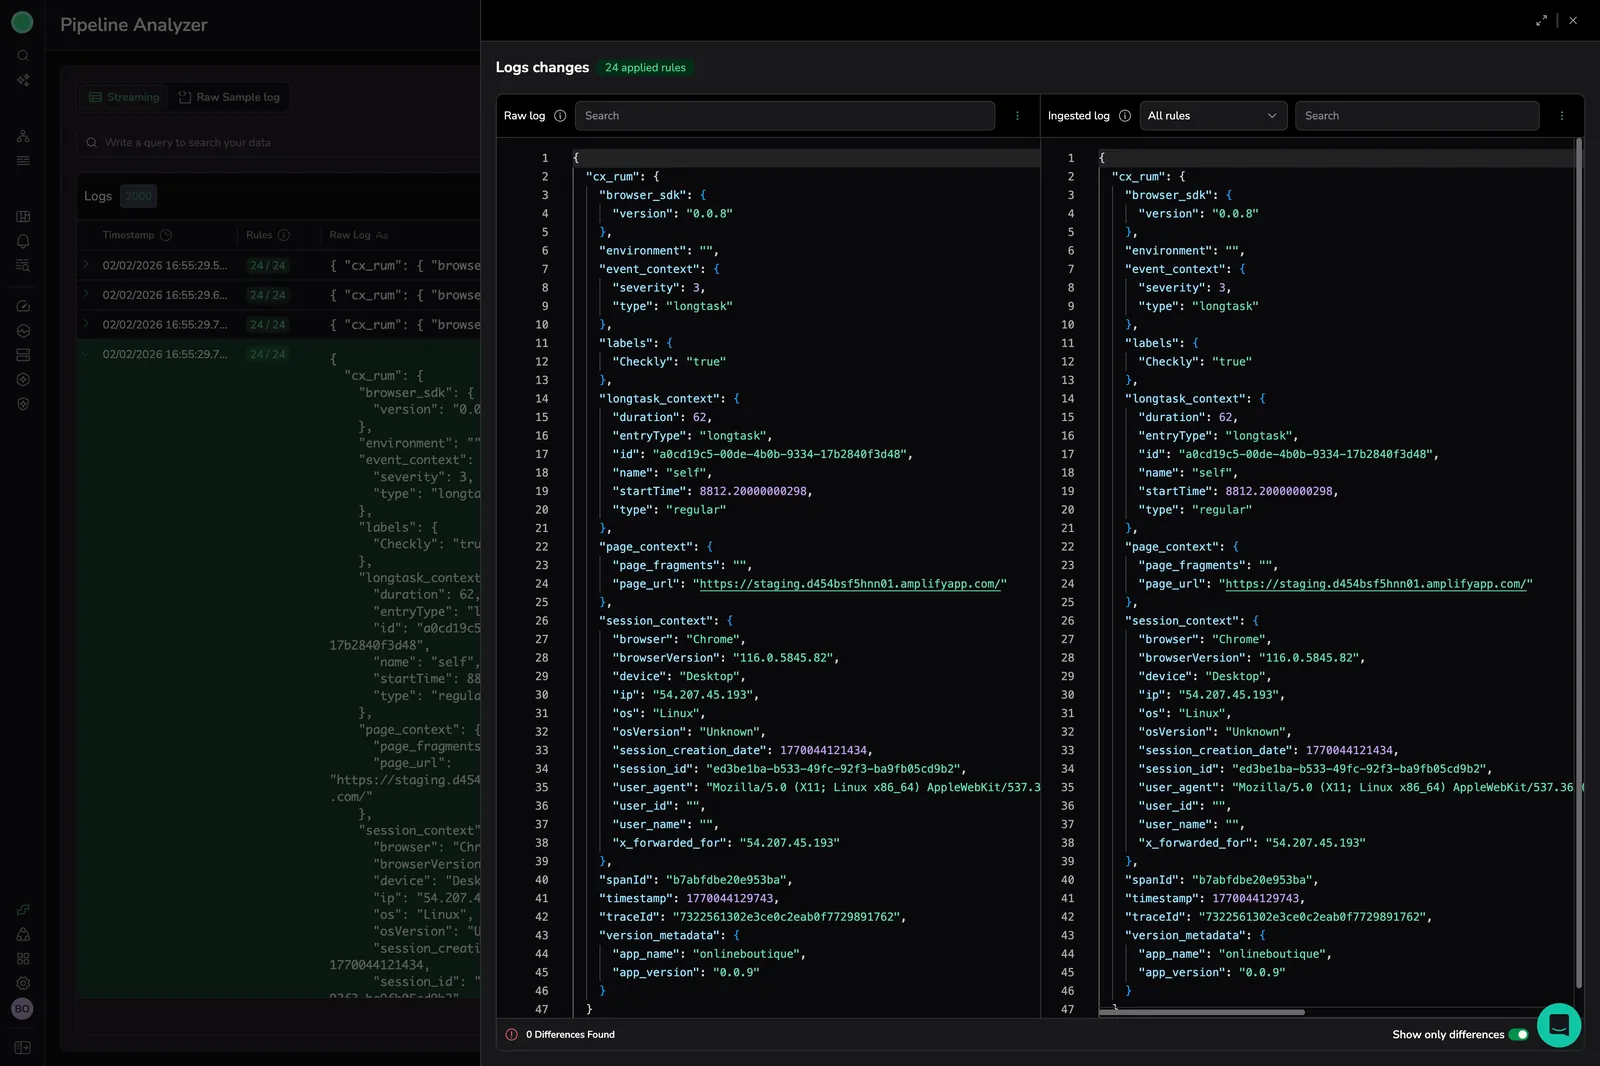
Compare the full pipeline
The diff view opens with All rules selected by default, showing the raw sample log on the left and the fully processed log on the right.
- Added, removed, and modified fields are highlighted inline.
- Use and to jump between changes.
- Toggle Show only differences to hide lines that were unchanged by the pipeline.
Step through individual rules
Use the Applied rules selector in the right panel to isolate a single rule:
- Select a rule from the Applied rules list.
- The left pane updates to the log state before that rule runs, and the right pane shows the state after the rule runs.
- Select another rule to move the comparison forward or backward one step at a time.
Switch back to All rules at any time to return to the full pipeline view.
Edit and rerun
You can edit the sample log, change labels, or adjust filters and rerun Analyze pipeline at any time. Pipeline Analyzer preserves your last-selected rule and the Show only differences toggle state between runs, so you can iterate on a log without losing context.
If the analyzer cannot parse the input — for example, when the log is malformed JSON — the diff view displays an inline error and keeps the sample editor intact so you can correct the input and retry.
Compare raw and parsed logs
Use Compare mode to see how parsing rules transform your logs. The view displays the raw log alongside the ingested log, allowing you to identify the changes that occurred during processing quickly.
View logs side by side
Compare mode opens a split view:
- The left panel shows the raw log exactly as it was received.
- The right panel shows the ingested log after parsing rules are applied.
Use this view to trace changes and confirm that your parsing rules work as intended.
Identify changes
Compare mode highlights differences between the two versions of the log so you can:
- Move between rules using and .
- Track added, removed, or modified fields and values.
- Verify how specific rules affected log content.
- Detect unexpected transformations or missing data.
Once you select a log, you can view all changes or focus on a specific rule group. To reduce noise, switch the rules view to Effective rules to focus on rules that changed the log.
Inspect rule-level transformations
To analyze rule-level changes:
- The left panel shows the log input before the rule is applied.
- The right panel displays the log output after the rule has run.
This comparison helps you validate parsing logic, troubleshoot issues, and confirm that rule order and behavior match your expectations.
Troubleshoot parsing and rule behavior
Using the Analyzer, you can instantly identify:
- Which pipelines and rules modified a specific log.
- Logs affected by a particular rule.
- How a specific rule changes a log.
- Parsing issues caused by overlapping rules or incorrect configurations.
Permissions
To use the Pipeline Analyzer, users need the following permission:
| Resource | Action | Description |
|---|---|---|
Analyzer | Read | View Pipeline Analyzer |
See the full guide on roles and permissions.
Limitations
- Logs are not saved after you leave the page
- Each session is limited to 2,000 logs or 10 minutes—whichever comes first
- Currently supports parsing rules only (TCO and enrichment visibility coming soon)