Stream aggregation
Use Stream Aggregation to aggregate metrics at ingest time, before storage.
Use Stream Aggregation to make high-cardinality metrics usable and reliable at query time, especially when recording rules and if needed, queries cannot scale due to scan and evaluation limits.
By default, Stream Aggregation does not reduce cost. Both the raw metric and the aggregated metric are stored. Reduce storage and query cost only when you explicitly block the raw metric and keep only the aggregated output.
Use Stream Aggregation when raw metrics generate large numbers of unique label combinations that you do not need to store or query individually.
What you need
- To view streaming aggregation rules, you need
STREAMING-AGGREGATIONS:READCONFIG(Data Admin, Observability Lead, Platform Admin, Read-Only User). - To create or delete streaming aggregation rules, you need
STREAMING-AGGREGATIONS:UPDATECONFIG(Data Admin, Observability Lead, Platform Admin).
Why stream aggregation matters
High-cardinality metrics introduce operational challenges:
- Queries and recording rules scan and evaluation limits
- Aggregations become slow or fail to run
- Dashboards and alerts become unreliable under load
Stream Aggregation addresses this by processing metrics in the ingestion path and producing a smaller, stable set of aggregated time series.
This allows you to:
- Avoid creating large numbers of recording rules
- Bypass query scan limits for complex aggregations
- Make high-cardinality data usable for dashboards and alerts
Cost reduction is possible only when Stream Aggregation is combined with blocking the raw metric.
How stream aggregation differs from recording rules
Stream Aggregation processes metrics during ingestion. Recording rules process metrics after storage.
With Stream Aggregation:
- Aggregation happens once, at ingest time
- Queries run on already-aggregated data
- High-cardinality input does not impact query evaluation
With recording rules:
- Raw samples are stored first
- Each rule must scan all matching series
- High-cardinality metrics can cause rule failures
Select Stream Aggregation when query limits or cardinality make recording rules impractical.
Select recording rules when you need access to raw metrics or historical recomputation.
Understand the stream aggregation data flow
Stream Aggregation runs inside the ingestion pipeline.
End-to-end data flow
- Metrics arrive at the ingestion layer
- The system checks whether the metric matches a Stream Aggregation rule
- If a rule matches, the system sends the samples to the streaming aggregation pipeline
- The pipeline applies filters, grouping, and aggregation functions
- The pipeline produces new aggregated metric samples
- The system sends aggregated samples to the standard metrics pipeline
Understand aggregation functions and time windows
Use aggregation functions to define how incoming samples are combined. Use the time window settings to define how often results are emitted and how much historical data is included.
| Aggregation function | How it aggregates data | Evaluation and Lookback behavior | Typical use |
|---|---|---|---|
| Sum | Adds all sample values in the aggregation window | Uses the configured Lookback interval and emits results every Evaluation interval | Total volume, such as requests or bytes |
| Avg | Calculates the average of all sample values in the aggregation window | Uses the configured Lookback interval and emits results every Evaluation interval | Typical behavior, such as average latency |
| Min | Emits the smallest value observed in the aggregation window | Uses the configured Lookback interval and emits results every Evaluation interval | Lower bounds and best-case performance |
| Max | Emits the largest value observed in the aggregation window | Uses the configured Lookback interval and emits results every Evaluation interval | Spikes and outliers |
| Count | Emits the number of samples in the aggregation window | Uses the configured Lookback interval and emits results every Evaluation interval | Event frequency and rate analysis |
| Sum counter | Aggregates counter increases across samples | Does not follow the same Evaluation and Lookback behavior as the other functions | Counter-type metrics where increments matter |
How the time windows work
Stream Aggregation uses 2 time settings to control how data is aggregated.
Evaluation interval
Defines how often the system emits aggregated results.
Lookback interval
Defines how much historical data each evaluation includes.
Example
- Lookback: 5 minutes
- Evaluation: 1 minute
Every minute, the system aggregates the last 5 minutes of data and writes a new result.
To create tumbling behavior, set the Lookback interval equal to the Evaluation interval.
This Evaluation and Lookback configuration applies to all aggregation functions except Sum counter.
Understand rule lifecycle and immutability
Stream Aggregation rules follow a strict lifecycle:
- Rules are created in an enabled state
- Once you disable a rule, it cannot be enabled again
Disabling a rule permanently stops aggregation and prevents accidental reactivation of incorrect or costly configurations. Create a new rule if you need to restart aggregation with changes.
Open stream aggregation
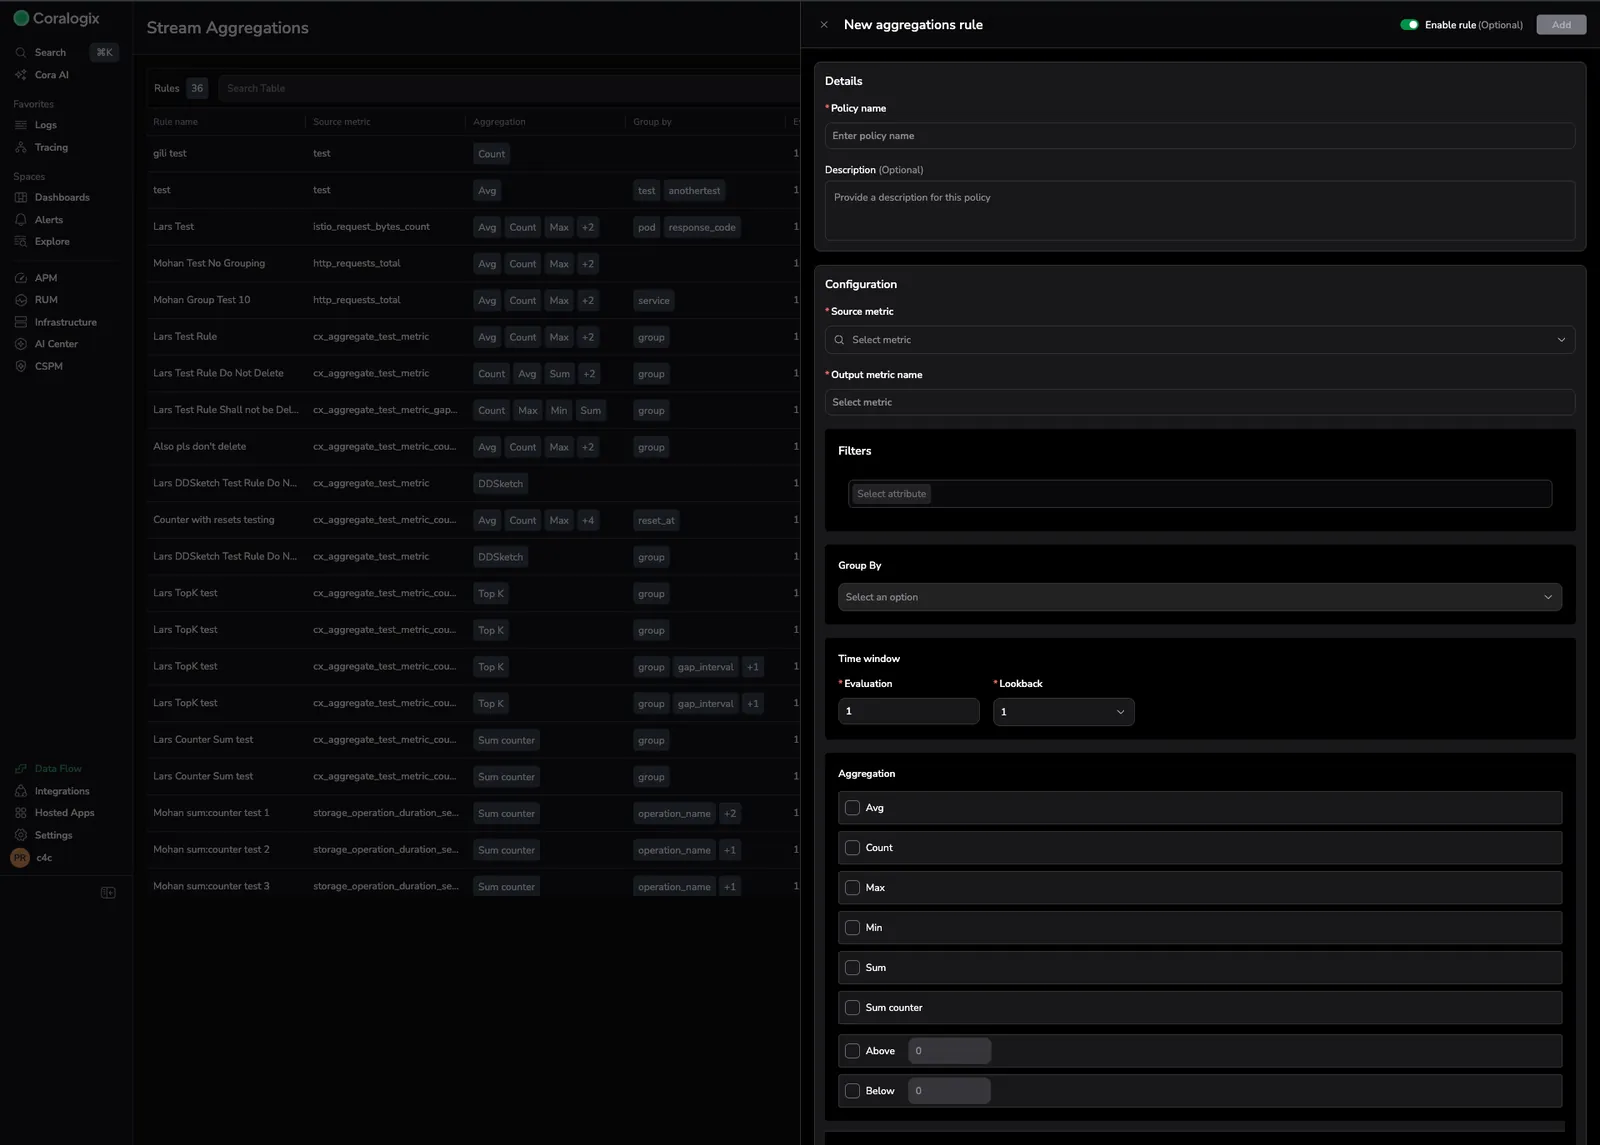
Manage Stream Aggregation from the Data Flow area.
- Go to Data Flow
- Under Metrics, select Stream Aggregation
The Stream Aggregations page lists all rules, their configuration, and their current state.
Create a stream aggregation rule
- Select Add new rule
- In Policy name, enter a descriptive name
- (Optional) In Description, describe the purpose of the rule
- In Source metric, select the metric you want to aggregate
- In Output metric name, enter the name for the aggregated metric
- (Optional) In Filters, add attributes to limit which series the rule processes
- In Group by, select the labels you want to retain in the output
- In Time window, set:
- Evaluation
- Lookback
- In Aggregation, select 1 or more aggregation functions
- Select Add
The system creates the rule in a disabled state.
Disable a stream aggregation rule
- Open the rule
- Toggle Enable rule off
Once disabled, the rule cannot be enabled again. The system retains the rule for audit and reference but no longer processes data.
Create a new rule if you need to resume aggregation.
Control cardinality with group by
The Group by setting determines which labels remain in the output metrics.
- The system drops all labels that you do not include
- Each unique combination of retained labels creates 1 output series
Use the smallest set of labels that still answers your monitoring questions.
Understand output metrics
Define the output metric name when you create a Stream Aggregation rule.
The system no longer enforces a fixed naming pattern. The name you enter in Output metric name becomes the stored metric name.
Each aggregated metric includes the label:
cx_source="stream_aggr"
Use this label to identify metrics generated by Stream Aggregation.
Know current limitations
Stream Aggregation has known limitations:
- No deduplication of incoming samples
- Possible double counting in high-availability setups
- No historical backfill
- Lookback limited to 5 minutes
- Accuracy target of 99 %
Use Stream Aggregation for trend detection and operational monitoring rather than exact billing or compliance use cases.
Avoid common mistakes
Design Stream Aggregation rules carefully to prevent incorrect results, unstable queries, or unnecessary cost.
-
Including unnecessary labels in Group by
Keeping labels that you do not need increases output cardinality and reduces the benefit of aggregation. Only retain labels that are required for analysis or alerting.
-
Using long lookbacks with short evaluation intervals when you expect tumbling behavior
This configuration produces overlapping windows rather than discrete time buckets. If you need tumbling aggregation, set the Lookback interval equal to the Evaluation interval.
-
Disabling a rule expecting to reenable it later
Once disabled, a rule cannot be enabled again. Create a new rule if you need to change or restart aggregation.
Plan rules carefully before enabling them.