Highlights tab
Highlights breaks your spans down by field so you can spot which services, endpoints, or status codes are driving a spike before you read a single trace. In Explore, Highlights is a dedicated tab in the query results panel—your time range, filters, and query builder stay live as you switch into it.
Use Highlights when you need to answer "what changed?" or "where is the latency coming from?" without leaving Explore. Turn on Compare to previous period to overlay a second time window and surface regressions side by side—useful any time you need to ask "is this new or recurring?".
Highlights gives you three things:
- Flexible investigation paths. Start in Explore and move into Highlights with your filters and time picker in sync—then take what you find in Highlights straight back to Explore to drill into the relevant spans.
- Advanced filtering, sorting, and interactive comparison. Filter and sort the field distribution, and compare across custom periods—the previous period, previous day, last 7 days, or any custom range set from the filters or directly on the graph.
- Accurate data, not estimates. Highlights queries your spans through DataPrime and reports both percentages and exact counts, so you see the real number of spans and fields for each period. It scans the full span dataset and returns the field distribution from it—not a sampled approximation capped at a few thousand spans.
Open the Highlights tab
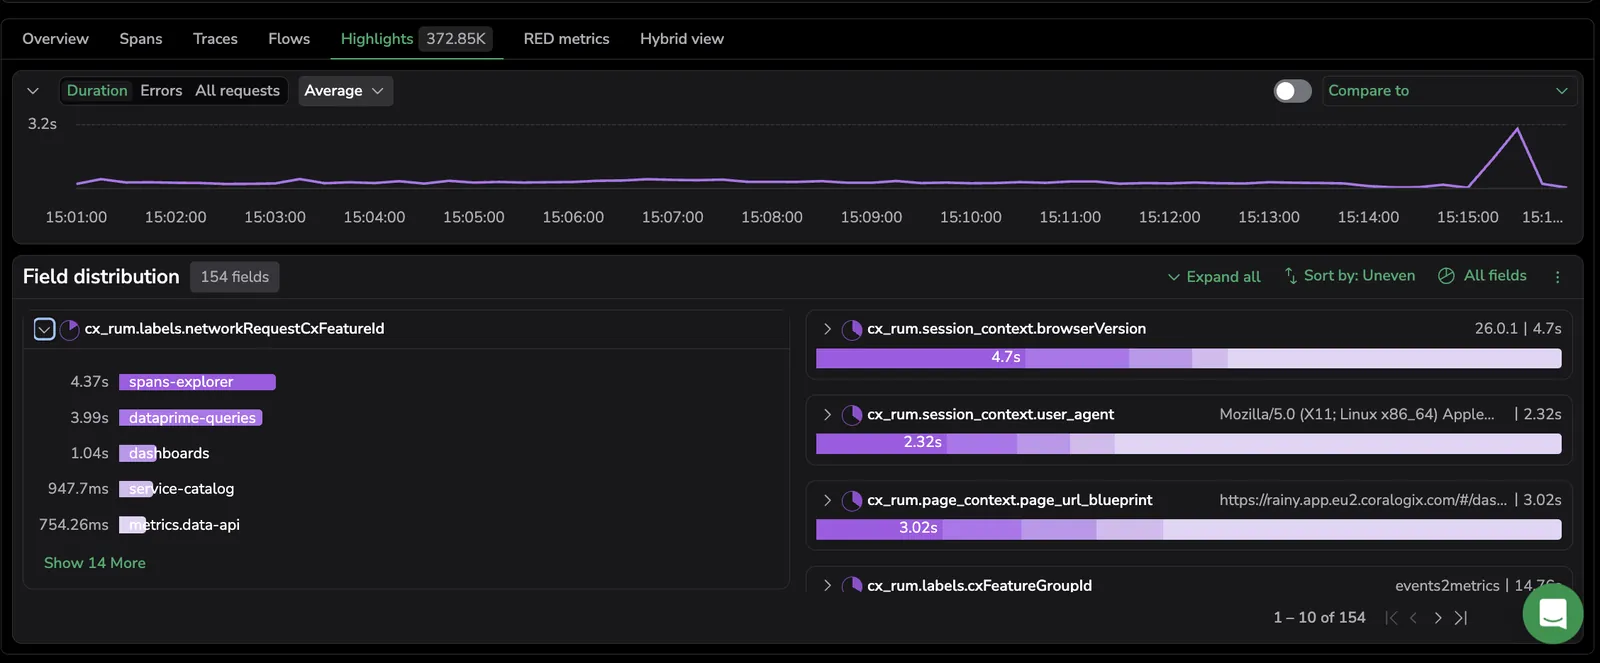
In Explore, run a query against the spans dataset, then select Highlights in the results panel—next to Overview, Spans, Traces, Flows, and Signals. The tab label shows the number of spans matching your active query (for example, Highlights 25k spans).
Highlights inherits the active time range, filters, search, and Group by from the query builder. Changing any of these in the builder updates the Highlights tab in place.
Coralogix remembers the last view and configuration you used. The next time you open the Highlights tab in the same workspace, your view, comparison toggle, sort, and field selections are restored.
Choose a view
Three sub-tabs sit at the top of the Highlights panel. Switch between them to control what the graph and field distribution show.
| View | What it shows |
|---|---|
| Duration | Latency over time for the matching spans, with a configurable aggregation. Best for triaging "why is this slow?". |
| Errors | Error span count over time. Best for finding which fields are driving an error spike. |
| All requests | Span count over time. Best for spotting traffic shifts. |
Use Errors during an incident, Duration for performance investigations, and All requests for traffic analysis.
Each view has its own saved configuration—aggregation, sort, comparison toggle—so switching between them doesn't reset what you set up.
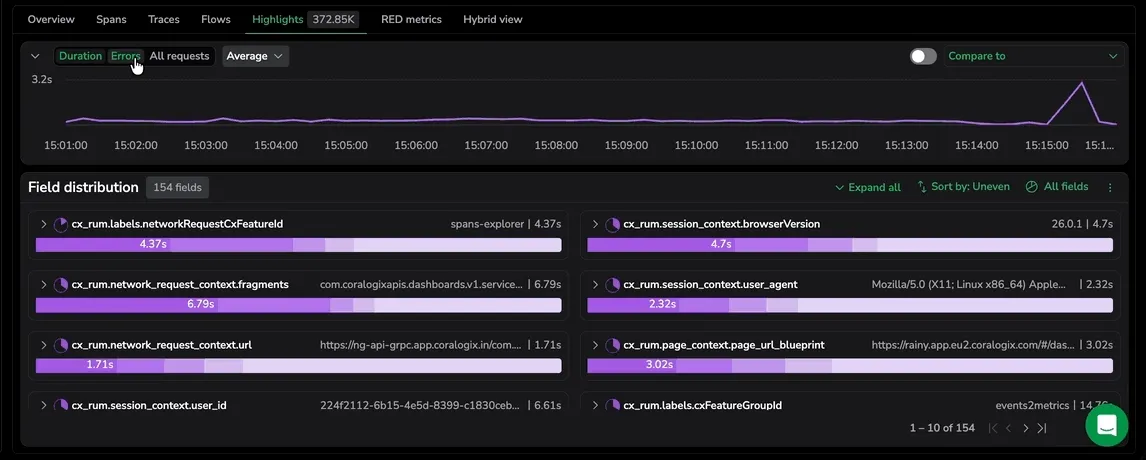
The Highlights graph
The graph at the top of the tab plots the active view's metric over your selected time range.
- Duration view: y-axis is duration. Use the aggregation dropdown above the graph to switch between Average (default), Max, Min, P99, P95, P50.
- Errors view: y-axis is error count.
- All requests view: y-axis is span count.
Graph interactions:
- Drag across a time window to zoom. Zooming updates the Explore time range, so the rest of the page follows.
- Select a data point to open the graph action menu and choose Include in query to add the value as a builder filter.
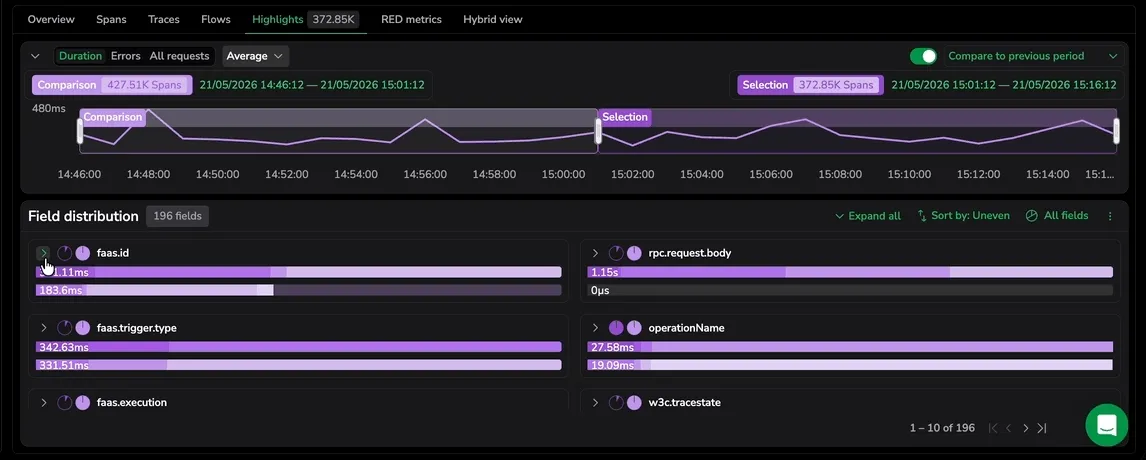
Compare to previous period
Toggle Compare to previous period at the top right of the Highlights panel to overlay a second time window on top of your selection. The compared range is aligned to the active Explore time range and updates whenever you change the time picker.
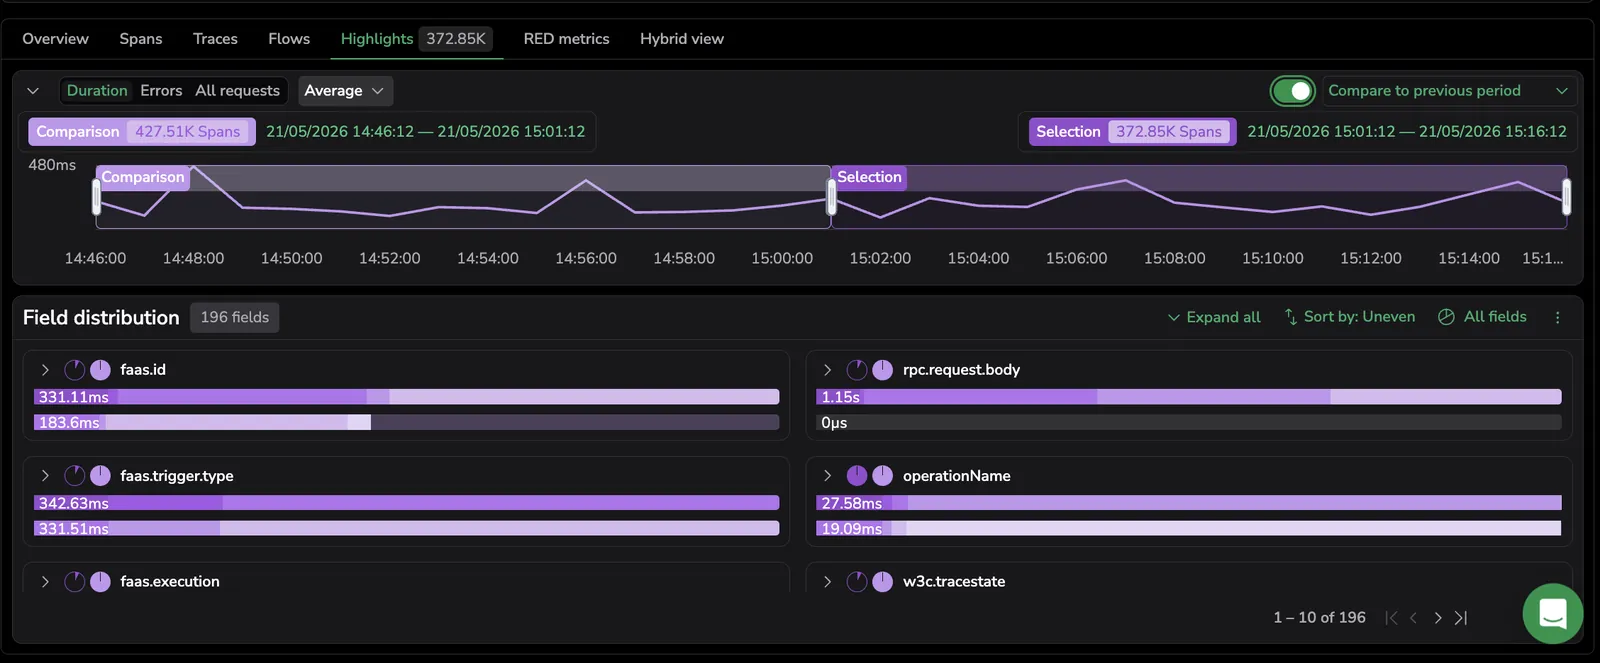
When the toggle is on, two chips appear above the graph:
- Selection: the current Explore time range and its span count.
- Comparison: the comparison range and its span count.
The graph renders both periods side by side, and the field distribution adds a Diff column to rank field values by how much they changed between the two periods—the most changed values appear first, making regressions immediately visible. Use this to confirm whether an error spike or latency shift is recurring or new.
Comparison options (from the dropdown next to the toggle):
- Compare to previous period (default) — the same length of time immediately before your selection.
- Compare to previous day.
- Compare to previous 7 days.
Field distribution
Below the graph, the Field distribution panel breaks the matching spans down by field—service.name, http.route, region, version, or any other indexed tag. Each card shows:
- The field name and the list of top values.
- A horizontal bar per value with the percentage of spans containing that value.
- A Diff column when Compare to previous period is on, ranking values by how much each changed between the two periods.
- Hover any value to see the exact span count.
Above the cards you can:
- Search fields: type a substring in the panel header to filter the field-distribution cards by field name. Matching is case-insensitive and applies across all paginated pages, so a match outside the current page still surfaces. The field count next to the panel header updates to the filtered total. The filter persists when you switch view (All requests, Errors, Duration), and in compare mode it filters both sides of the comparison together.
- Search tag or value: filter the cards to a specific field or value.
- Sort by: choose how cards are ordered:
- Uneven spread (default) — fields dominated by a single value first. Surfaces likely culprits during a spike.
- Even spread: fields whose values are balanced. Helps rule out non-differentiators.
- Field name A–Z / Z–A: alphabetical, useful when you know the field you want.
- All fields vs. Field frequency: switch between every field returned by the query and only fields whose value frequency crosses a threshold.
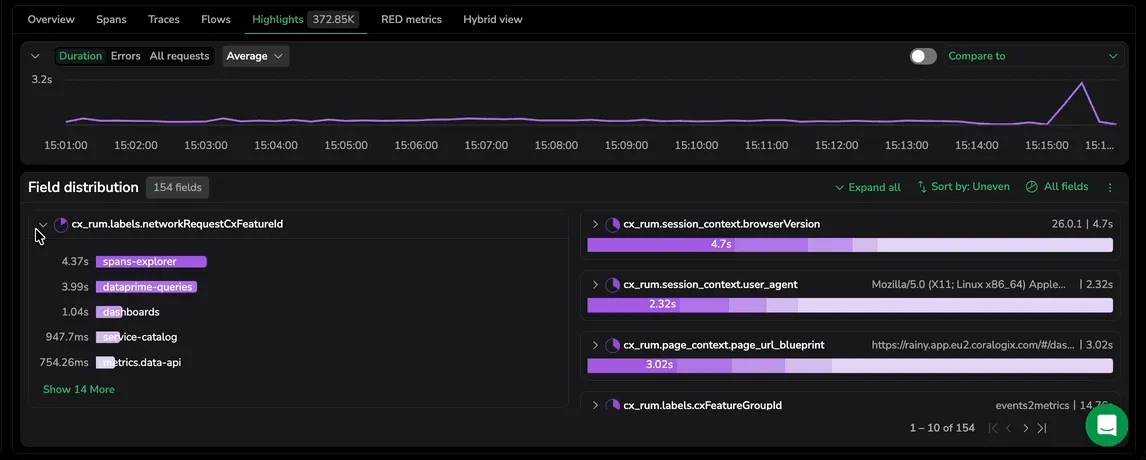
- Expand all / Collapse all: open every card to see all values, or collapse them to scan field names.
The total field count appears next to the panel header (for example, Field distribution 212 fields).
Aggregate values within a field
On the Duration view, each field card has its own aggregation dropdown above the value list. Options: Average, Max, Min, P99, P95. The dropdown controls how each value's duration is summarized when ranking the values on that card—use P99 to surface which endpoint has the worst tail latency, or Max to find the single slowest operation.
Quick actions on a field value
Select the more-actions menu on any field value to act on it without leaving Highlights.
| Action | What it does |
|---|---|
| Include in query | Add the value as an include filter in the query builder. Highlights re-runs against the narrower result set. |
| Exclude from query | Add the value as an exclude filter. |
| Copy to clipboard | Copy the field name and value, formatted for reuse. |
| Show graph for key | Open a focused graph for the selected key so you can drill into its trend without losing the rest of the panel. |
Save and reset
- Save changes: top right of the Explore tab. Saves the current Highlights state as a view. Each Highlights sub-tab (All requests, Errors, Duration) saves independently, so you can keep a dedicated view per investigation pattern.
- Reset: clears Highlights-specific selections (sort, search, comparison) and returns the tab to the default configuration. Reset follows the same scope as the Explore-level Reset.
Share the Highlights view via URL
Select Copy URL at the top of Explore to copy a link that reopens the current view, including your Highlights breakdown. A confirmation message tells you the link is on your clipboard, ready to paste into chat or an incident ticket.
A shared Highlights link preserves:
- Time range: the fixed window you selected, including both windows when Compare to previous period is on.
- View: the active All requests, Errors, or Duration view, with its saved aggregation, sort, and comparison toggle.
- Filters: the span-duration bounds and the query (Builder, Lucene, or DataPrime).
- Layout: the full-screen and expand-all or collapse-all state.
Builder and DataPrime integration
Highlights stays in sync with the rest of Explore. The controls below apply to the Highlights view the same way they apply to Overview, Spans, Traces, Flows, and the RED graphs.
- Errors toggle: narrows Highlights to error spans only.
- Span duration (builder): minimum and maximum in milliseconds, or a percentile filter (
p25,p50,p75,p95,p99). Applies to the spans Highlights analyzes. - Group by and Aggregation: affect the Overview tab; Highlights honors the same query but breaks the result down by field rather than by grouped value.
- Lucene and Builder filters — fully supported.
- Relation filters: every relation filter you add in the query builder (Root, Only root, Parent, Entry service, Child, Any, Not any) drives Highlights, so the graph and field distribution analyze the same span set as the Spans and Traces tabs. When Compare to previous period is on, both windows honor the filter. See Filter by span relationships for how to build a relation filter.
- DataPrime: switch the query bar to DataPrime mode to run a DataPrime query against the spans dataset; Highlights renders the same field distribution against the DataPrime result set.
- Left-side filters: every filter you add from the fields sidebar applies to Highlights.
- Time range: the Explore time picker drives Highlights. The comparison range (when on) is aligned to the active Explore range.
For builder details, see Query builder for spans.
Limits
Highlights queries your spans through DataPrime and returns exact span and field counts for every period—the percentages and counts you see are real, not sampled estimates. Sampling applies only to how values are ordered, never to the counts themselves.
- Field pagination: the panel renders 10 fields per page. Paginate to see more.
- Top values per field: each field card shows the top 20 values; select Show N more at the bottom of the card to load additional values.
- Sort sampling: only the sort order is sampled—Highlights ranks values using a sample of up to 5,000 spans from the active time range. The span and field counts shown for each value are always exact, drawn from the full DataPrime query. Page through results for a complete ranking.
- Long time ranges: if your query range (including any comparison range) extends beyond two weeks, Coralogix fetches the data from All Traces TCO. Expect a longer load.
Use cases
Spike triage and regression analysis
- In Explore, open the Highlights tab.
- Select the Errors view with Sort by: Uneven spread to surface the field most concentrated on a single value—for example,
endpoint = /checkout. - From the field-value quick-actions menu, Include in query to focus on that value.
- Toggle Compare to previous period and review the field distribution's Diff column to find over-represented fields like
region = us-east-1orversion = v2.3. - Switch to the Duration view to check whether those fields also show elevated latency at P99 or P95.
- If the same fields reappear, set the comparison to Previous 7 days to confirm whether the pattern is recurring after a release.
Investigate errors
- Open the Highlights tab and select the Errors view.
- Set Sort by: Uneven spread to surface fields concentrated on a single value, or Even spread to rule out fields whose values are balanced.
- Use Field frequency to limit cards to fields whose values cross a frequency threshold.
- From the quick-actions menu on a suspect value, Include in query and inspect the affected spans in the Spans or Traces tab.
Investigate duration
Switch to the Duration view and choose an aggregation that matches the question you're answering—Max for worst-case behavior, P99 for tail latency, Average for typical flow. Combine with Compare to previous period to confirm regressions.
Compare two deployments
Use Compare to previous period to put the same window before and after a release side by side. The field distribution's Diff column ranks fields by how much each value shifted between the two deployments—useful for spotting regressions in latency or error rate introduced by a specific version. Filter by version or deployment.id in the query builder to scope to just the releases you care about.
Best practices
- Filter first. Narrow your dataset using the query builder before opening Highlights—the smaller the set, the clearer the patterns.
- Use smaller time windows to reduce noise. Once Compare to previous period is on, fine-tune Selection and Comparison from the time picker.
- Avoid high-cardinality fields (UUIDs, event IDs). Focus on
service,version,endpoint, orregion. - Act directly from Highlights. Use Include in query and Exclude from query to update the builder filters in place.
- Use Compare to previous period to validate whether an issue is isolated, new, or recurring.
- For fast results, keep the comparison range in minutes or hours rather than days.
Next steps
See Rate, Errors, and Duration side by side or overlaid in the Signals tab.