Dynamic blocking
Anyone who works with log management is familiar with the situation where a rogue process or a bug introduced into an application creates a flood of logs that overloads your log management system and brings it to its quota limit. Dynamic Blocking can help prevent this situation.
Dynamic Blocking is a scripted solution that uses API calls in order to implement a cap on the amount of data sent to Coralogix from a specific App/Subsystem to prevent an account from reaching its daily quota and being blocked.
How to implement dynamic blocking
We recommend that the script should run every 30 minutes. You can, of course, adapt this time frame but be aware that there are limitations on the number of API calls per minute. You can see the limitations in the Elastic API guide.
The script checks which subsystems have passed their defined threshold and will create an appropriate block rule. One rule will be created for all subsystems associated with the same application.
An additional script needs to be run each day at midnight UTC. Its role is to disable the dynamic block rules that were created and restart the flow of logs into the team.
This document will provide you with the Elasticsearch (ES) and Rules API calls to use in order to implement Dynamic Blocking. You can wrap these calls with additional logic and use the implementation environment of your choice.
API key
To use this API you need to create a personal or team API key. It’s recommended to use permission presets, as they are automatically updated with all relevant permissions. Alternatively, you can manually add individual permissions.
| Preset | Action | Description |
|---|---|---|
| DataQuerying | LEGACY-ARCHIVE-QUERIES:EXECUTE LOGS.DATA-API#HIGH:READDATA LOGS.DATA-API#LOW:READDATA METRICS.DATA-API#HIGH:READDATA SPANS.DATA-API#HIGH:READDATA SPANS.DATA-API#LOW:READDATA | Query Data from the Archive Query Frequent Search Logs Query Monitoring & Compliance Logs Query Metrics Query Frequent Search Spans Query Monitoring & Compliance Spans |
| ParsingRules | PARSING-RULES:READCONFIG PARSING-RULES:UPDATECONFIG | View Parsing Rules Manage Parsing Rules |
Query your data
High priority logs
Query the offending subsystems by logs count
curl --location --request POST 'https://api.eu2.coralogix.com/data/os-api/*/_search' \
--header 'Content-Type: application/json' \
--header 'token: <cx_api_key>' \
--data-raw '{
    "size": 0,
    "query": {
        "bool": {
            "filter": [
                {
                    "range": {
                        "coralogix.timestamp": {
                            "gte": "now/d",
                            "lt": "now"
                        }
                    }
                }
            ]
        }
    },
    "aggs": {
        "Application Name": {
            "terms": {
                "field": "coralogix.metadata.applicationName",
                "size": 30
            },
            "aggs": {
                "subsystemName": {
                    "terms": {
                        "field": "coralogix.metadata.subsystemName",
                        "min_doc_count": 100000,
                        "size": 200
                    }
                }
            }
        }
    }
}'
This is an ES API query. It uses min_doc_count as the daily log count threshold from a subsystem (I used 100,000 as a placeholder). This query returns all subsystems that sent more than min_doc_count logs since midnight UTC. The result is aggregated by application names and lists the subsystems to block.
Query the offending subsystems by logs size
curl --location --request POST 'https://api.eu2.coralogix.com/data/os-api/*/_search' \
--header 'Content-Type: application/json' \
--header 'token: <cx_api_key>' \
--data-raw '{
    "size": 0,
    "query": {
        "bool": {
            "filter": [
                {
                    "range": {
                        "coralogix.timestamp": {
                            "gte": "now/d",
                            "lt": "now"
                        }
                    }
                }
            ]
        }
    },
    "aggs": {
        "application": {
            "terms": {
                "field": "coralogix.metadata.applicationName",
                "size": 30
            },
            "aggs": {
                "subsystem": {
                    "terms": {
                        "field": "coralogix.metadata.subsystemName",
                        "size": 100
                    },
                    "aggs": {
                        "Sub_Size": {
                            "sum": {
                                "field": "_size"
                            }
                        }
                    }
                }
            }
        }
    }
}'
Medium priority logs
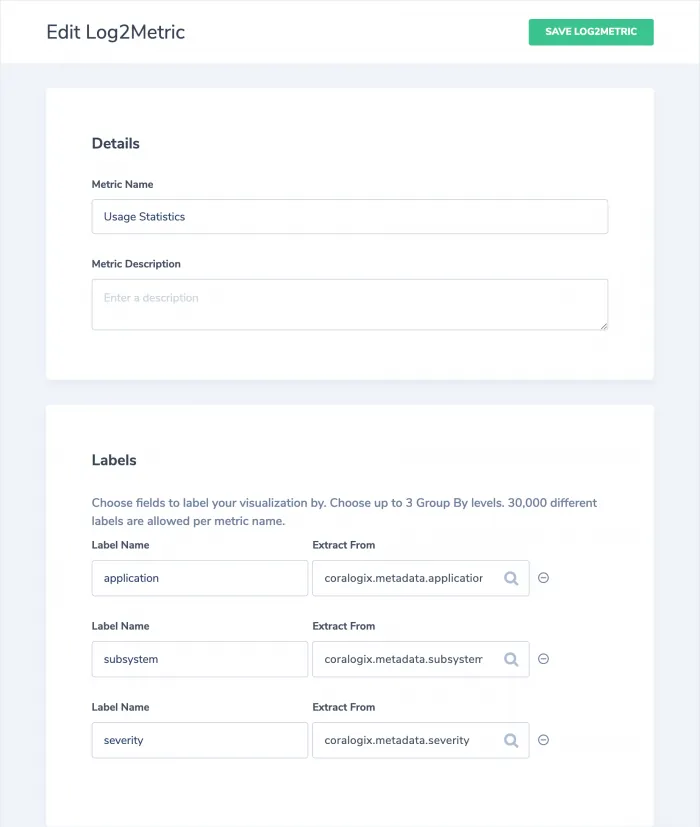
In order to apply this script on medium logs, we will use log2metrics and query it instead of the default index.
Metric definition
Follow the L2M tutorial and create a metric as described on this screenshot:
Query the offending subsystems by count
curl --location --request POST 'https://api.eu2.coralogix.com/data/os-api/*:*_log_metrics*/_search' \
--header 'Content-Type: application/json' \
--header 'token: <cx_api_key>' \
--data-raw '{
    "size": 0,
    "query": {
        "bool": {
            "filter": [
                {
                    "query_string": {
                        "query": "name:\"Usage Statistics\""
                    }
                },
                {
                    "range": {
                        "coralogix.timestamp": {
                            "gte": "now/d",
                            "lt": "now"
                        }
                    }
                }
            ]
        }
    },
    "aggs": {
        "application": {
            "terms": {
                "field": "labels.application.value",
                "size": 30
            },
            "aggs": {
                "subsystem": {
                    "terms": {
                        "field": "labels.subsystem.value",
                        "size": 100
                    },
                    "aggs": {
                        "Logs_Count_Sub": {
                            "sum": {
                                "field": "docsCount"
                            }
                        }
                    }
                }
            }
        }
    }
}'
Block your data -
Get all team rules
curl --location --request GET 'https://api.eu2.coralogix.com/api/v1/external/rules' \
--header 'Content-Type: application/json' \
--header 'Cache-Control: no-cache' \
--header 'Authorization: Bearer <cx_api_key>'
Create a group of rules
curl --location --request POST 'https://api.eu2.coralogix.com/api/v1/external/group' \
--header 'Content-Type: application/json' \
--header 'Cache-Control: no-cache' \
--header 'Authorization: Bearer <cx_api_key>' \
--data-raw '{
	"name":"auto_APP_NAME"
}'
Create a rule
curl --location --request POST 'https://api.eu2.coralogix.com/api/v1/external/rule/GROUP_ID' \
--header 'Content-Type: application/json' \
--header 'Cache-Control: no-cache' \
--header 'Authorization: Bearer <cx_api_key>' \
--data-raw '
{
    "name": "auto_APP_NAME",
    "description": "DO NOT CHANGE, Created via API",
    "enabled": true,
    "rule": "\\bSUBSYSTEM_NAME_01\\b",
    "sourceField": "subsystemName",
    "type": "block",
    "keepBlockedLogs":false
}'
Update a rule
curl --location --request PUT 'https://api.eu2.coralogix.com/api/v1/external/rule/RULE_ID/group/GROUP_ID' \
--header 'Content-Type: application/json' \
--header 'Cache-Control: no-cache' \
--header 'Authorization: Bearer <cx_api_key>' \
--data-raw '{
	"name":"auto_APP_NAME",
	"enabled": true,
	"rule": "\\bSUBSYSTEM_NAME_01\\b|\\bSUBSYSTEM_NAME_02\\b|\\bSUBSYSTEM_NAME_03\\b",
	"sourceField": "subsystemName",
	"type": "block"
}'
Disable a rule
curl --location --request PUT 'https://api.eu2.coralogix.com/api/v1/external/rule/RULE_ID/group/GROUP_ID' \
--header 'Content-Type: application/json' \
--header 'Cache-Control: no-cache' \
--header 'Authorization: Bearer <cx_api_key>' \
--data-raw '{
	"name":"auto_APP_NAME",
	"enabled": false,
	"rule": "AUTODISABLED",
	"sourceField": "subsystemName",
	"type": "block"
}'
Block rule example
Now let’s combine all the above building blocks and create the script. You can use the implementation environment of your choice (this is why we're using pseudo-code). You can, of course, add additional logic.
Run the "get all team rules" call to return a list of all existing team rules.
For each {application}  {

    Check if (application_dynamicBlock rules group exists)

Save the rule ID {}

Else use the "**group create**" call to create a new group of rules, name it: application_dynamicBlock. Use the "**rule create**" call to create the rule, name it application_dynamicBlock as well. Save the rule ID. {}

For each {subsystem} {

      Use the "**rule update**" call, add the subsystem name to the rule's [regex](https://coralogix.com/blog/regex-101/).

Rule example:

\\bSUB_SYSTEM_1\\b|\\bSUB_SYSTEM_2\\b|\\bSUB_SYSTEM_3\\b

}

}

At 00:00 UTC

Run the "**get all team rules**" call to return a list of all existing team rules.

For each {rule} {

    If {rule name contains the const value in its name}

        Save the rule id

}

For each {rule}

    Run "**disable rule"** call to disable the rule

}
Notes:
- You can not have more than one block rule per group. Each group contains one rule that blocks all offending subsystems associated with one specific application.
- Coralogix has a limitation on the number of rules per team. The default is 30 rules. Make sure that you have enough rules left in your account.
- Blocked data is not necessarily lost. You can use our new soft block feature. It allows you to query these logs in real-time through the Livetail and archive them in your S3 bucket. This option saves you 70% of the blocked logs volume towards the quota. To enable this option you can change the value of "KeepBlockedLogs" parameter to true in the ‘create rule’ API call.
Additional resources
| Coralogix Endpoints | Coralogix Endpoints |